

gguy44/iStock via Getty Images
(This article was co-produced with Hoya Capital Real Estate)
Introduction
This is the third in a series on single-state-focused Municipal Bond closed-end funds (“CEFs”). This time the two funds are from competing managers designed for people who owe high New Jersey income taxes. The highest income tax rate there is 10.75%; only topped by California (13.3%) and Hawaii (11%). The current NJ tax brackets are:
state.nj.us/treasury/taxation/taxtables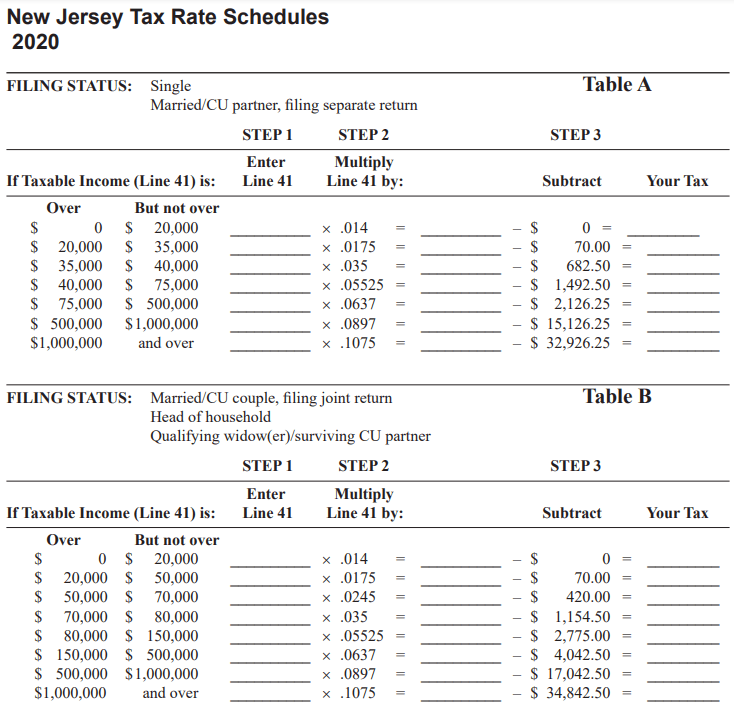
Since the website was recently updated and other sites confirmed, these rates are still in effect (for now). I believe Governor Phil Murphy still believes the “rich” are not paying their “fair share,” so another rate bracket could get added, as he did back in 2020. Regardless, residents are subject to “bracket creep” as they are not adjusted for inflation.
This article covers both the BlackRock MuniHoldings New Jersey Quality Fund (NYSE:MUJ) and the Nuveen New Jersey Quality Municipal Income Fund (NYSE:NXJ). Data since NXJ started favors MUJ, but more recent data shows just the opposite. Investors who invest based primarily on a CEF’s discount might prefer NXJ. Other funds are appealing, too, and those comparisons are shown in the Portfolio Strategy section.
BlackRock MuniHoldings New Jersey Quality Fund review
Seeking Alpha describes this CEF as:
The Fund investment objective is to provide shareholders with current income exempt from federal income tax and New Jersey personal income taxes. The Fund seeks to achieve its investment objective by investing primarily in long-term, investment grade municipal obligations exempt from federal income taxes and New Jersey personal income taxes. Under normal market conditions, the Fund invests at least 80% of its assets in municipal obligations with remaining maturities of one year or more at the time of investment. The Fund may invest directly in such securities or synthetically through the use of derivatives. Benchmark: S&P Municipal Bond TR. MUJ started in 1998.
Source: Seeking Alpha.
MUJ has $407m in assets and shows a forward yield of 5.1%. BlackRock charges 144bps in fees, broken down as:
- Management fees: 81bps
- Other expenses: 8bps
- Leverage costs: 55bps (ratio 41.5%)
MUJ holdings review
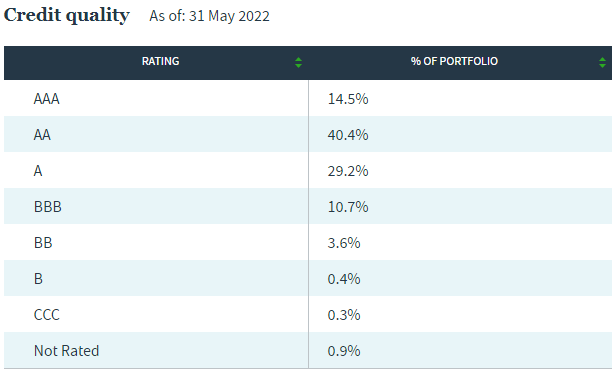
BlackRock provides these basic elements of the portfolio’s composition.
Blockrock.com MUJ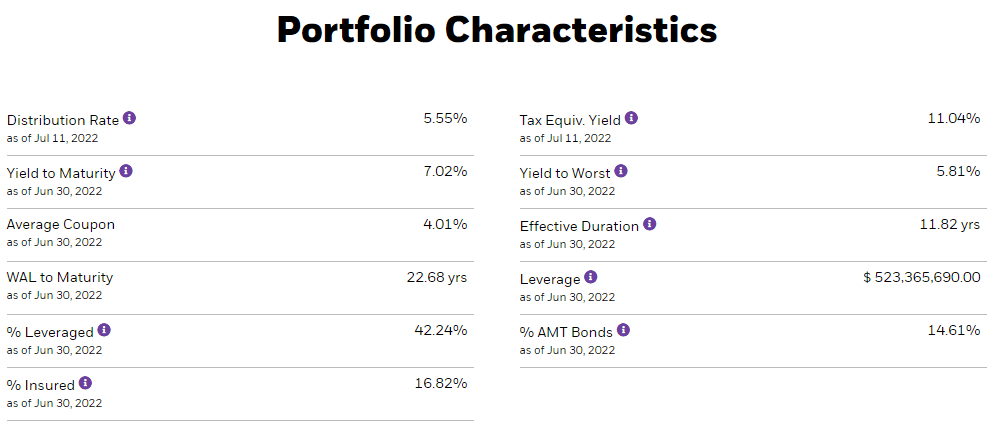
Most of this data is more current than what Nuveen has posted, so keep that in mind when comparing the two.
Blackrock.com MUJ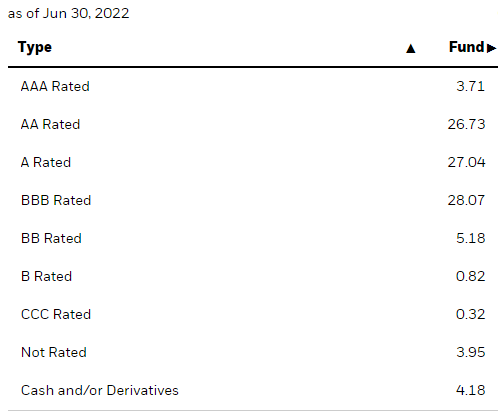
MUJ has a slightly lower allocation to Investment-grade bond, thus Morningstar gives it a “A” overall rating.
Nuveen.com NXJ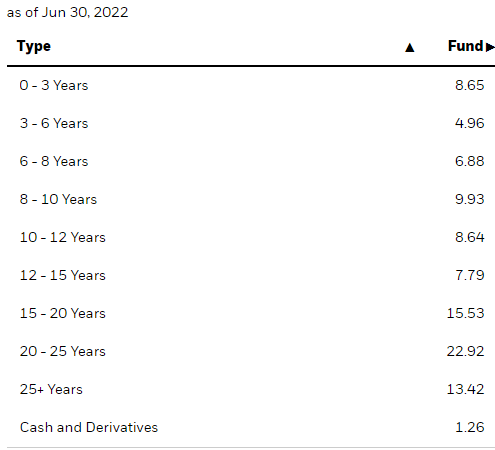
Here the two funds differ by a wide margin, with the WAM for MUJ 8 years longer than NXJ. While date difference could play a part, not by that much. Somewhat of a surprise is, despite the longer duration and maturity values, MUJ has performed better in 2022! Only about 9% of the bonds mature in the next three years, limiting the fund from adding higher coupon bonds while rates are rising. About 22% are callable over that timeframe but less of that will occur if rates are climbing.
The sector allocations are:
Blackrock.com MUJ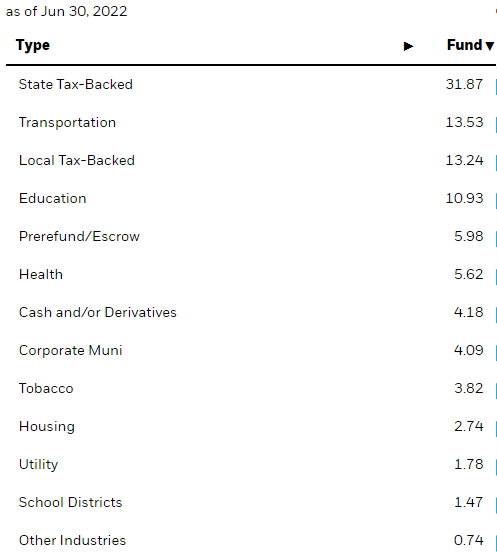
State and local backed positions (I assume via tax revenue) account for a large 45% of the portfolio, in a state with some of the highest income and property taxes already. Like NXJ, transportation bonds at 13.53% play a large part, too.
Blackrock.com MUJ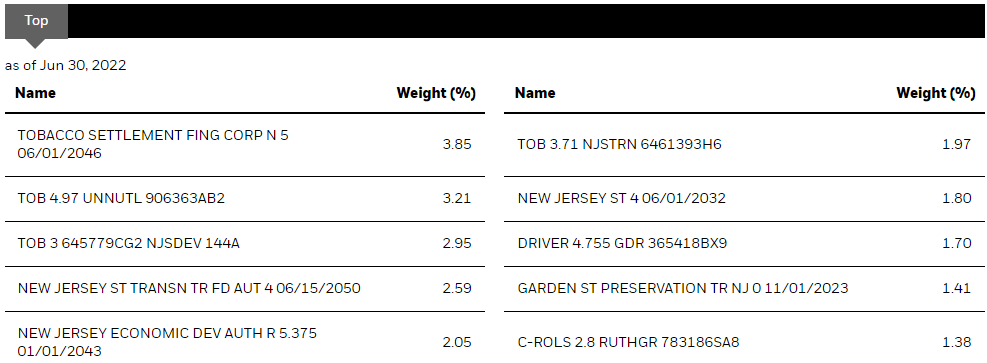
The Top 10, out of 288, equate to about 22% of the portfolio. No link to total holdings or list of top issuers was found.
MUJ distribution review
seekingalpha.com MUJ DVDs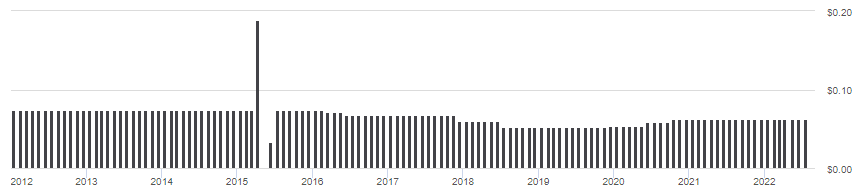
While MUJ has shown past cuts, they have raised the payout twice since COVID struck. There has not been an increase since interest rates started climbing, though. The current rate is $.063 monthly. The latest UNII ratios are not promising for a payout bump; more likely a cut.
Blackrock.com UNII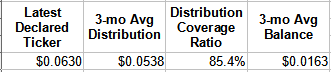
I did not find any document that said MUJ uses a Managed Distribution Policy. I did find a 19-a that shows 34% of the current fiscal year payouts are currently classified as ROC, showing BlackRock is willing to use ROC to maintain payouts.
blackrock.com 19-a PDF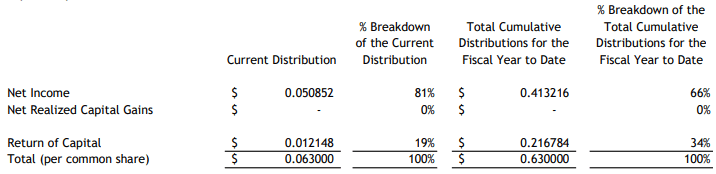
MUJ price and NAV review
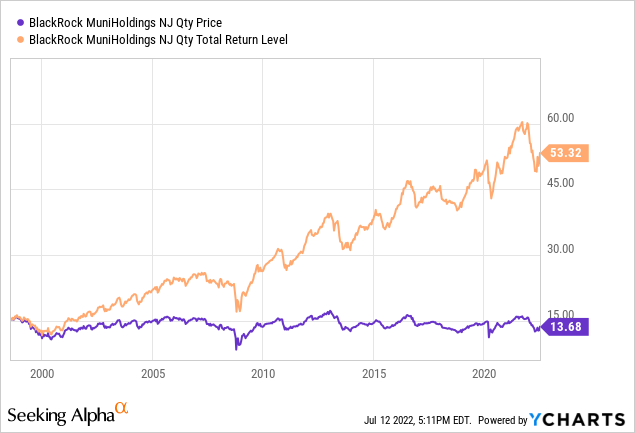
MUJ has suffered $1.32 price erosion since starting but has provided re-investors a 5.40% ROI; for those who pocketed the payouts, 3.27%. The next chart shows how the price and NAV have moved.
CEFConnect.com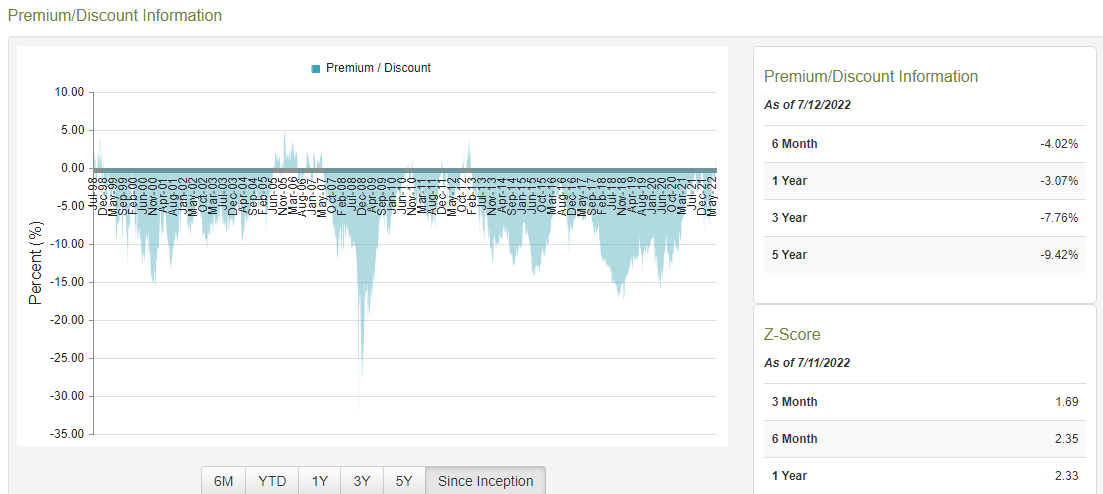
AS the chart shows, MUJ has spent of the time selling at a discount, but in June it moved to a premium which currently stands at 2%. A 4%+ discount was common in early 2022, then the price stabilized while the NAV still declined, as shown next.
CEFconnect.com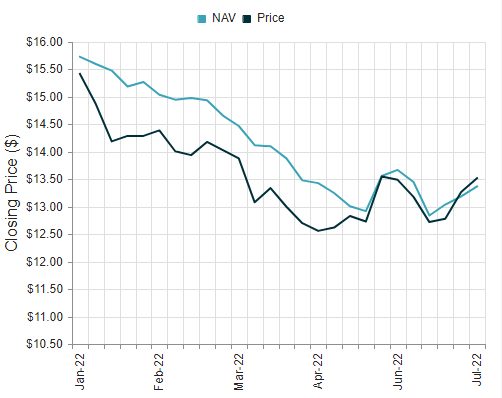
The above Z-score indicates the current premium is not MUJ’s normal state.
Nuveen New Jersey Quality Municipal Income Fund review
Seeking Alpha describes this CEF as:
The Fund’s investment objectives are to provide current income exempt from regular federal and New Jersey income tax and to enhance portfolio value. The Fund invests in municipal securities that are exempt from federal and New Jersey state income taxes. The Fund invests at least 80% of its managed assets in securities rated, at the time of investment, investment grade (Baa/BBB or better by S&P, Moody’s, or Fitch) or, if they are unrated, are judged by the manager to be of comparable quality. Benchmark: S&P Municipal Bond TR. NXJ started in 1999.
Source: Seeking Alpha.
NXJ has $529m in assets and has a forward yield of 5.35%. Nuveen’s fees are 143bps, broken down as:
- Management fees: 89bps
- Other expenses: 6bps
- Leverage costs: 48bps (ratio 40.7%)
NXJ holdings review
Nuveen provides some basic portfolio characteristics (latest data available).
Nuveen.com NXJ Nuveen.com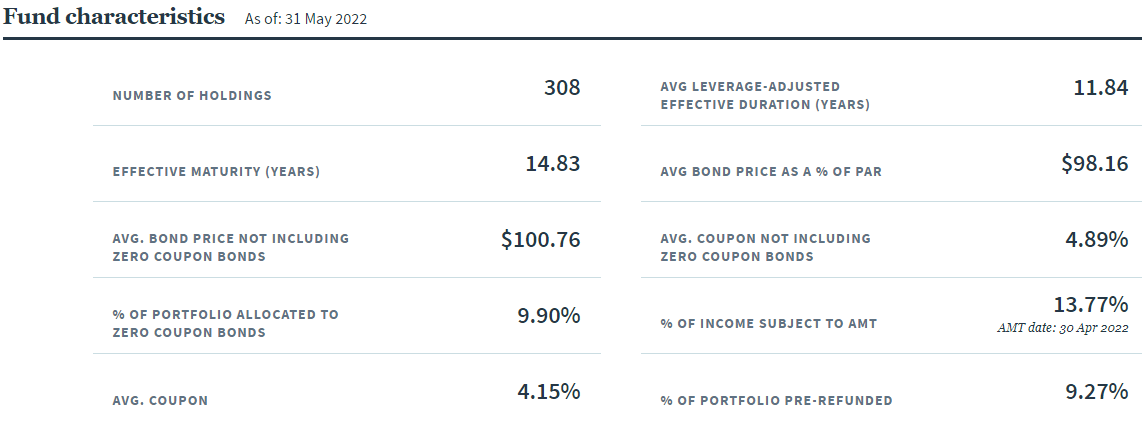
Almost 95% of the weight is rated Investment-grade, with under 1% in the high-risk ratings of B or lower. Morningstar gives an overall rating of “A+” on this portfolio. The maturity allocation is typical for a muni-bond fund, with the WAM being close to 15 years, duration almost 12.
Nuveen.com NXJ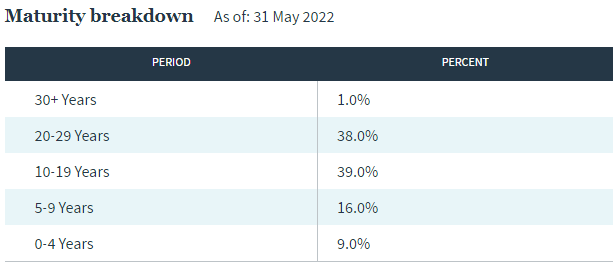
While only 9% mature before 2026, 25% of the portfolio is callable in the next two years, though that gets less likely as the cost of new issues rises. Bonds are spread across multiple sectors, with direct taxes supporting 30% of the bonds. Bonds dependent on travel revenue are the next largest sector.
Nuveen.com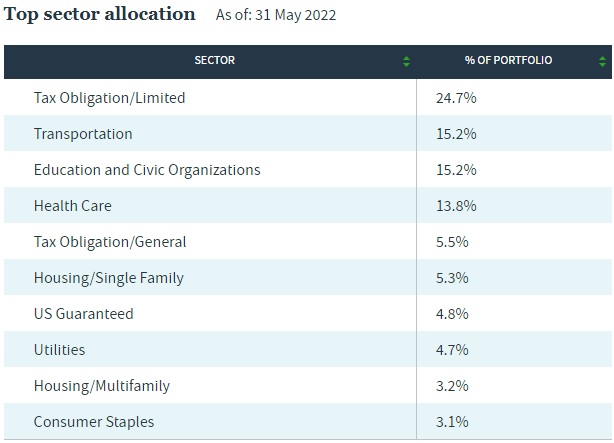
The top issuers for NXJ are:
Nuveen.com NXJ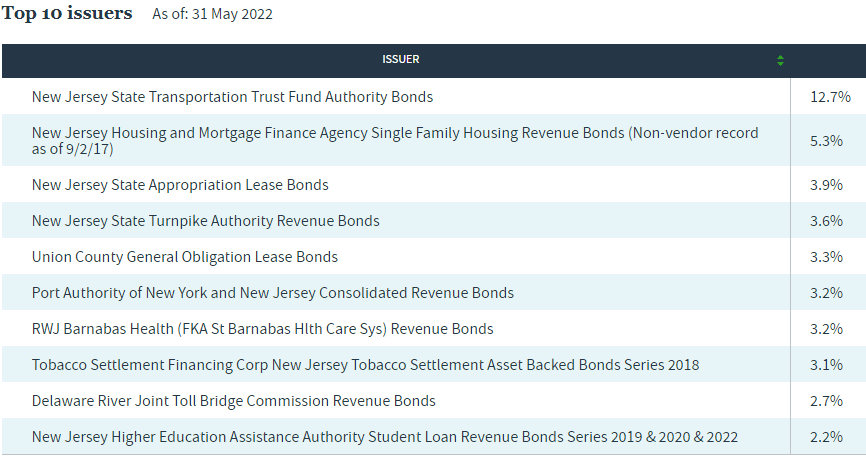
Top 15 holdings
Nuveen.com; compiled by Author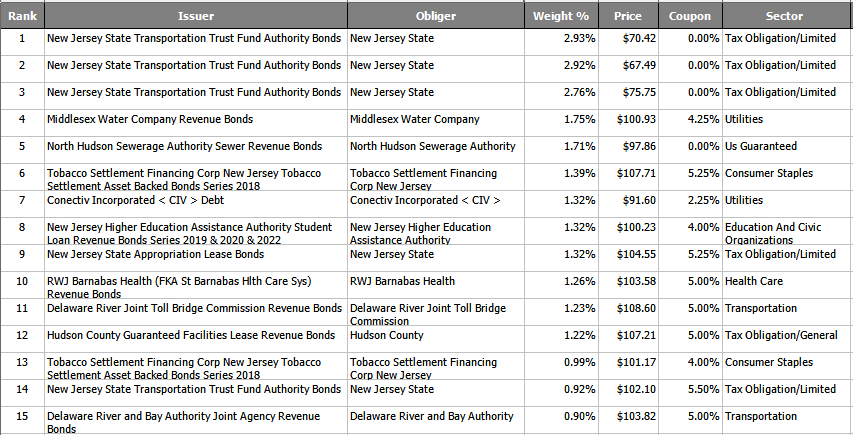
About 21% of the portfolio has default insurance.
NXJ distribution review
Nuveen.com NXJ seekingalpha.com NXJ DVDs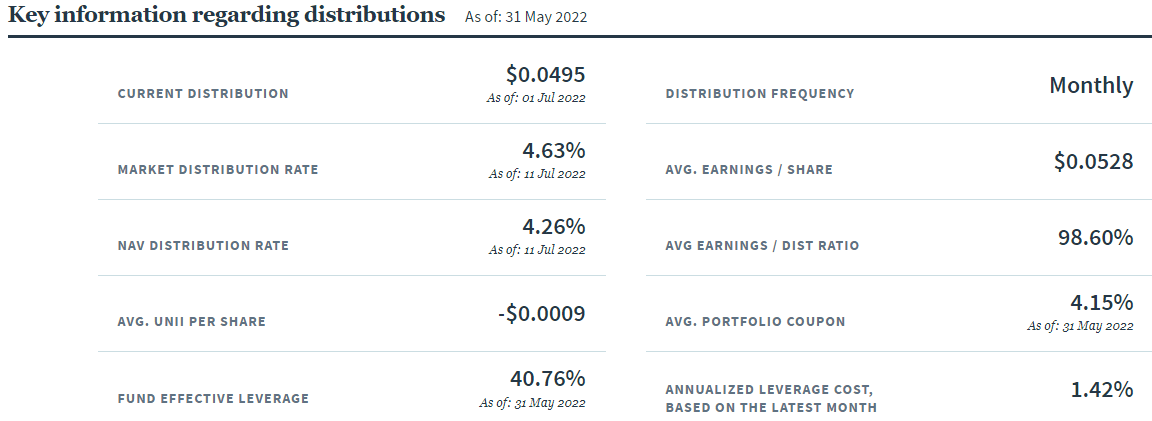
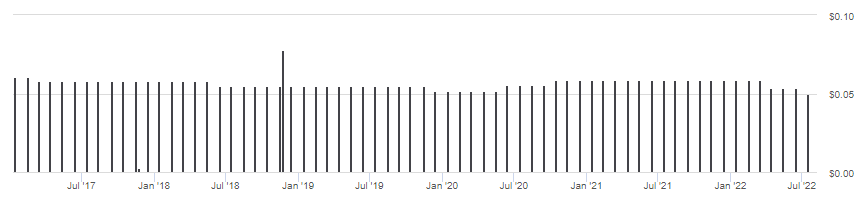
Recent payout history is in the wrong direction: two cuts in 2020 so far. The latest monthly rate is now $.0495, down from $.0585 at the end of 2021. Most of the Nuveen state Muni CEFs reduced their payouts recently. The above 98.6% coverage was before the recent reduction in the payout.
I did not find any document indicating NXJ uses a Managed Distribution Policy, nor did I find any indication that ROC was used to meet recent payouts.
NXJ price and NAV review
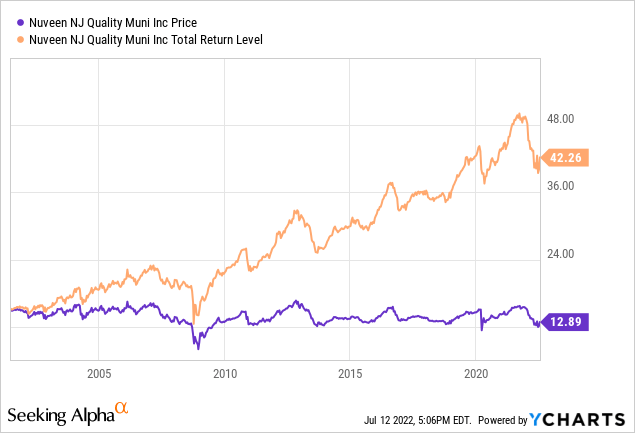
NXJ has suffered just over a $2 price erosion since starting but has provided re-investors a 4.98% ROI; for those who pocketed the payouts, 3.28%. The next chart shows how the price and NAV have moved.
CEFConnect.com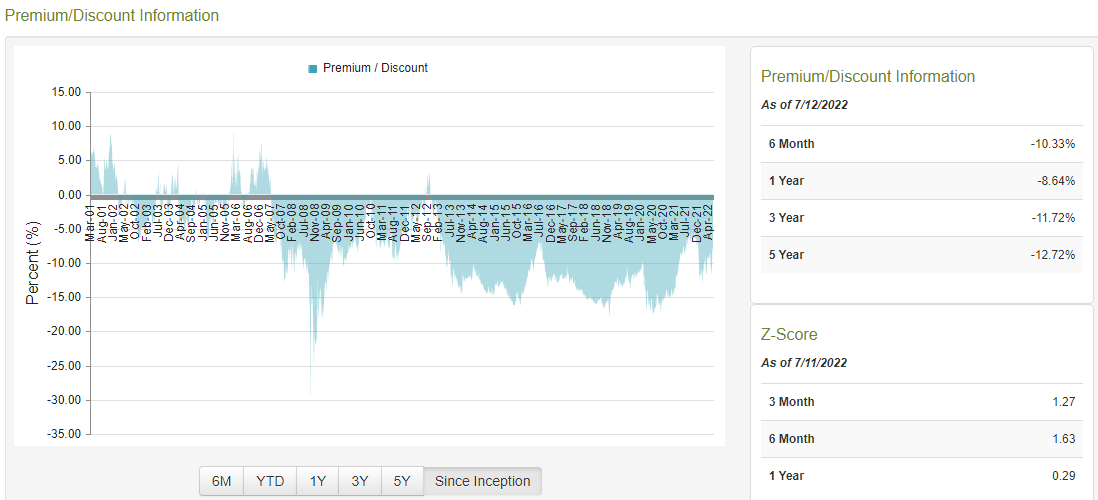
Like MUJ, NXJ has sold at a discount almost continually since 2007 and currently trades at a 8% discount. While good, it is still less than the 10-15% discounts available most of the last decade. While better, NXJ still shows positive (meaning poor) Z-scores. The smallest discount over the past year is just under 6%.
Comparing the CEFs
| Factor | MUJ | NXJ |
| Asset Size/# | $247m/288 | $529m/308 |
| Fees | 144bps | 143bps |
| Premium/Discount | +2% | -8% |
| Weighted Duration/Maturity | 11.8/22.7 | 11.8/14.8 |
| Leverage ratio | 29% | 41% |
| Yield (mkt) | 5.08% | 4.63% |
| Portfolio Bond rating | A | A+ |
| Weighted Coupon (non-zero) | 4.73% | 4.89% |
| Weighted Price (non-zero) | $104.10 | $100.76 |
Backtest Portfolio Asset Allocation
PortfolioVisualizer.com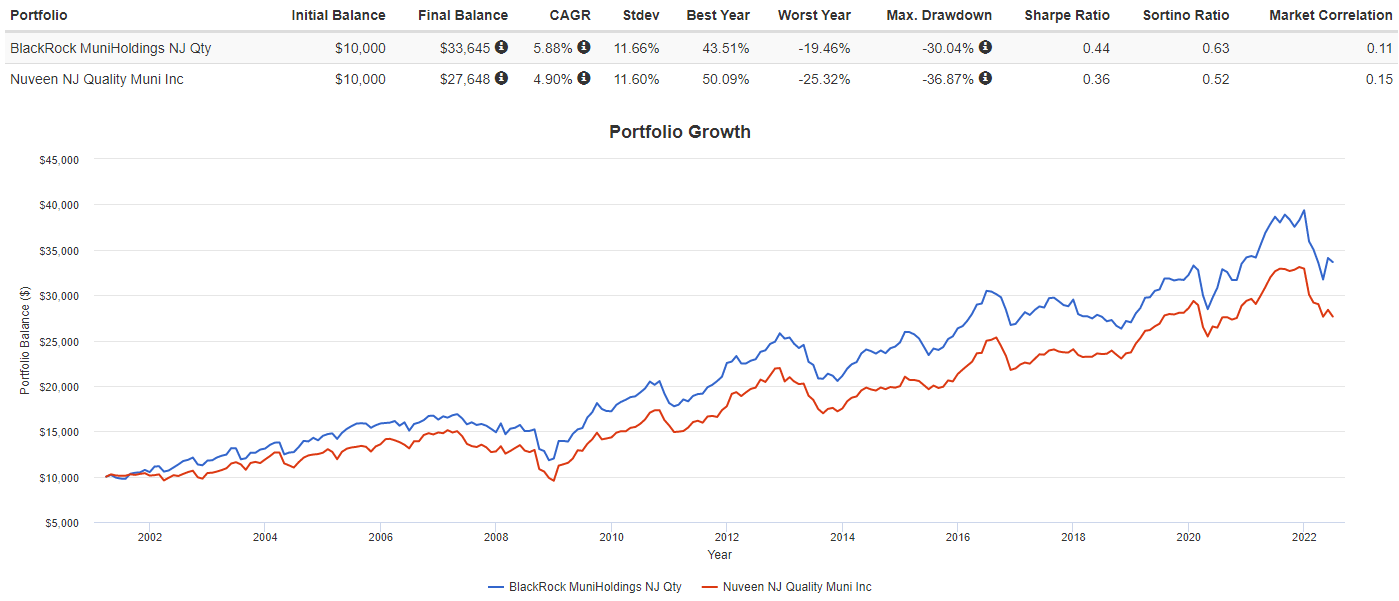
Since NXJ started in 2001, MUJ has provided better returns with risk to investors resulting in superior Sharpe and Sortino ratios. Depending how investors feel about buying a fund selling at a small premium versus 8% discount, I see MUJ as the better play between these two New Jersey Muni CEFs.
Portfolio strategy
Investors who experience a high marginal tax rate from the state or states they have to file in should research for funds that might provide better after-tax returns than taxable bond funds or national municipal funds.
Using taxable funds instead
Here I will compare both NJ funds against the Nuveen Taxable Municipal Income Fund (NBB) and the BlackRock Corporate High Yield Fund (HYT).
portfoliovisualizer.com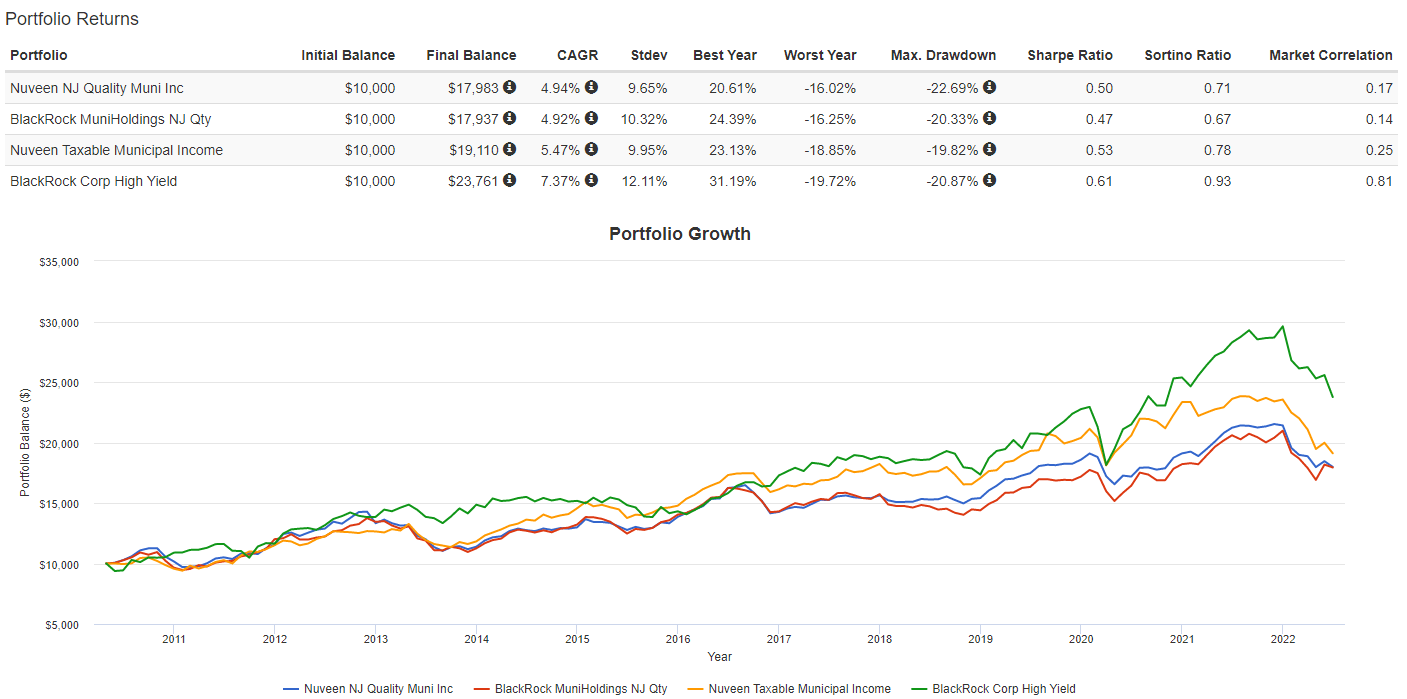
Here we see, since 2010, the two NJ-only funds showing CAGRs within 2bps. The Taxable Muni CEF was ahead by just over 50bps, which mostly likely puts its after-tax CAGR behind both NJ-only funds. New Jersey investors should look deeper at BlackRock’s High-Yield CEF, as it outpaced the NJ-only funds by almost 250bps. Sharp eye will notice the MUJ CAGR advantage from 2001 is almost erased when using data from 2010, a reminder that dates matter.
Using national municipal funds instead
Before investing in a single-state Municipal CEF, one should see if their after-tax return owning a National Municipal CEF should be used instead. For that, I picked one popular CEF from each manager to compare against. The two CEFs are:
- Nuveen Quality Municipal Income Fund (NAD): 3% NJ bonds
- BlackRock MuniAssets Fund (MUA): 6% NJ bonds
portfoliovisualizer.com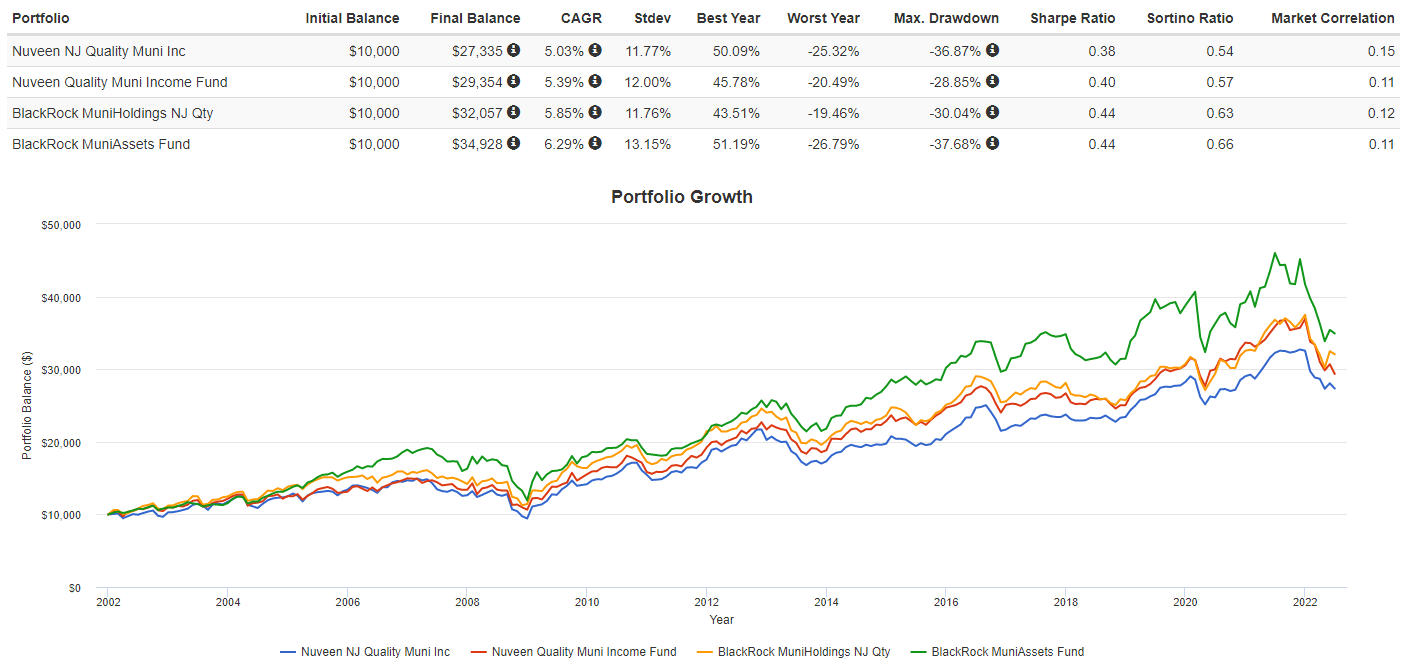
Both national CEFs provide better CAGRs than the manager’s NJ-only CEF, but the 36bps or 44bps difference probably would be removed once the extra NJ state income tax bite was applied.
Be the first to comment