

WANAN YOSSINGKUM
Recent Situation
The recent market rout has brought many adjacent capital market multiples down, with NTM P/E valuations dropping by 32%.
TIKR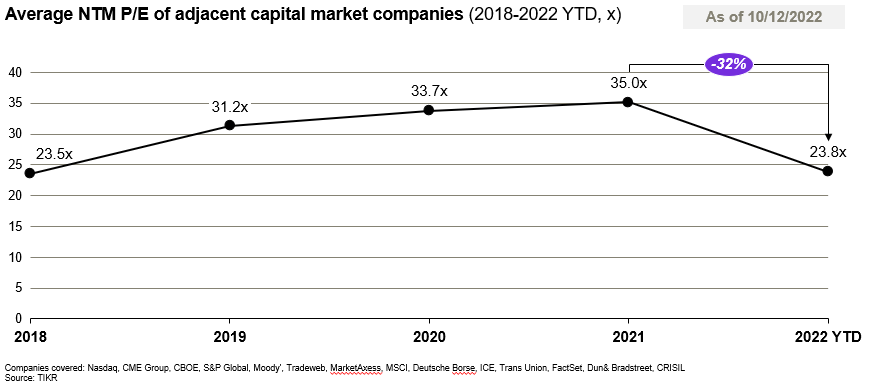
However, for some due to the non-cyclical nature of the business, this might represent a good buying opportunity for MSCI (NYSE:MSCI).
Company Description
MSCI is an adjacent financial services firm which supports the primary industry through its data-analytics service, research and market index services.
MSCI has three revenue model across four business units (‘BUs’)
- Recurring subscription (70% of revenue): where customers subscribe to MSCI’s data analytics service (e.g. portfolio management)
- Asset-based fees (27% of revenue): where a fund product (e.g. ETF) pays a fee (around 2.5 bps) for every AUM in an ETF product which uses MSCI as a benchmark:
- Non-recurring (3% of revenue): one-off project
These three revenue model cut across 4 business units (BU):
- Index (61% of revenue): provides market indexes in many area of investment opportunities (e.g. ETFs, futures, mutual funds), performance benchmarking, portfolio construction and asset allocation
- Analytics (27% of revenue): provides tools and capabilities for risk management, performance attribution and portfolio management content
- ESG & Climate (8% of revenue): products and services (e.g. data, ratings, tools, research) for institutional investors understand how ESG and climate can impact long-term risk and return of their portfolio
- Others – Private Assets (4% of revenue): market data, research, and benchmark for real estate market and private fund data
In our view, it is best to analyze MSCI from a BU point of view first and then revenue model.
Revenue matrix breakdown (2021, USD Mn):
MSCI investor document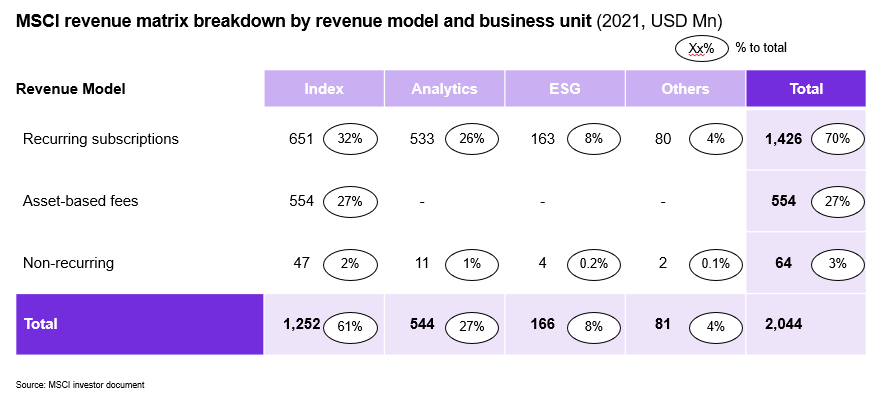
Financial Performance
MSCI’s revenue has grown by +13% CAGR from 2017-2021, with most of the growth coming from BU Index (+15% CAGR) and BU ESG and Others (+26% CAGR).
MSCI investor document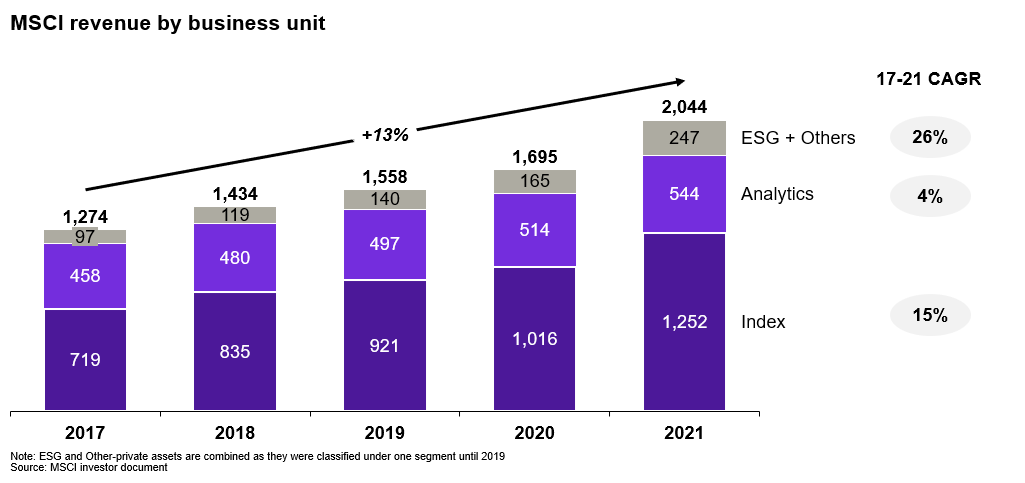
Majority of the growth in BU Index are driven by:
- Recurring subscriptions (+11% CAGR): growing demand mainly in ‘Custom and Specialized’ , ‘Factors & ESG’.
- Growth is in-line with overall market trends of growing popularity of factor investing and more recently ESG investing
- Asset-based fees (+19% CAGR): primarily driven by increasing AUM from funds linked to MSCI indexes
For BU ESG and Others:
- ESG: overall strong demand for their ratings, climate and screening products as ESG gain popularity
- Others: mainly driven by recent acquisition of RCA (a real-estate analytics firm) and organic growth from MSCI’s owned products (~10% CAGR)
In regards to profitability, MSCI’s Adj. EBITDA margin % has expanded nicely from 52% in 2017 to 59% in 2021. All of its BU except for ESG, have seen margin expansion by cost efficiency and large scale (lower CoS and marketing efficiency). BU ESG will not likely see any margin expansion anytime soon as MSCI is currently investing for BU ESG to grow.
MSCI investor document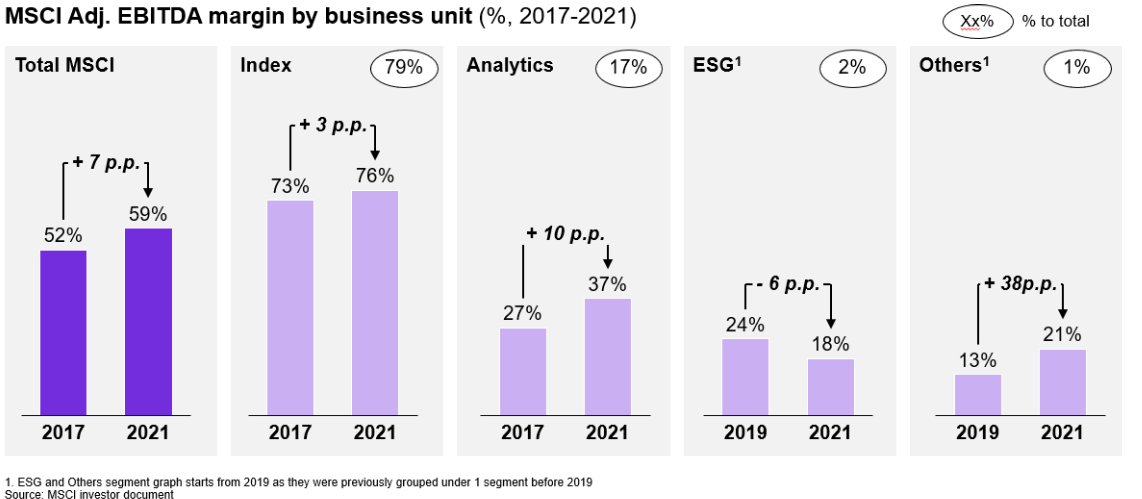
Industry
There are three current industry trends that are favorable for MSCI growth:
- The continued search for alpha by active managers
- Growing demand for ETF
- Rising relevance and popularity of ESG and Climate finance
1. Continued search for alpha by active managers boosting demand for data analytics
Like we all know, active fund share of the pie has been shrinking over the past decade with one primary reason being that many of the active funds underperform their benchmark.
US market Simfund, BCG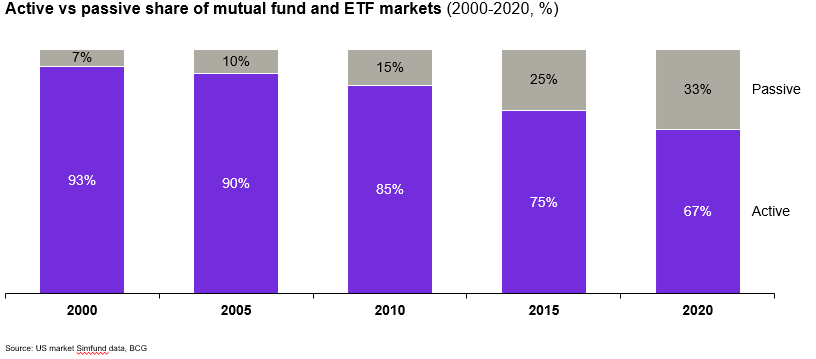
However, not all active funds suffer. Those who have shown value/alpha still see net inflow, while those who don’t do not. Funds with morningstar ratings of 4-5 (46% of total AUM), saw inflows of 12-13%. On the other hand, those with ratings of 1-3, saw flows decline from -12% to -32%.
Simfund, BCG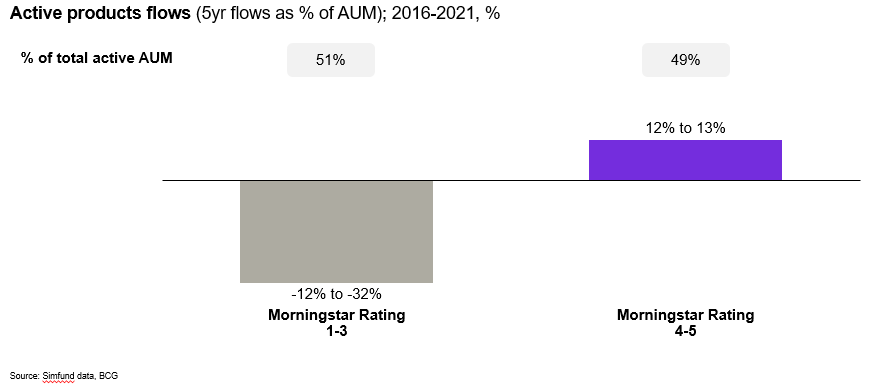
Pressured by the need to find Alpha, many fund managers sought to gain an edge through foraying their investment scope into new fields (at the time), such as smart beta and factor investing and invested more into big data and alternative data sources.
Burton Taylor, BCG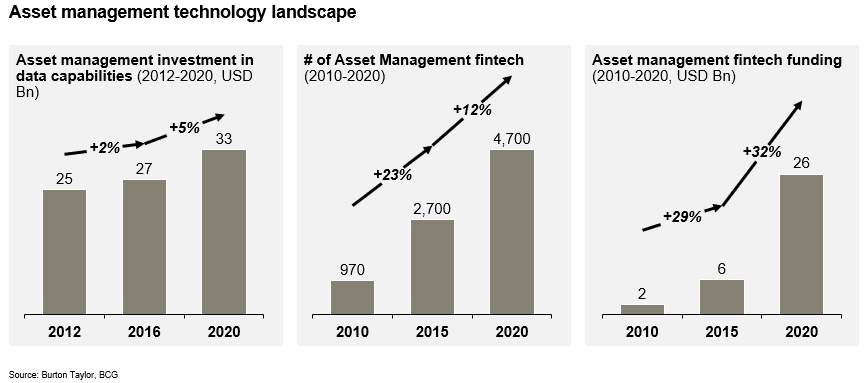
2. Growing demand for passive ETF and smart beta ETFs boosting demand for index services
As shown before, the pie share of passive funds have grown massively. As they grow, the volume needed for an index also grew as more AUM flows into benchmark-tracking ETFs (passive and smart beta). In addition, several factor ETFs have also popped up such as low volatility, boosting the demand for indexes further.
Proxy for smart beta / factor investing demand – Parametric Asset Growth (leading factor investing overlay provider):
Easton Vance Investor Document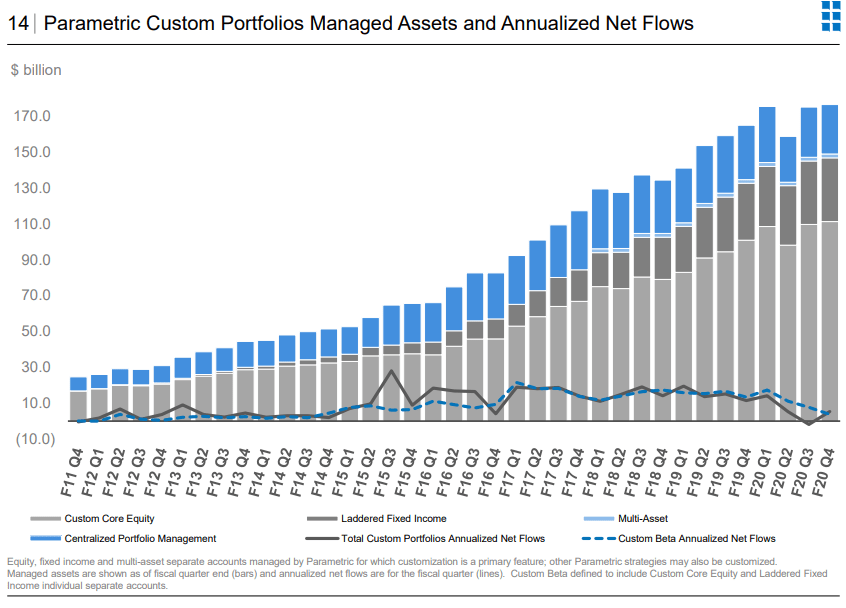
3. Rising popularity of ESG and Climate Finance
The global push to achieve 2050 net-zero carbon emissions by 2050 represents good opportunity for the capital markets. The total demand for climate transition capital for the next 30 years is estimated to be around USD 100-150Tn (from BCG).
In addition, there is also an increase in investor demand for ESG based products as shown in the rapid increase of fund flows into ESG assets. Thus, this also increase the demand for adjacent research/services products such as ESG analytics.
SPGI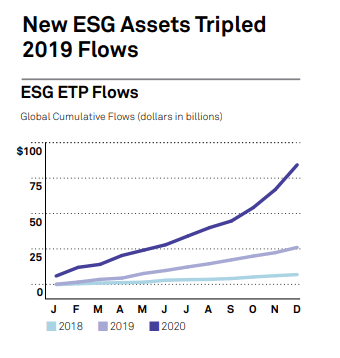
Thesis
The investment thesis for MSCI is straightforward:
- Diversified business model (SaaS-like) to weather market volatility
- Market fit products to reap industry tailwinds
- Strong focus on profitability margin protection
- Optionality from ESG and Private Asset growth
1. Diversified business model – akin to SaaS
One of the most desirable characteristics of an investable company, is to have predictable revenues. As mentioned before in the front, ~70% of MSCI’s revenue is recurring and only ~30% is somewhat cyclical (market driven).
For 2022, the equity market has been hit hard with stock indexes declining -23%, but MSCI was still able to grow its total revenue by +11% in Q2’22, thanks to its recurring business. Although note that as expected, Asset-based fee revenue declined -3% due to market value driven AUM decline (-USD 200Bn of value from market decline)
2. Market fit products to reap industry tailwind
Product 1 – BU Index
MSCI’s index’s analytics product suite cover the whole E2E investment process:
- Portfolio construction: supports asset allocation across multiple factors (factor investing) – in-line with industry trends
- Risk management: allows asset allocators to manage risk through multiple factor (again, factor investing)
- Reporting: benchmarking performance against a custom-factor index
- Portfolio management: performance attribution of several factors breakdown
Product 2 – BU Analytics
Two of MSCI’s products’ ‘Equity Portfolio Management’ and ‘Multi-Asset Class Solutions (‘MAC’) are also benefitting from current industry trend
- Equity Portfolio Management:
- Benefit from increasing usage of Factors
- Portfolio customization
- Model data
- Integration of ESG and Climate into portfolio construction
- Multi Asset Class Solutions
- Large demand for multi-asset solutions
- Increasing demand for risk solutions for new problems in the multi-asset space (e.g. liquidity, climate change, etc)
- Mass portfolio personalization for wealth managers
In addition, MSCI is entering into the fixed income market analytics with an estimated USD 200Mn opportunity. The results so far have been fruitful with run rate growth of 20% YoY in 2Q 22. There is also sales synergy from MSCI’s existing multi-asset class client base.
3. Strong focus on margin preservation
As some part of the business (~30%) is cyclical and follows the ebbs of market, there will be times (like now) where AUM will decline and will have a negative impact to MSCI’s asset-based revenue. In fact, ABS Q2 revenue saw a decline of -3% .
To mitigate the impact, MSCI has turned to actively manage its downturn playbook to preserve its margins, with FY expenses forecasted to decrease by ~USD 30Mn from previous guidance. MSCI has also managed to increase its Adj. EBITDA margin by +80bps YoY in Q2’22.
4. Optionality from ESG and Private Asset growth
In 2020, MSCI decided to split its ESG business segment from its “Others private asset” segment to give more focus and invest in its growth. MSCI is currently the leader in ESG with 45+ years of experience covering the space.
MSCI investor document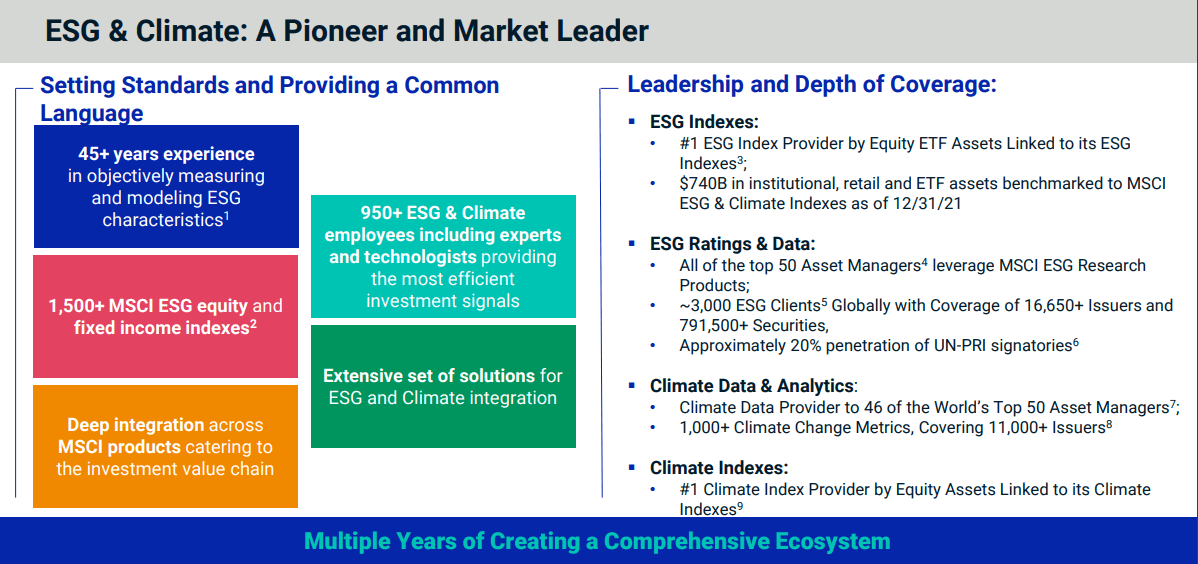
MSCI has also seen strong growth recently from its ESG product suite, with 5 year CAGR of 35% (market is forecasted to grow +16% CAGR).
MSCI investor document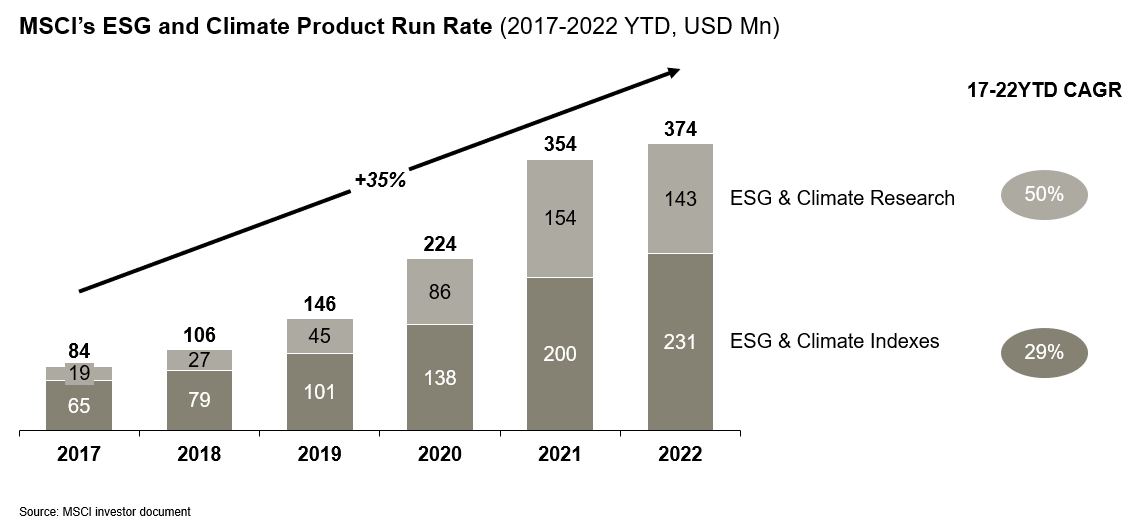
For additional color, SPGI is also forecasting a rapid increase in their ESG product suite with CAGR of 45% CAGR until 2025.
SPGI Investor handbook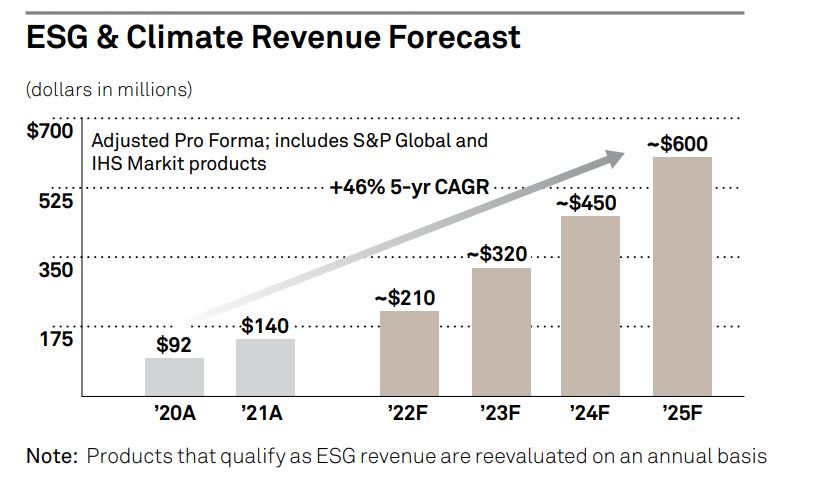
Financials and Valuation
Financial estimate:
- Revenue: we estimate revenue to reach USD 3.3Bn (+9% CAGR) – primarily driven by BU Index and BU ESG
- Our revenue forecast is quite conservative as we only consider ~16% CAGR for ESG (as comparison SPGI targets ~30% CAGR from 2022 to 2025 for their ESG business)
- EBITDA Margin: to remain stable at 57%
- We believe this is conservative as we are not considering any EBITDA margin improvement in ESG (however, ESG’s margin should increase as they gain more scale)
Author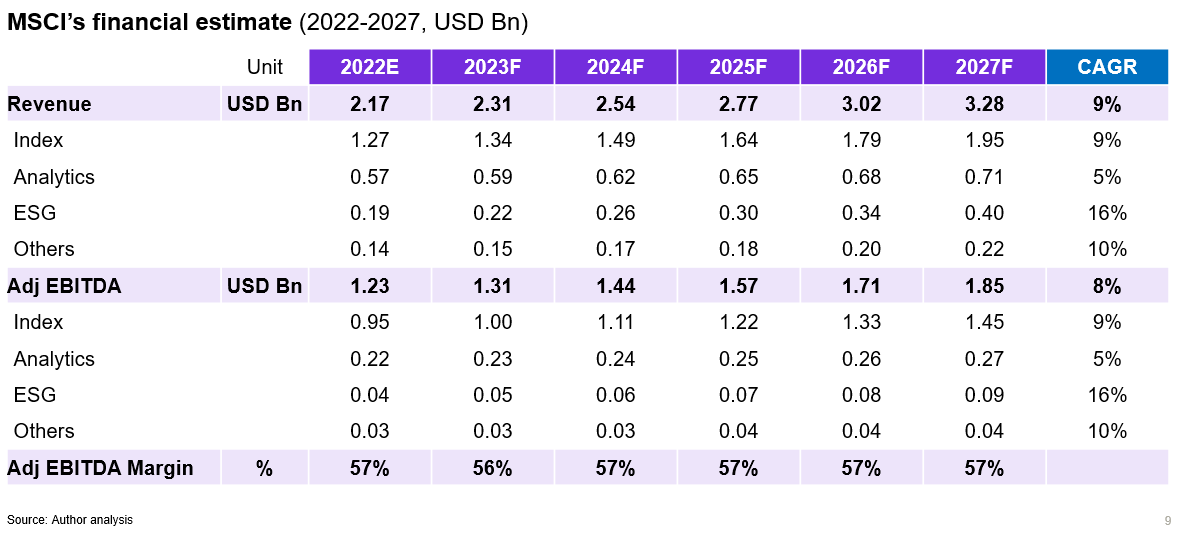
Valuation
Based on 5yr DCF (end of 2022 – WACC of 7.5%, EV/EBITDA exit of 30x), we estimate MSCI’s fair value to be USD 504/share (~26% upside).
A P/E based valuation multiple also offers interesting long-term upside.
Author, TIKR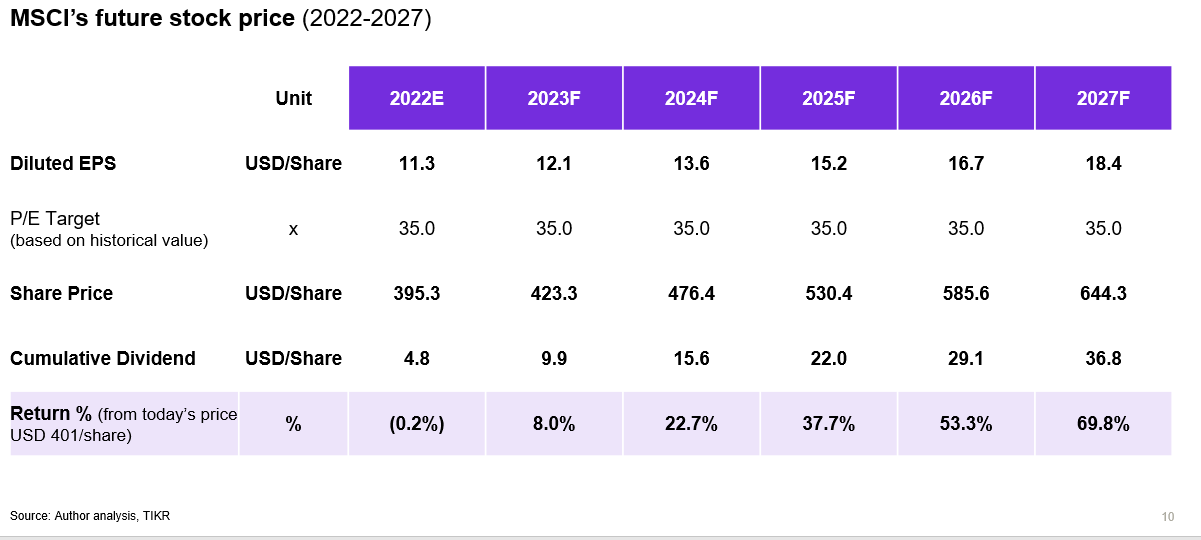
Conclusion
Recent broad-based market declines for adjacent capital market companies offer a good buying opportunity for MSCI. MSCI offers good upside considering its business resilience and future growth prospects in the future.
Be the first to comment