

littleclie/iStock via Getty Images
Introduction
I recently wrote an article covering my favorite dividend growth ETF, the iShares Core Dividend Growth ETF (DGRO). In that article, I used the following chart, which shows the historical performance of various S&P 500 stocks by dividend policy since 1973. By far, the best performers were dividend growers and initiators that turned $100 invested in 1973 into $14,405 by 2021. That’s roughly 11% per year.
Hartford Funds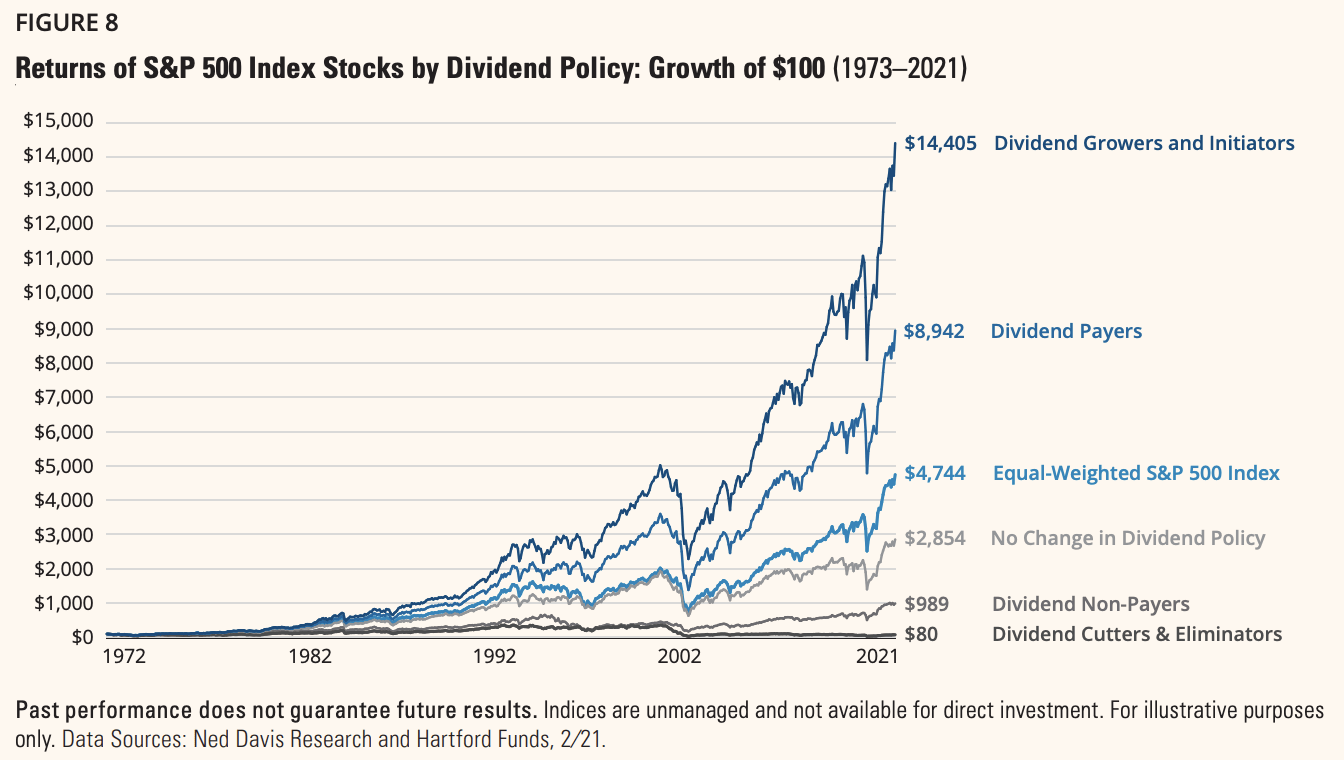
After many discussions with people following this article, I decided to dig up a company that I researched but never covered in an article: MSCI Inc. (NYSE:MSCI). This financial giant is one of America’s fastest-growing dividend stocks that just dropped 25% from its all-time high, which is now a reason for me to cover the stock on Seeking Alpha. This asset-light financial service provider offers everything investors need to achieve long-term outperformance. The only problem is that its yield is just 0.8%, which despite sky-high dividend growth cannot deliver the income needed for retired investors. Other than that, it’s what I consider a perfect dividend growth stock.
Allow me to elaborate.
What’s MSCI?
As I have never discussed MSCI on Seeking Alpha, or anywhere else, let’s start at the very beginning. MSCI is a $40.5 billion market cap company operating in the financial sector and the financial data & stock exchanges industry. Founded in 1998 in New York, the company has become one of the world’s leading providers of investment decision support tools for asset managers and other market participants.
In 2021, the company generated roughly 61% of its sales in its index segment. You may be familiar with indexes like the MSCI World Index, which is part of this segment. Basically, the company’s clients use its indexes in many areas of the investment process, including for indexed product creations (i.e., ETFs, mutual funds, annuities futures, options, structured products, etc.), performance benchmarking, portfolio construction and rebalancing, and asset allocation.
The company’s index products include global equity indexes, ESG (environment, social, government) and climate indexes, factor indexes, thematic indexes, as well as fixed income and custom indexes. According to the company, MSCI indexes have as much as $16.3 trillion in assets under management as of June 30, 2021.
MarketScreener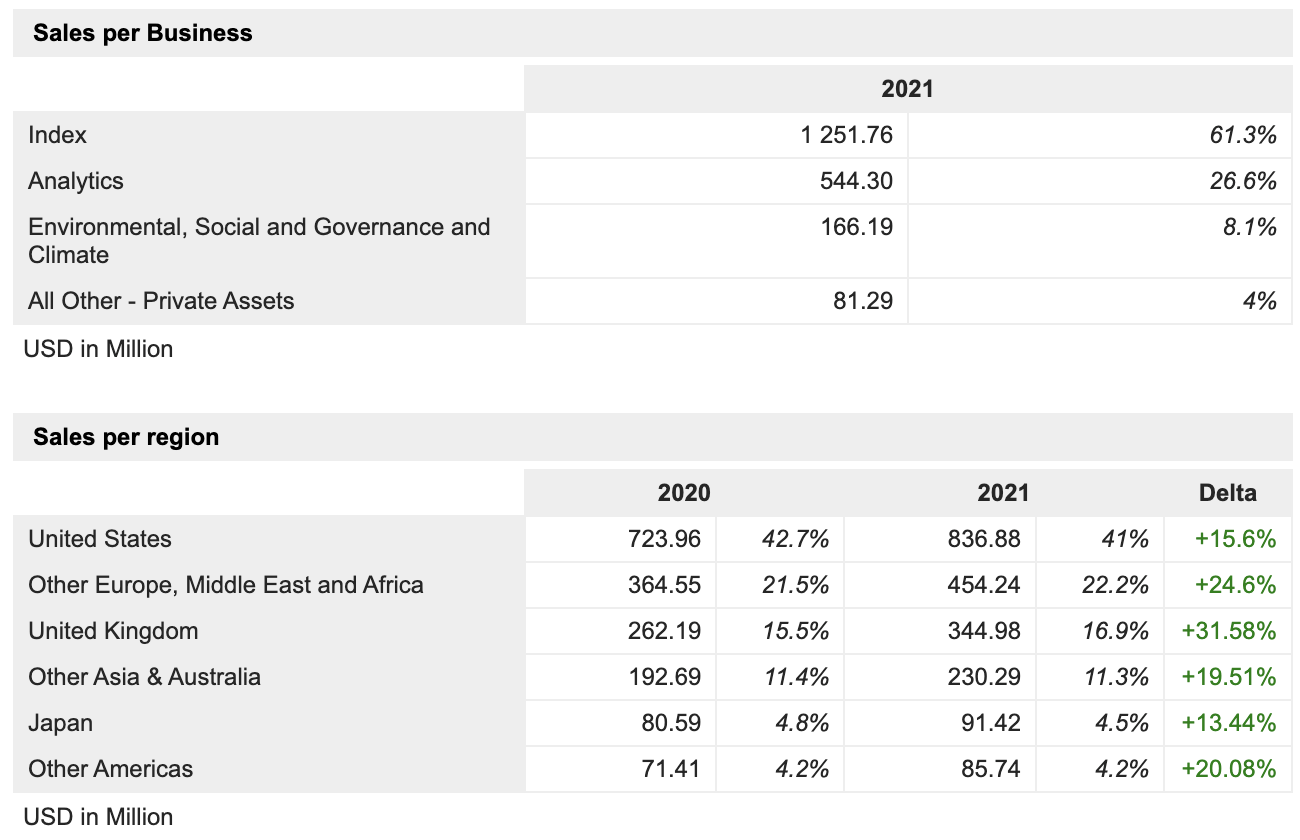
The second-largest segment, analytics, accounted for 27% of 2021 sales. This segment offers risk management, performance attribution, and portfolio management content, applications, and services that provide clients with an integrated view of risk and return and tools for analyzing the market, credit, liquidity, counterparty, and climate risk over various time horizons.
I’m a big fan of these analytics. Various companies in the industry specialize in offering services based on their own data, which makes sense as data is becoming a valuable “commodity”. In this case, it’s part of risk management and related.
The company also generated 8% in its ESG and climate segment. According to MSCI:
The ESG and Climate segment offers products and services that help institutional investors understand how ESG and climate considerations can impact the long-term risk and return of their portfolio and individual security-level investments. We provide data, ratings, research and tools to help investors navigate increasing regulation, meet new client demands and better integrate ESG and climate elements into their investment processes.
Our ESG and Climate research team analyzes over 9,800 entities worldwide, and we will continue to expand and deepen our coverage to help investors and others in their asset allocation, portfolio construction and risk management processes. Clients include global asset managers, leading asset owners, consultants, advisers, corporates and academics.
I actually played around with the company’s ESG services a bit. The screenshot below shows a part of the ESG rating for Union Pacific (UNP), one of my largest holdings. It shows investors and all interested parties where any company stands with regard to climate, ESG, and stuff like emissions. I’m very critical of the modern ESG approach, but it is what it is, a great model to leverage.
MSCI Inc.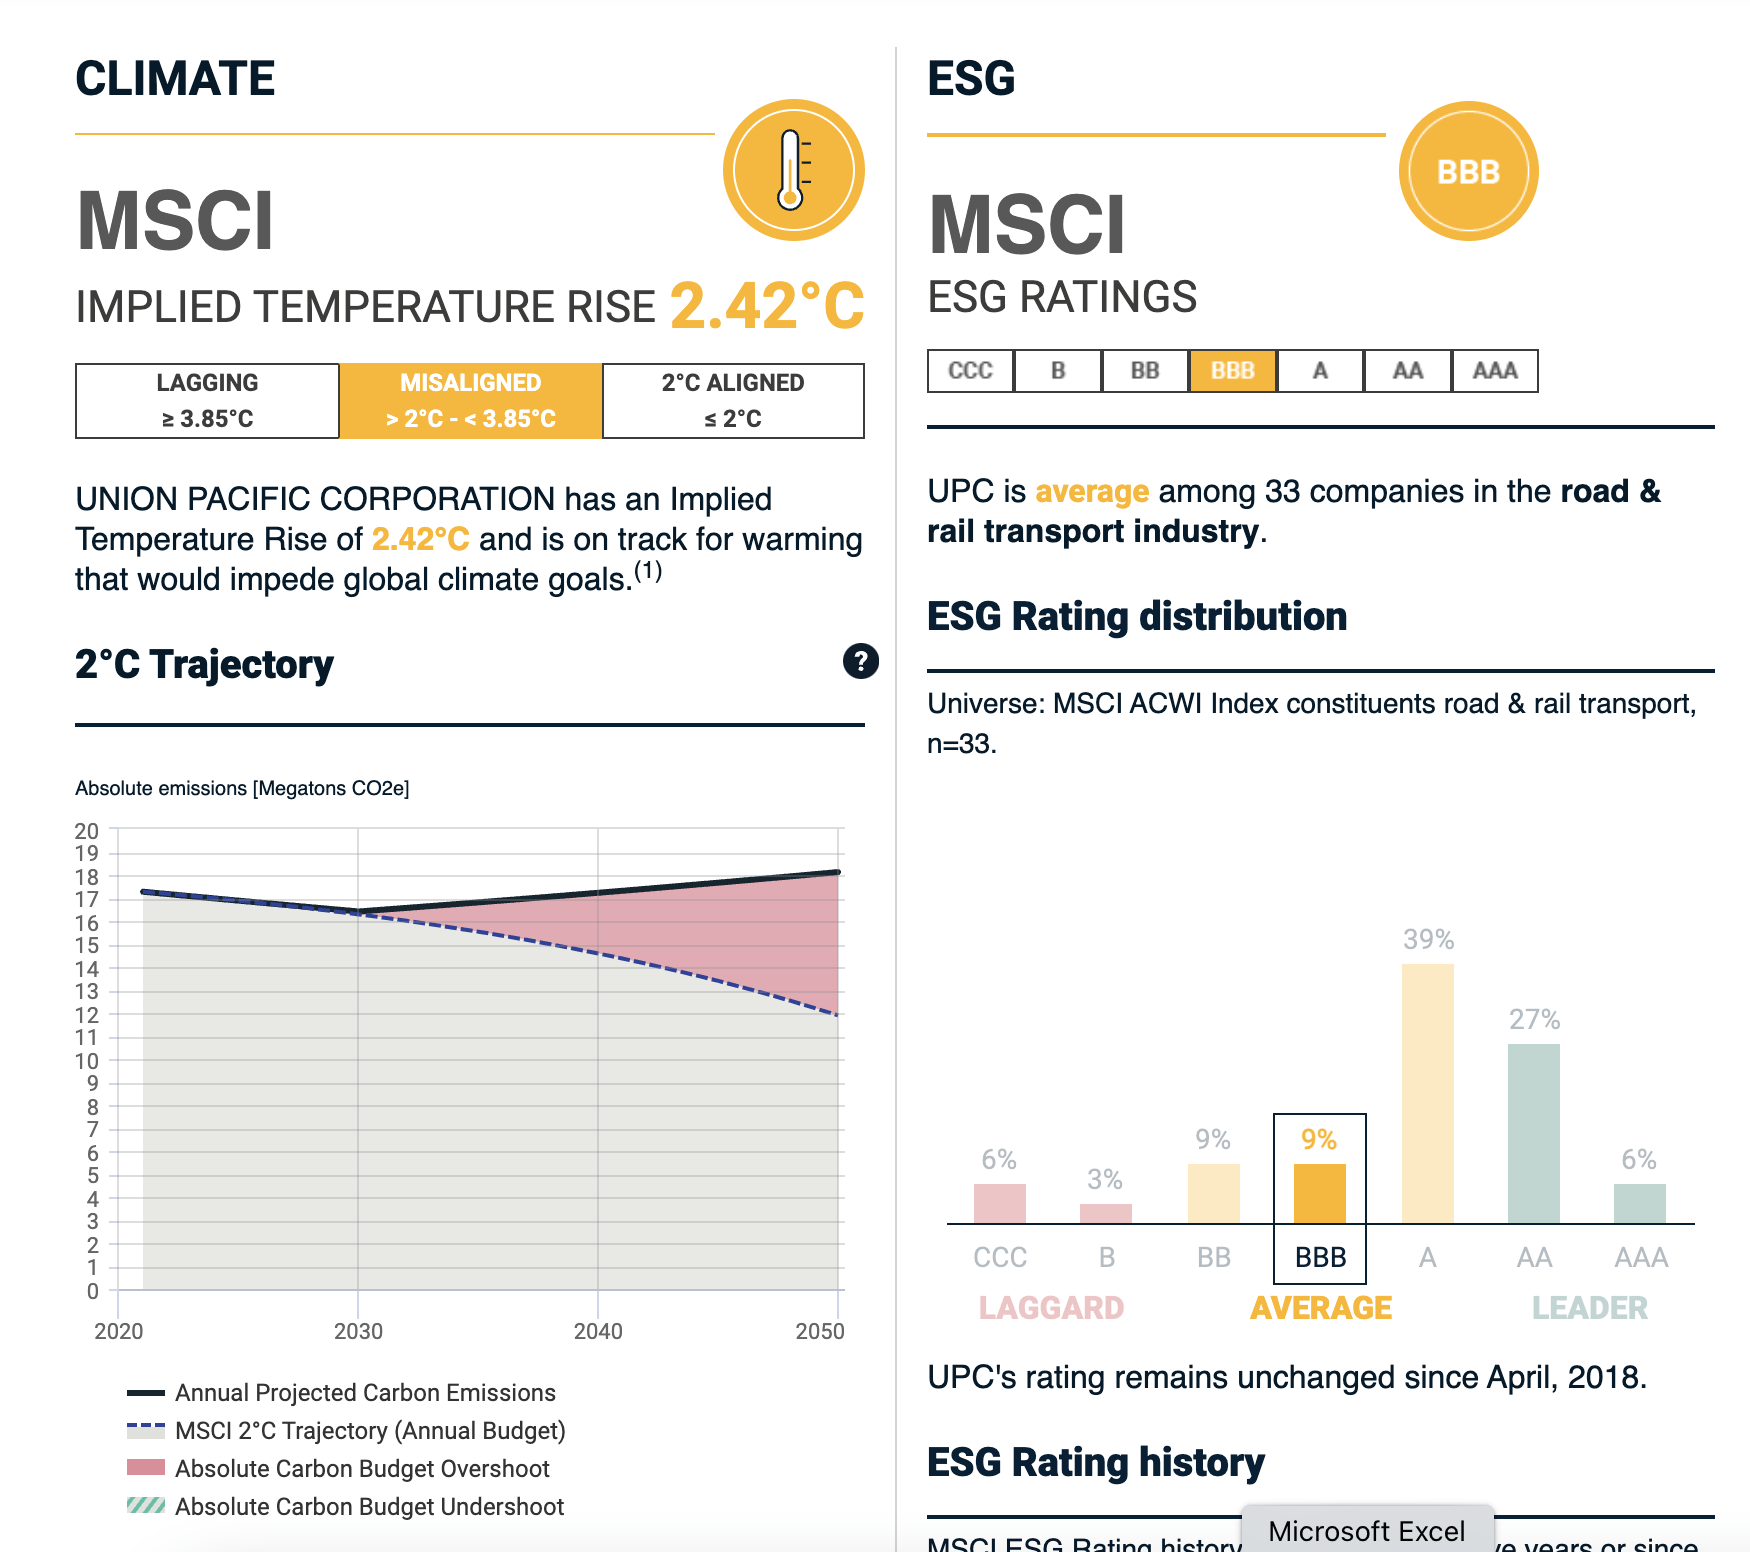
As the graph below shows, the company’s ESG segment has 30% annual compounded sales growth between 2010 and 2021. Most of it occurred recently as ESG has become increasingly important. In 2018, the company did $106 million in sales in this segment. In 2021, it was $354 million.
MSCI Inc.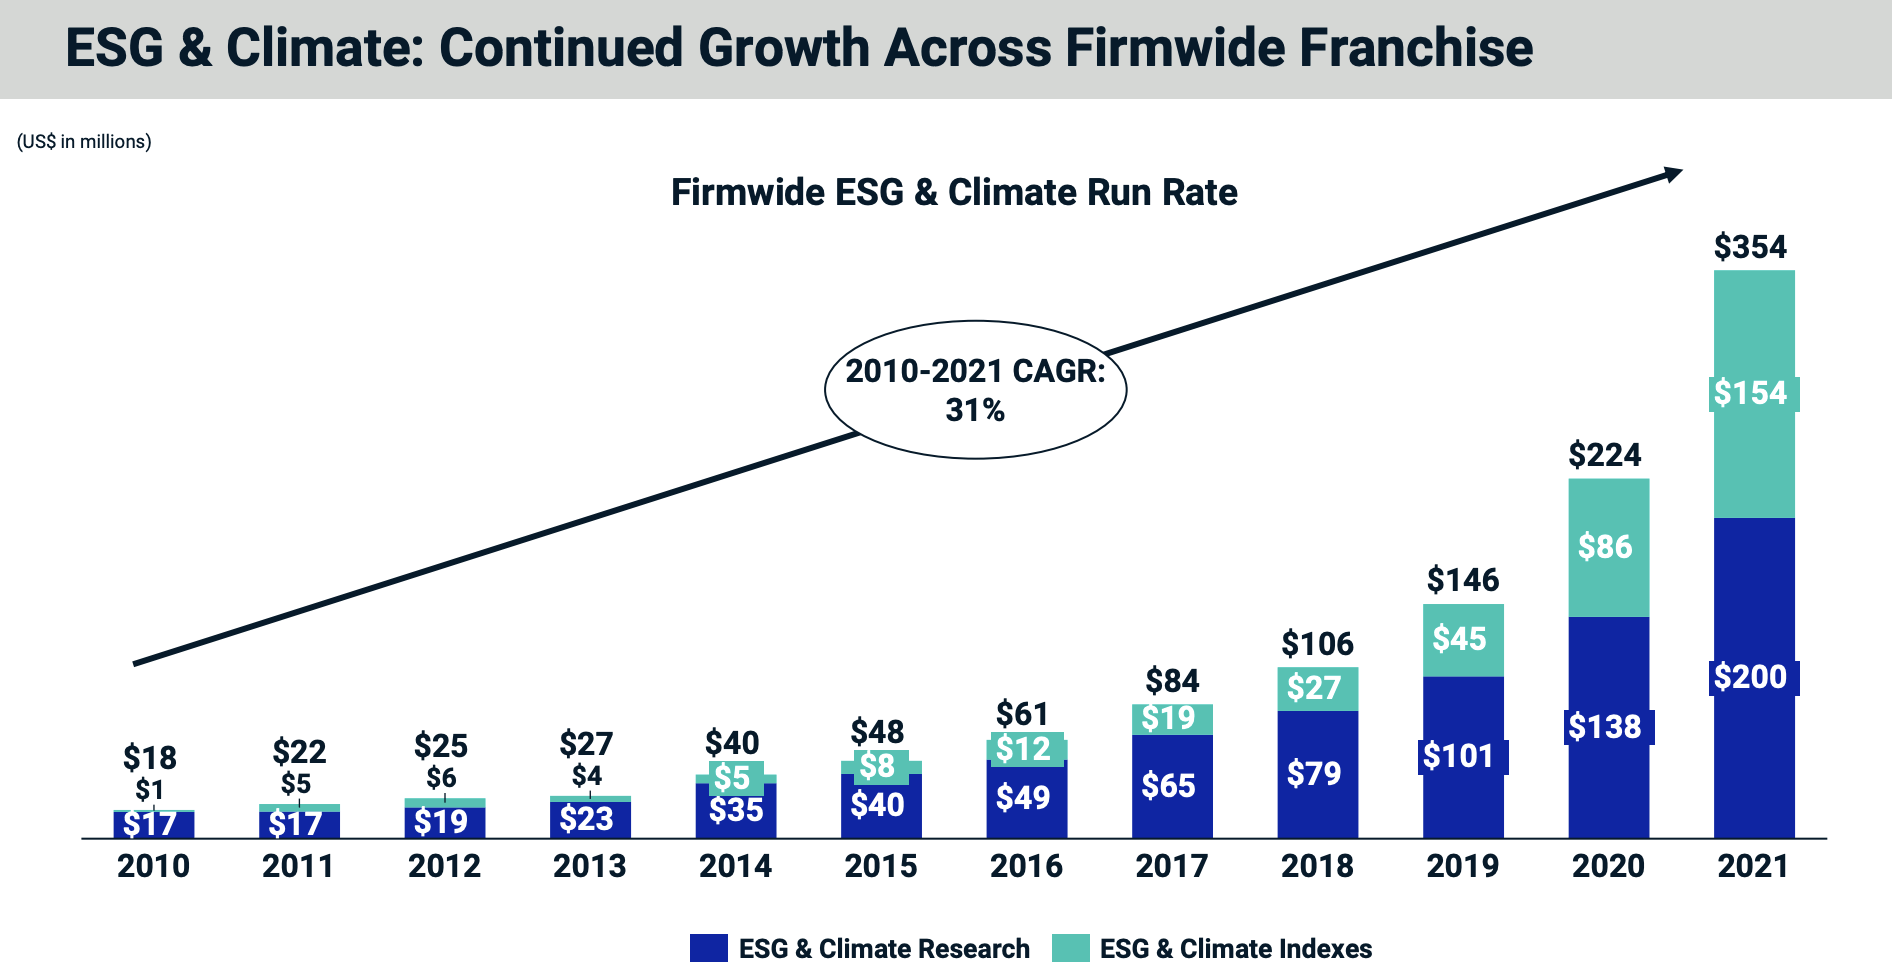
With that said, let’s look at why dividend growth is so stunning.
A Phenomenal Dividend Scorecard
I always like to look at the dividend scorecards provided by Seeking Alpha where stocks are compared to their sector peers. In the case of MSCI, we’re comparing the stock with financials. In general, financials mainly consists of (regional) banks, which tend to have slow dividend growth but high yields.
Hence, MSCI, which yields 0.8%, is rated a big fat F in the dividend yield category. This is based on $1.04 in dividends per quarter. On an annual basis, this gets you $4.16 per share. Unfortunately, a share currently costs $506, which explains the low yield.
Seeking Alpha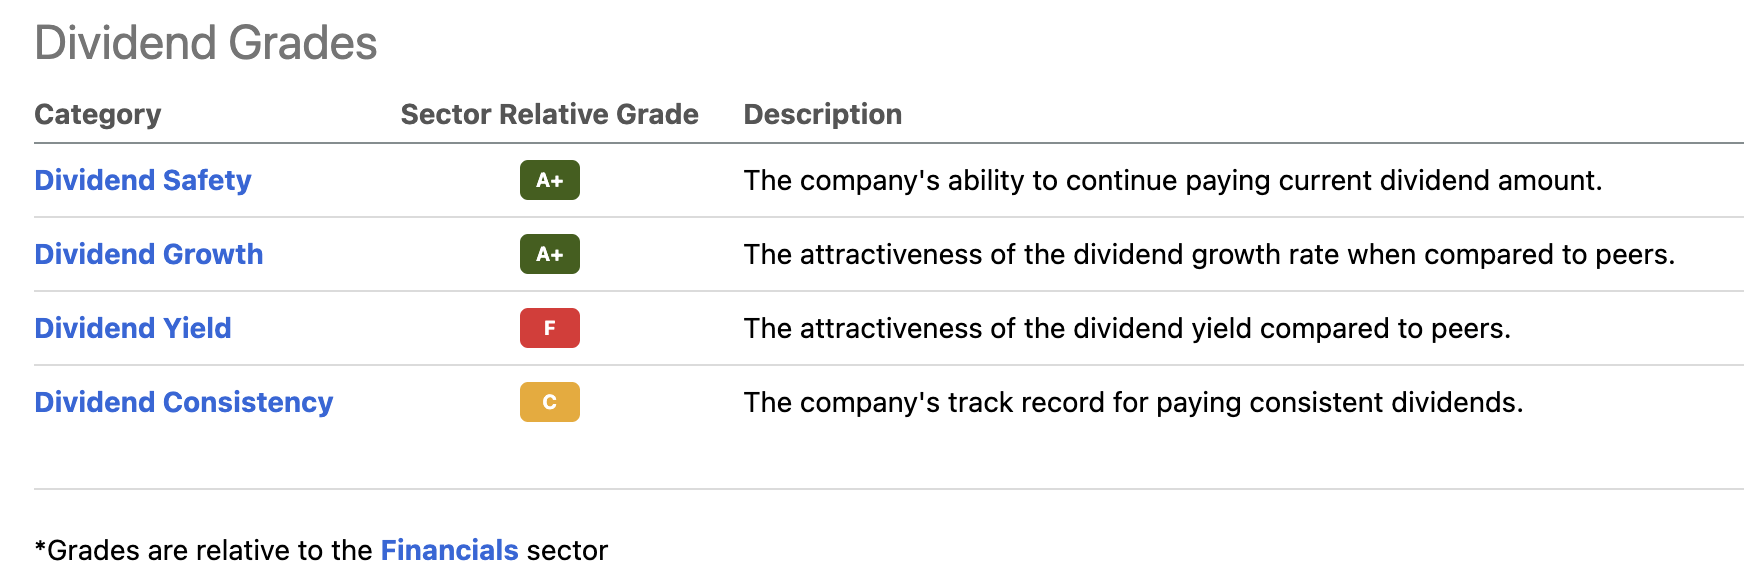
The good news is that the company scores very high on dividend growth and dividend safety: both A+.
The chart that shows the company’s ESG-related sales growth is just a part of this. The company is growing across all segments.
Between 2016 and 2021, total revenue grew by 12% per year – compounded. Because the company increasingly benefited from segments that are easy to leverage like analytics, adjusted EBITDA margins improved from 49.6% in 2016 to 58.6% in 2021 – allowing adjusted EBITDA to compound at 16% per year. Moreover, free cash flow, which is basically net income adjusted for non-operating cash items and capital expenditures improved by 17% per year. Free cash flow is basically cash a company can spend on dividends, buybacks, and debt reduction.
MSCI Inc.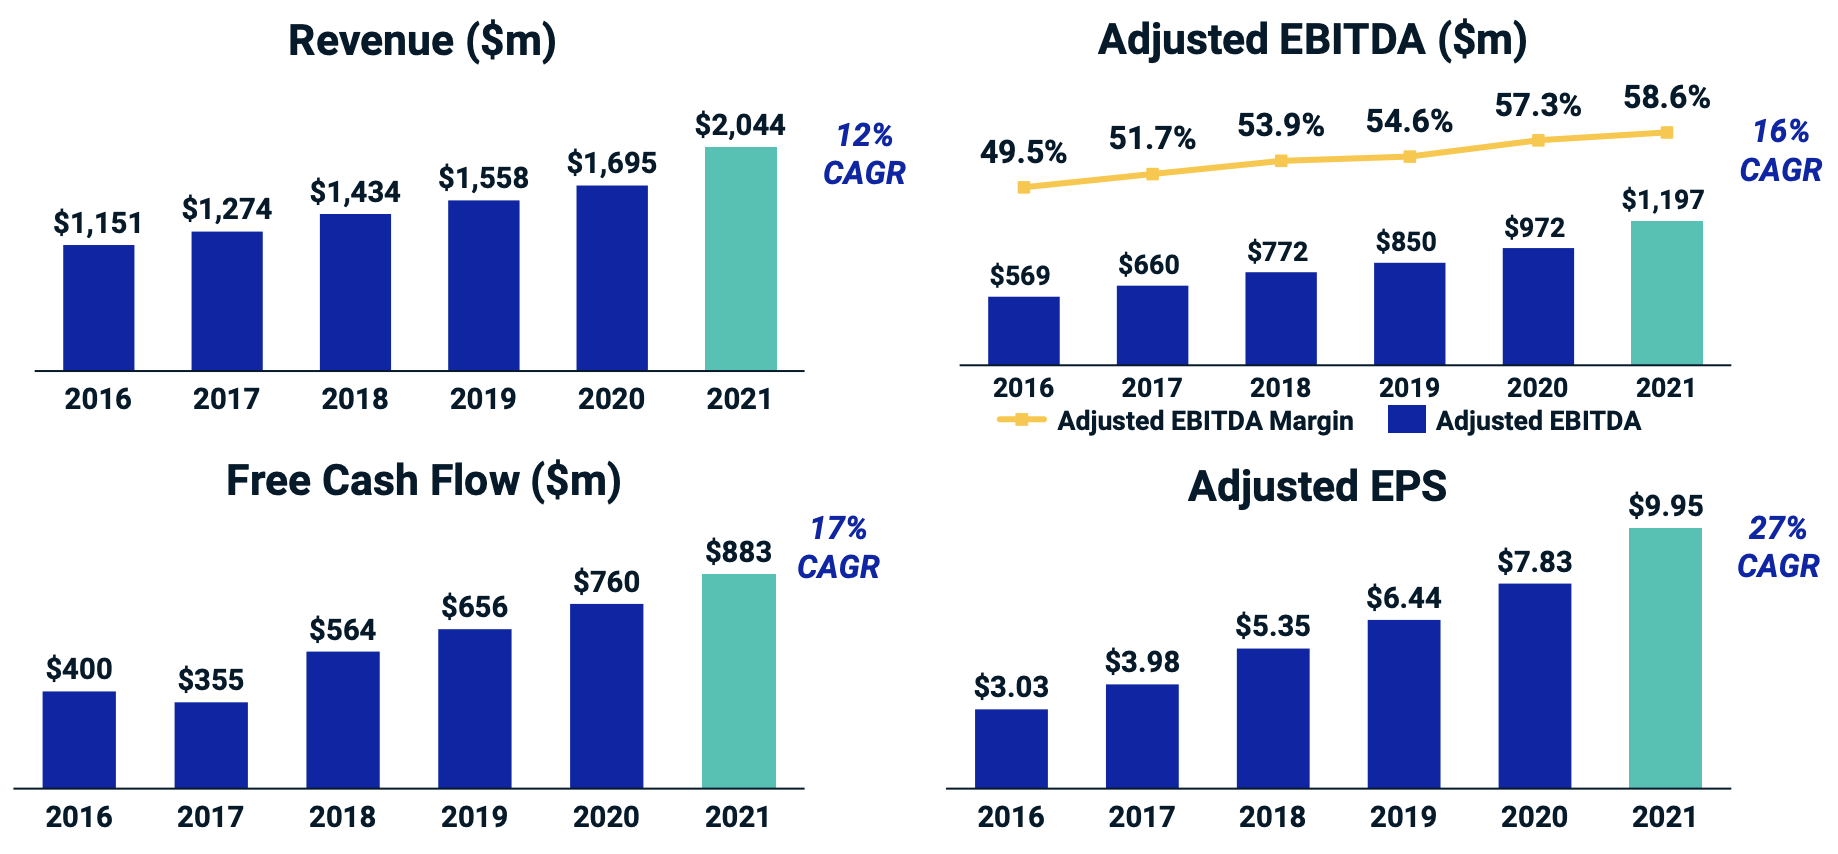
Speaking of buybacks and dividends, the first time the company paid a dividend was in 2014. Prior to that, shareholder payout was mainly based on share repurchases. Because of high buybacks, the number of shares outstanding has declined from 90.3 million in 2017 to 82.5 million in 2021. That’s an average annual decline of 1.8%. As a result, earnings PER SHARE growth is higher than EBITDA growth. In this case, EPS growth was 27% per year between 2016 and 2021.
TIKR.com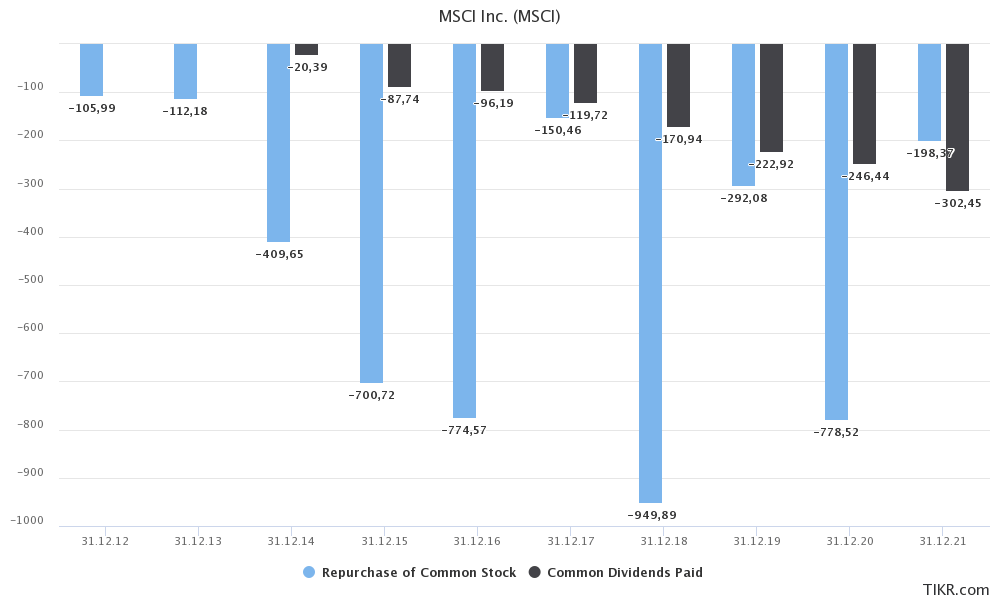
It also helps that the company’s free cash flow yield is high. Last year, the company did $883 million in free cash flow. Next year, analysts expect close to $1.2 billion in free cash flow. Using the company’s $40.5 billion market cap, we get an implied 2023 free cash flow yield of 3.0%. This means that if the company were to spend all of its free cash flow on dividends, this is the yield investors would get.
TIKR.com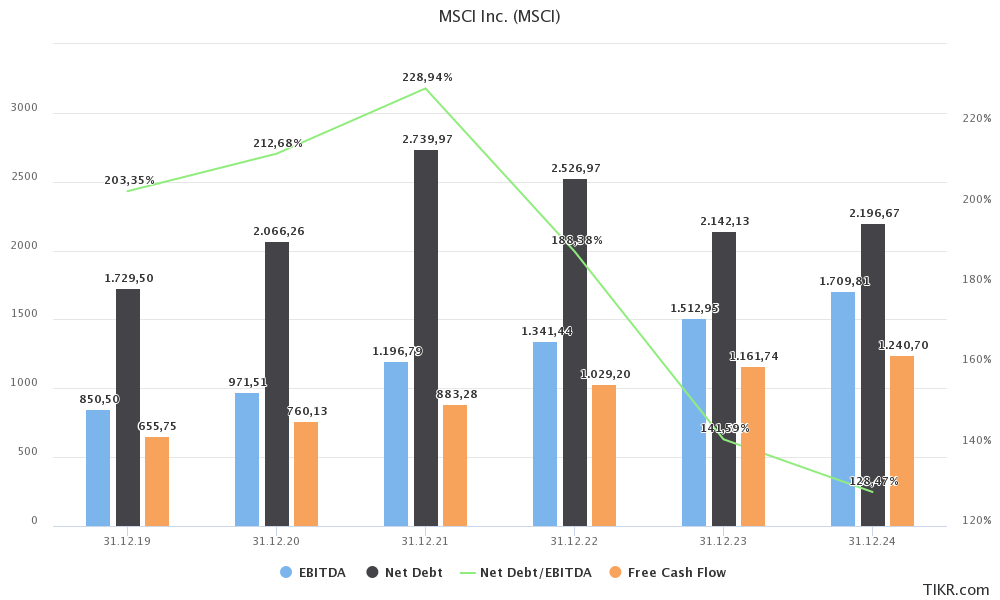
That’s obviously not happening, but the fact that free cash flow is “high” and growing at a rapid pace is the perfect foundation for high dividend growth. Hence, in 2014, the company decided to start paying a dividend. Back then, the average annual payout was $0.18 per share. In 2021 it was $3.64.
TIKR.com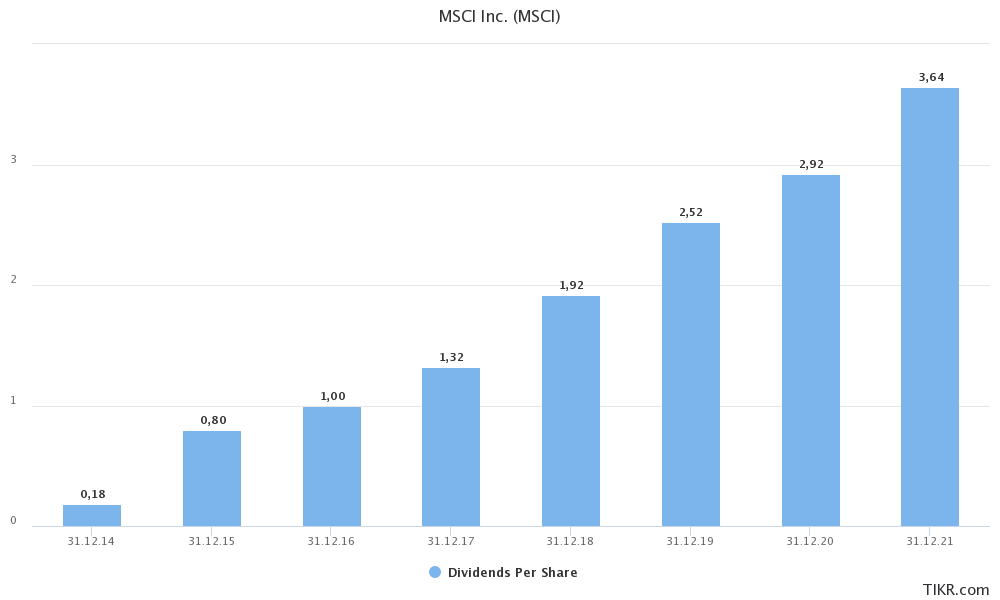
Hence, since 2014, dividends have grown by 54% per year compounded. Since 2017, this number is lower, but still high at 29%. On July 27, 2021, the company hiked its dividend by 33%, which indicates that there is no downtrend in dividend growth. And that makes sense given the numbers we just discussed.
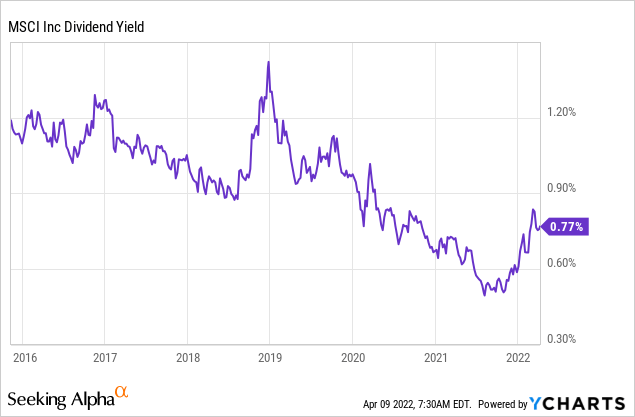
The beauty of high dividend growth is that investors won’t let a yield get high if there’s strong growth in a company. Right now, high-yielding companies are utilities, energy companies, REITs, telecoms, and similar. There’s not a lot of growth in these stocks, which means investors don’t price in high growth resulting in an (often) narrow gap between the free cash flow yield and the dividend yield.
MSCI has yielded close to 1.1% prior to the pandemic. After the pandemic, the stock price outperformed dividend growth. If we assume that the yield remains close to 1-1.1%, we can assume that dividend growth will be similar to expected capital gains.
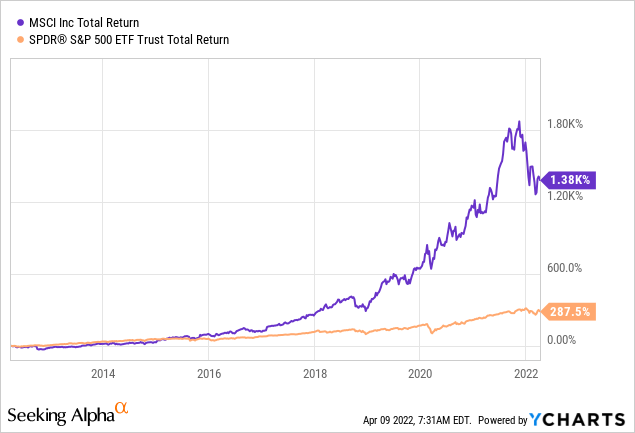
Over the past 10 years, the MSCI total return is 1.4 thousand percent. The S&P 500 returned 288%, which isn’t bad either. I believe that on a long-term basis, the stock can continue to return 15-20% per year.
With that said, let’s look into the valuation.
Valuation
The MSCI stock price is so wild that it took me a bit longer than I thought until I found the 2020 pandemic sell-off. Since early 2020, MSCI more than doubled prior to the current sell-off. Investors flooded the market, ESG demand rose rapidly and investors wanted quality dividend growth stocks.
FINVIZ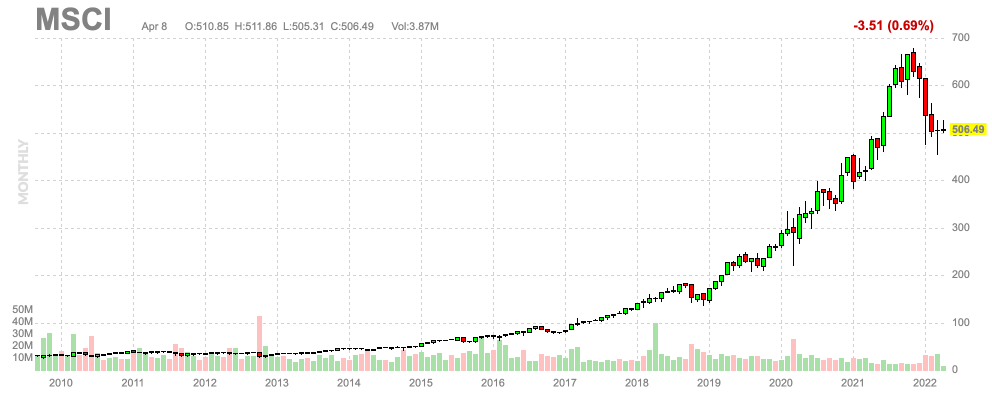
Right now, investors are de-risking their portfolios as rates are rising, punishing growth stocks. It’s hard to tell what exactly will happen, but the ongoing rise in yields is expected to hurt economic growth causing investors to unwind trades in the higher-growth stocks.
Hence, MSCI is now selling off along with the tech-heavy ETF (QQQ), which is a good benchmark for higher-growth stocks.
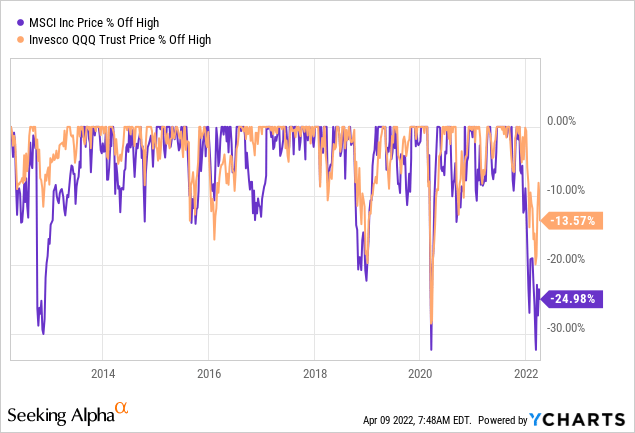
The current 25% drawdown is one of the biggest in the past 10 years, resulting in a $40.5 billion market cap. In this case, we get an enterprise value of $42.6 billion using $2.1 billion in expected net debt – as shown in the TIKR chart in this article.
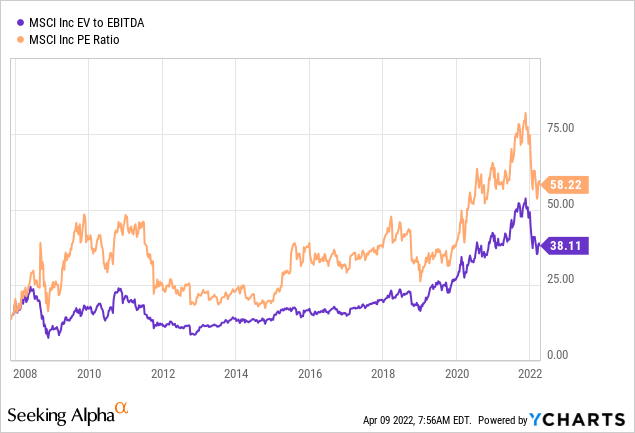
This is 28.4x 2023 expected EBITDA of $1.5 billion. 2023 normalized EPS is expected to be $13.18, which implies a PE ratio of 38.
Historically speaking, MSCI has never been “cheap”. And that makes sense. Growth rates are simply too high to give this stock an i.e., 12x EBITDA valuation.
The problem is that I don’t know how far this stock can fall. If rates continue to rise, we could see up to 10% more downside if it continues to hurt economic growth.
Takeaway
I’m a big fan of dividend growth stocks. While higher-yielding stocks are fun too, dividend growth stocks have, historically speaking, been a great source of wealth.
MSCI is one of these stocks. The company has a 0.8% dividend yield, which is nothing to write home about, but sky-high dividend growth. Long-term growth is backed by a stellar business model with strong growth in analytics and ESG-related services.
Margins have been in a long-term uptrend with free cash flow coming close to a 3.0% implied free cash flow yield. As a result, dividend growth is close to 25%, which is high but sustainable.
The valuation still seems lofty, but I believe that we’re close to an entry point as rising rates and higher risk aversion have caused this stock to fall close to 25%.
For now, I’m going with a neutral rating on the stock to account for high uncertainty in the stock market and falling economic expectations.
While the stock may not be the best investment for income-seeking retired investors, I think it’s a great stock for investors with a long investment horizon.
(Dis)agree? Let me know in the comments!
Be the first to comment