

Viktorcvetkovic/E+ via Getty Images
Asset Configuration and Quality
Residential Mortgage REITs (mREITs) have seen major asset value downshifts this year. With stress on mortgage values, we are prompted to review the relationship between an asset’s configuration and quality.
The U.S. single family housing market is among the most reliable assets anywhere. From Q1 1963 to Q3 2022 housing prices increased from $17,800 to $454,900, or a 5.63% annual compound growth rate (CAGR) as compared to the Dow Jones Industrial Index 6.37% CAGR over the same time period. That’s quite extraordinary when one considers that houses appreciate without having to take operating risks beyond maintenance.
We submit that U.S. single family residences are, before financing, superior assets. How those assets are configured, though, deeply impacts their safety and performance.
Contrast 2007 with today to see how the story plays out. In 2007, as housing prices cooled, most mortgages were floating rate with fixed rate teaser periods that assumed homeowners could refinance every few years to keep mortgage rates low. Once that bubble burst, mortgage costs soared. Making matters far worse, underwriting standards and equity beneath those sub-prime mortgages were among the worst in our history. Of course, the mortgage market melted down and many mortgage holders lost money.
Today, the vast majority of mortgages are fixed rate, have coupons at 3% or less and there is a record amount of equity under these mortgages due to far tighter underwriting standards after the Great Financial Crisis (GFC).
We believe the asset quality in the average mortgage REIT is among the safest asset classes today. As in past recessions where mortgages were largely fixed with high equity cushions, we forecast the mREIT preferred stocks are relatively safe when compared to lower yielding junk bonds today. Current junk yields are averaging 8.77% YTM according to the S&P index whereas the average mREIT FtF we buy often has a current yield higher than that with an upside to par for a rich yield to call (YTC).
Important Note: YTC is not the same as YTM. An issuer need not call the preferred whereas the high yield bond can only extend maturity with bondholder approval.
Why are these preferreds yielding so much when asset quality is so high?
The mREIT Financing Stack
mREITs use debt to leverage returns, typically about 20% equity or 4x leverage on that equity. The debt, for leverage and practical purposes, includes the preferred stocks. There are lots of reasons for mREITs to view preferreds as hybrid debt, most particularly because pretax profits are equal to after tax profits in REIT-world. That means REITs can arbitrage rate differences, when available, to issue lower cost preferreds that give greater redemption flexibility versus unsecured subordinated term debt. A perfectly logical use of market rates to improve mREIT leverage efficiency.
While the market tends to value preferreds on the equity underneath, we argue this is an incomplete picture. If these preferreds are hybrid debt and used exactly that way, then measures like dividend coverage and asset quality become highly relevant to value.
Looking back at the GFC, we observe the companies who died had asset quality problems. From Lehman Bros to Bear Stearns to AIG, asset quality brought these institutions to their knees. While the quality assets were sold at market, the truly toxic stuff required high discounts and, in some cases, limited government guarantees.
In our experience, quality assets tend to be rescued when only the financing stack is the problem. As mREIT book values have sunk, most have been able to issue secondary equity to rebalance deteriorating leverage ratios (as book value declines, the equity value declines and greatly increases leverage risk). That says a lot about a quality asset’s ability to attract equity financing in choppy markets.
When we examine cash flow coverage for safety, we find most preferreds are covered 10 times on average with some as high as 50 times covered. We assess the default risk to be low given mREITs’ ability to issue secondary equity to keep leverage ratios healthy.
A Simplifying Assumption
We are looking at mREIT FtF Preferreds across issuers who do not have identical underlying asset portfolios. The portfolios range from 100% Agency mortgage risk to partial exposure to assets like commercial mortgages, consumer credit and jumbo home loans that do not qualify as Agency loans.
There are different risks among these, not just from asset quality, but also from hedging strategies and ancillary business streams like Mortgage Servicing Rights (MSRs) and loan origination. Others make use of securitizations and non-recourse debt to stabilize their portfolios, too.
We are going to assume single family home loans, from Agency to jumbos have similar overall risk. We will discriminate by assigning a credit tier to each portfolio from tier 1 representing the lowest risk portfolios (Agency risk) to tier 3 representing higher risk areas like commercial mortgages in hybrid mREITs. We surprisingly find the results cluster more around the conversion date than credit differences.
Investment Thesis
Those mREIT FtF preferreds with 16-27 months to conversion offer the clearest paths to superior returns.
The universe of securities we analyze range from the currently floating (NLY.PF and AGNCN) to those converting in 2027.
All of these currently trade under par value ($25 or call value). To get a sense for those discounts across the lowest risk tier, we compare both AGNC (AGNC) and Two Harbors (TWO) FtF preferreds Yield to Call (YTC), below:
| Security | Convert Date | Index | Margin | Current Yield | Current Price | YTC |
| AGNCL | 10/15/27 | 5 Yr. T | 4.390% | 9.07% | $21.37 | 11.63% |
| AGNCM | 4/15/24 | LIBOR* | 4.332 | 8.59 | 20.01 | 22.98 |
| AGNCN | 10/15/22 | LIBOR | 5.111 | 7.26 | 24.1 | 13.16 |
| AGNCO | 10/15/24 | LIBOR | 4.993 | 7.81 | 20.82 | 16.48 |
| AGNCP | 4/15/25 | LIBOR | 4.697 | 7.72 | 19.82 | 16.40 |
| TWO.PA | 4/27/27 | LIBOR | 5.660 | 10.47 | 19.40 | 15.07 |
| TWO.PB | 7/27/27 | LIBOR | 5.352 | 10.38 | 18.36 | 15.65 |
| TWO.PC | 1/27/25 | LIBOR | 5.011 | 10.10 | 17.95 | 23.80 |
* LIBOR is going away in June 2023 to be replaced by 3 Month Term SOFR plus 26.2bp as administered by the CME for most 3-month LIBOR floating issues. Currently, the spread has widened to 40.53 bp due to volatility in the UK economy, which would reduce the interest rate next June by 14.33bp until the spread narrows again.
Let’s reorganize our analysis and redefine a term. We expect to sell around the call date, so we will use the term Expected Yield to Sale (EYTS) instead of YTC to reflect our intention to realize the return. Please find below a current EYTS curve for each of our two issuers:
Expected Yield to Sale (SA, Koyfin and my calculations) Expected Yield to Sale (SA, Koyfin and my calculations)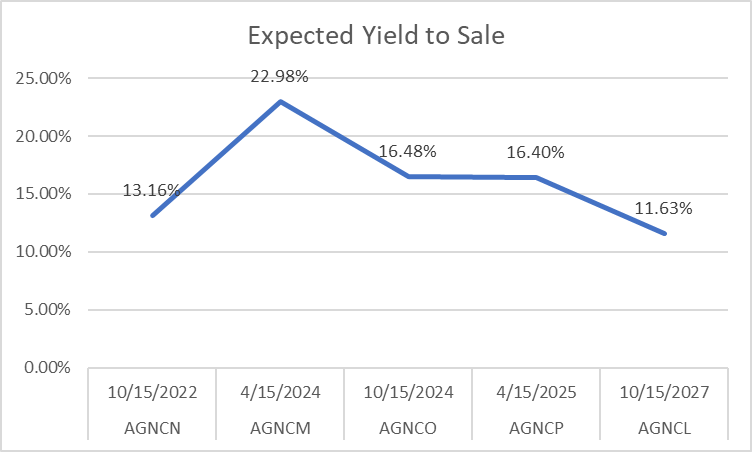
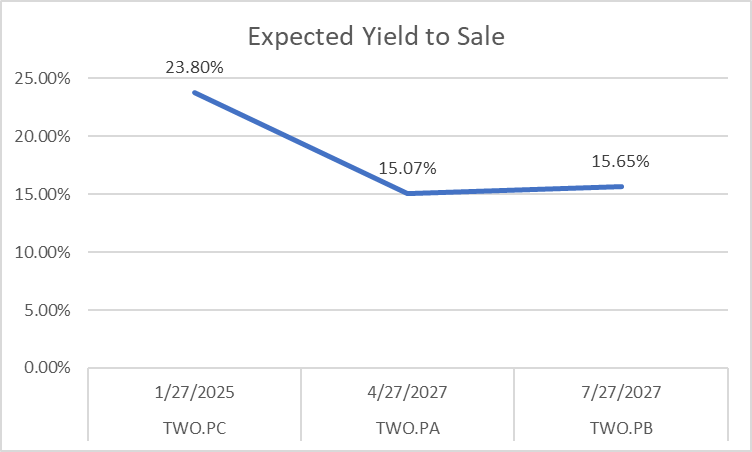
As you can see, the sweet spot for Expected Yield to Sale is 27 months or less to conversion for each of these Agency REITs.
And we see this repeated across all credit tiers in a scatter plot, below, that includes hybrid and origination mREITs from the following table:
| Company | Ticker | Call Date |
| Annaly Capital Mgmt Series F | NLY.PF | 9/30/2022 |
| AGNC Investment Series C | AGNCN | 10/15/2022 |
| Annaly Capital Mgmt Series G | NLY.PG | 3/31/2023 |
| PennyMac Series A | PMT.PA | 3/15/2024 |
| Arlington Asset Series C | AAIC.PC | 3/30/2024 |
| Chimera Investment Series B | CIM.PB | 3/30/2024 |
| Chimera Investment Series D | CIM.PD | 3/30/2024 |
| AGNC Investment Series D | AGNCM | 4/15/2024 |
| Cherry Hill Mort Invest Series B | CHMI.PB | 4/15/2024 |
| PennyMac Series B | PMT.PB | 6/15/2024 |
| Annaly Capital Mgmt Series I | NLY.PI | 6/30/2024 |
| Rithm Series A | RITM.PA | 8/15/2024 |
| Rithm Series B | RITM.PB | 8/15/2024 |
| AGNC Investment Series E | AGNCO | 10/15/2024 |
| Ellington Financial Series A | EFC.PA | 10/30/2024 |
| Invesco Mortgage Cap Series B | IVR.PB | 12/27/2024 |
| NY Mortgage Trust Series E | NYMTM | 1/15/2025 |
| Two Harbors Series C | TWO.PC | 1/27/2025 |
| MFA Financial Series C | MFA.PC | 3/31/2025 |
| AGNC Investment Series F | AGNCP | 4/15/2025 |
| Dynex Capital Series C | DX.PC | 4/15/2025 |
| Chimera Investment Series C | CIM.PC | 9/30/2025 |
| PennyMac Series C | PMT.PC | 8/24/2026 |
| NY Mortgage Trust Series F | NYMTL | 10/15/2026 |
| Rithm Series C | RITM.PC | 11/15/2026 |
| Two Harbors Series A | TWO.PA | 4/27/2027 |
| Two Harbors Series B | TWO.PB | 7/27/2027 |
| Invesco Mortgage Cap Series C | IVR.PC | 9/27/2027 |
| AGNC Investment Series G | AGNCL | 10/15/2027 |
| NY Mortgage Trust Series D | NYMTN | 10/15/2027 |
See how EYTS peaks by 2024:
Expected Yield to Sale (SA, Koyfin and my calculations)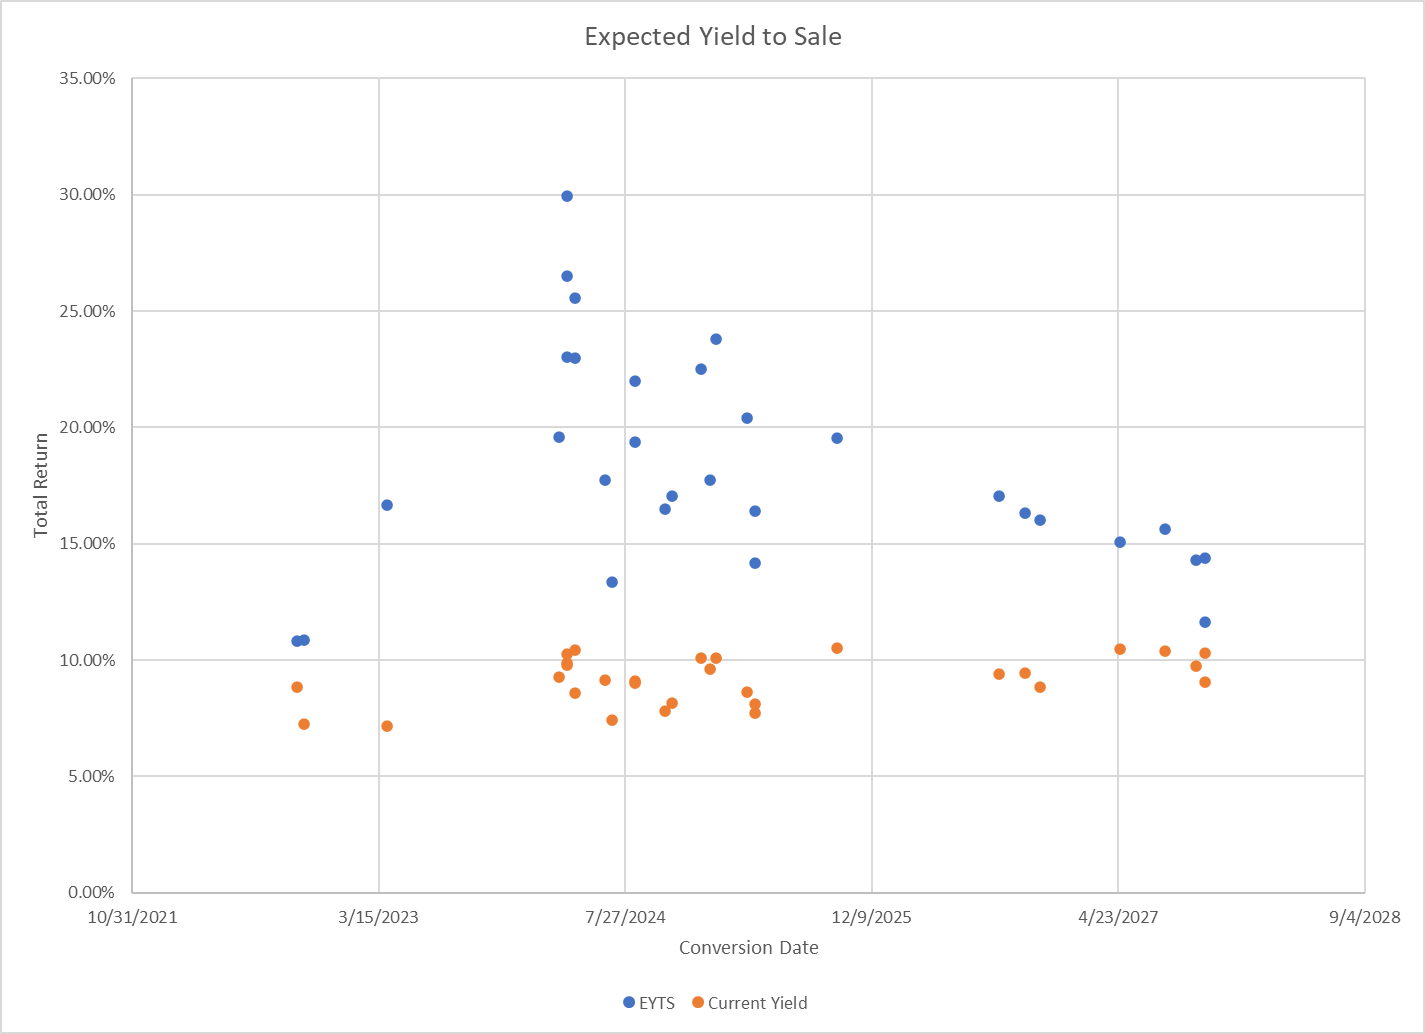
Obviously there are risk and coupon margin pricing differences among these issuers, the larger observation is just how consistent the spread is over time.
We present for your information a summary, by credit tier, then by call date for easier comparison:
| Company | Ticker | Price | Call Date | EYTS | Current Yield | Credit Tier |
| Annaly Capital Mgmt Series F | NLY.PF | 24.5 | 9/30/2022 | 10.80% | 8.84% | 1 |
| AGNC Investment Series C | AGNCN | 24.1 | 10/15/2022 | 10.85% | 7.26% | 1 |
| Annaly Capital Mgmt Series G | NLY.PG | 22.7 | 3/31/2023 | 16.68% | 7.16% | 1 |
| AGNC Investment Series D | AGNCM | 20.01 | 4/15/2024 | 22.98% | 8.59% | 1 |
| Cherry Hill Mort Invest Series B | CHMI.PB | 19.75 | 4/15/2024 | 25.54% | 10.44% | 1 |
| Annaly Capital Mgmt Series I | NLY.PI | 22.785 | 6/30/2024 | 13.37% | 7.41% | 1 |
| AGNC Investment Series E | AGNCO | 20.82 | 10/15/2024 | 16.48% | 7.80% | 1 |
| Invesco Mortgage Cap Series B | IVR.PB | 19.18 | 12/27/2024 | 22.53% | 10.10% | 1 |
| Two Harbors Series C | TWO.PC | 17.95 | 1/27/2025 | 23.80% | 10.10% | 1 |
| AGNC Investment Series F | AGNCP | 19.816 | 4/15/2025 | 16.40% | 7.73% | 1 |
| Dynex Capital Series C | DX.PC | 21.22 | 4/15/2025 | 14.19% | 8.13% | 1 |
|
Two Harbors Series A |
TWO.PA | 19.4 | 4/27/2027 | 15.07% | 10.47% | 1 |
| Two Harbors Series B | TWO.PB | 18.36 | 7/27/2027 | 15.65% | 10.38% | 1 |
| Invesco Mortgage Cap Series C | IVR.PC | 19.2 | 9/27/2027 | 14.32% | 9.77% | 1 |
| AGNC Investment Series G | AGNCL | 21.365 | 10/15/2027 | 11.63% | 9.07% | 1 |
| PennyMac Series A | PMT.PA | 21.89 | 3/15/2024 | 19.59% | 9.28% | 2 |
| PennyMac Series B | PMT.PB | 21.86 | 6/15/2024 | 17.72% | 9.15% | 2 |
| Rithm Series A | RITM.PA | 20.69 | 8/15/2024 | 19.37% | 9.09% | 2 |
| Rithm Series B | RITM.PB | 19.72 | 8/15/2024 | 21.98% | 9.03% | 2 |
| PennyMac Series C | PMT.PC | 17.97 | 8/24/2026 | 17.05% | 9.39% | 2 |
| Rithm Series C | RITM.PC | 17.97 | 11/15/2026 | 16.02% | 8.85% | 2 |
| Arlington Asset Series C | AAIC.PC | 21.0798 | 3/30/2024 | 23.04% | 9.78% | 3 |
| Chimera Investment Series B | CIM.PB | 20.21 | 3/30/2024 | 26.51% | 9.90% | 3 |
| Chimera Investment Series D | CIM.PD | 19.45 | 3/30/2024 | 29.94% | 10.28% | 3 |
| Ellington Financial Series A | EFC.PA | 20.71 | 10/30/2024 | 17.06% | 8.15% | 3 |
| NY Mortgage Trust Series E | NYMTM | 20.5 | 1/15/2025 | 17.75% | 9.60% | 3 |
| MFA Financial Series C | MFA.PC | 18.85 | 3/31/2025 | 20.41% | 8.62% | 3 |
| Chimera Investment Series C | CIM.PC | 18.42 | 9/30/2025 | 19.55% | 10.52% | 3 |
| NY Mortgage Trust Series F | NYMTL | 18.16 | 10/15/2026 | 16.32% | 9.46% | 3 |
| NY Mortgage Trust Series D | NYMTN | 19.39 | 10/15/2027 | 14.37% | 10.31% | 3 |
Source: SA, Koyfin and my calculations.
*AGNCN converted and has not yet confirmed the new dividend, which we estimate to be approx. 25% higher.
Here is the Tier 1 Graph:
Expected Yield to Sale (SA, Koyfin and my calculations)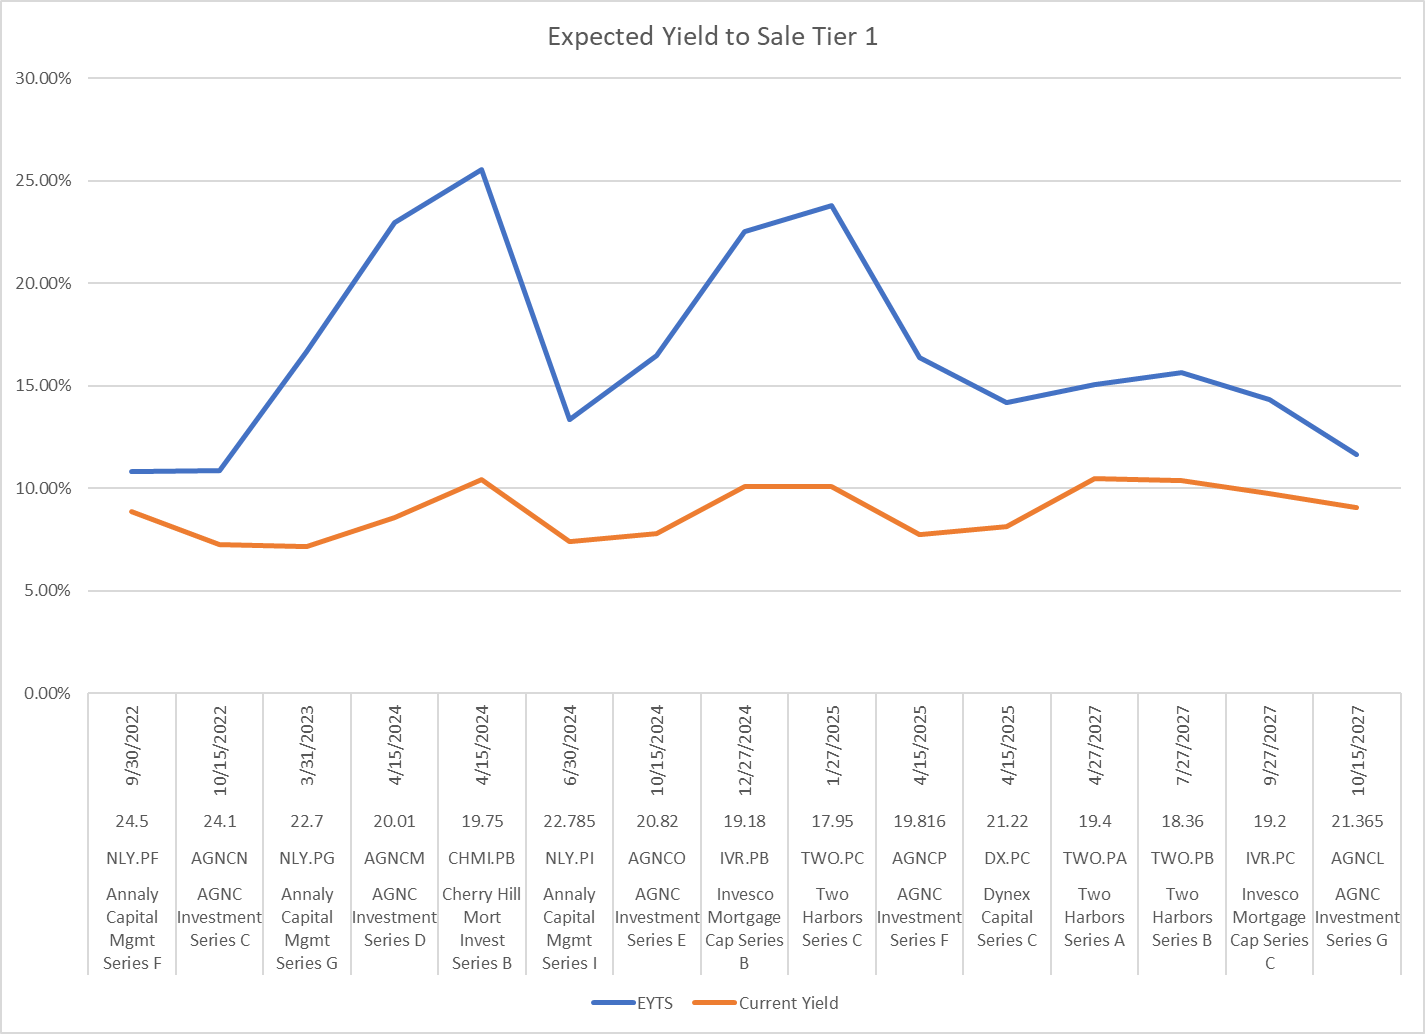
We have a single outlier here – the NLY.PI with an EYTS of 13.37% in 2024. The prices of these preferred frequently have anomalies attendant to less liquid preferreds, which may explain this pricing.
The Tier 2 graph:
Expected Yield to Sale (SA, Koyfin and my calculations)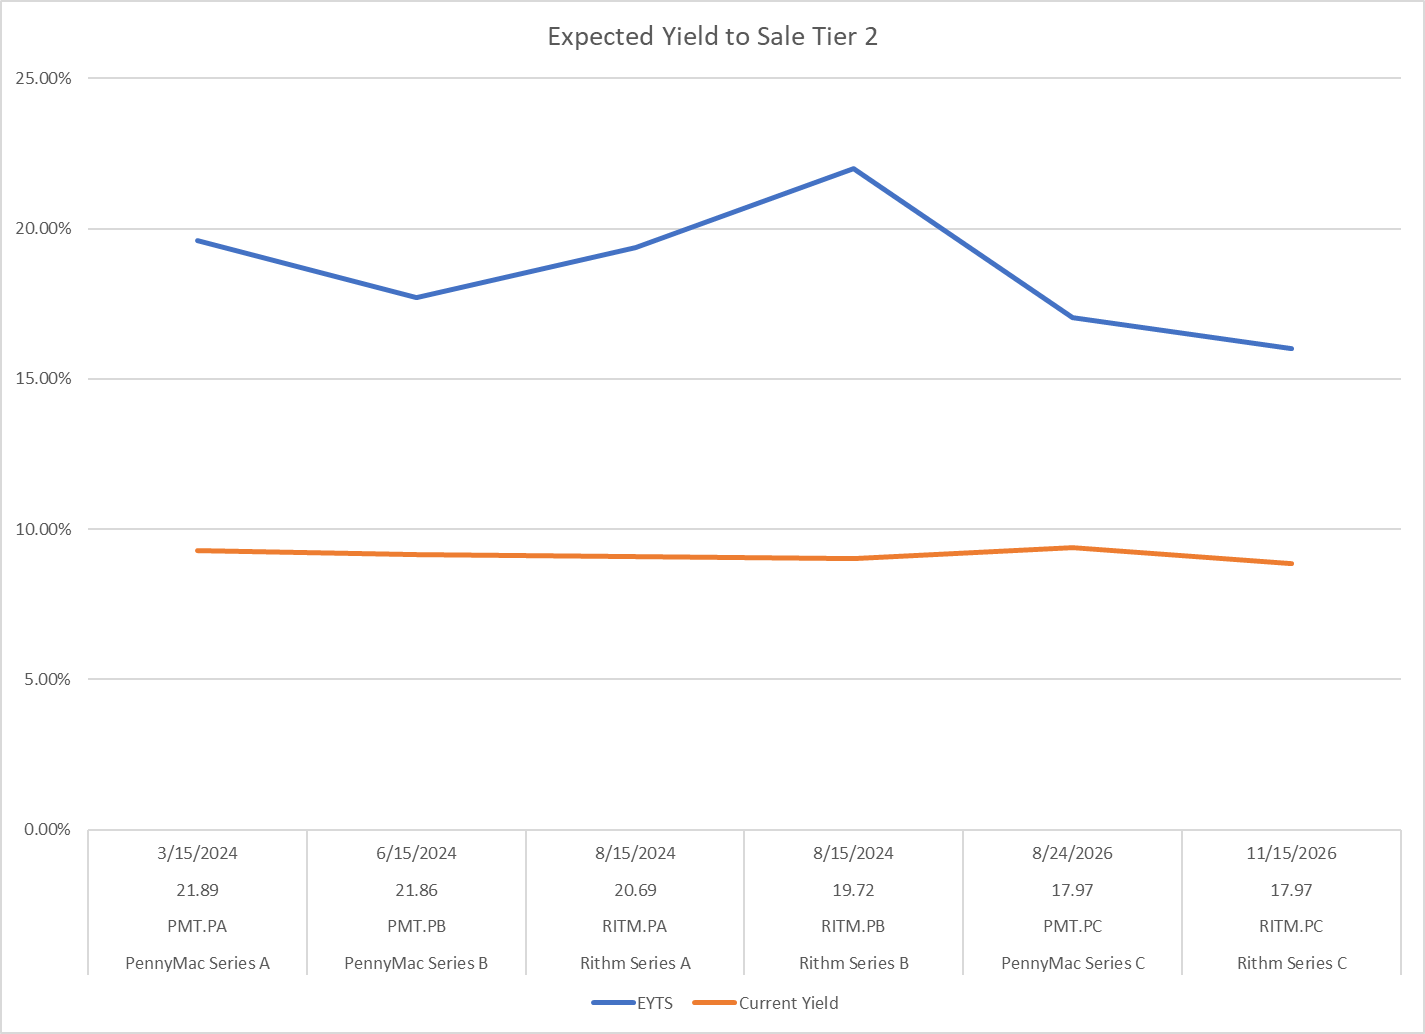
And, finally, the Tier 3 graph:
Expected Yield to Sale (SA, Koyfin and my calculations)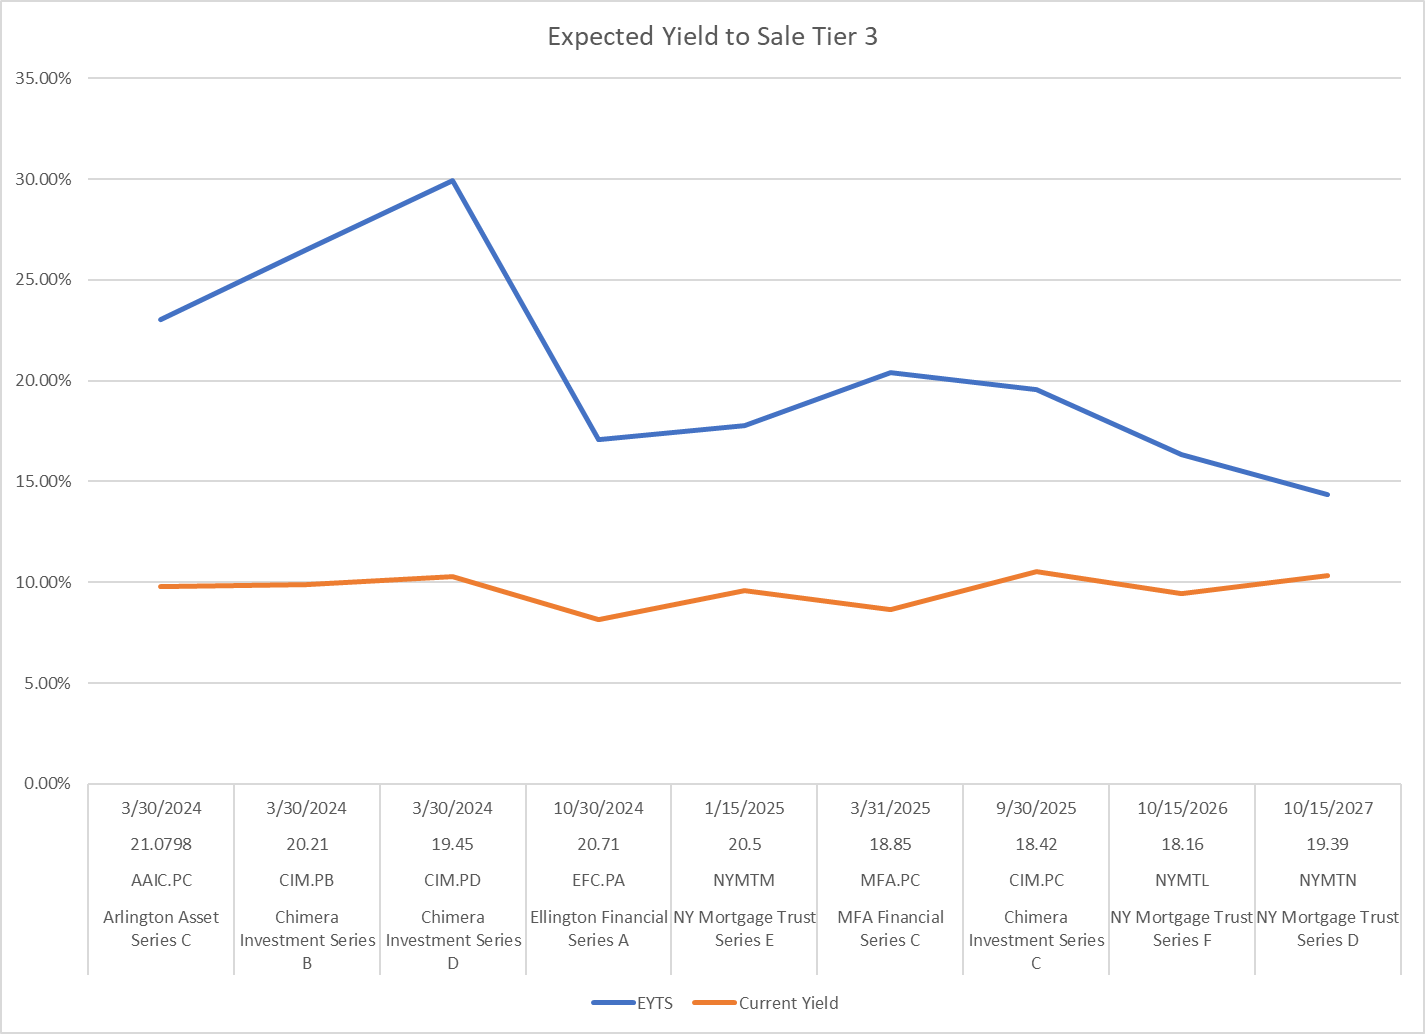
As you can see, there is not a lot of difference among the credit tiers which we attribute to the scarcity of coverage and analysis on these securities. Tier 3, though, has wider credit spreads, but not as wide as we would have expected, which limits our overall appetite.
While we see terrific value in Tier 1 and have our greatest portfolio concentration here, there is good value in the others, too.
Conclusions
The best values in the mREIT FtF Preferred sector are those issues that will convert in 16-27 months. Since there is not a lot of credit distinction among the asset portfolios, we have overweighted our exposure to Tier 1 with good representation across the sector.
Today, we see the best values in seven different issues:
RITM.PB, TWO.PC, IVR.PB, CIM.PB, CIM.PD, AGNCM and CHMI.PB all convert in 2024 (while Chimera has greater credit risk in its portfolio, we see the risk is appropriately compensated for in 2024 conversion discounts for this well-managed REIT).
Be the first to comment