

olegganko/iStock Editorial via Getty Images
Investment Thesis
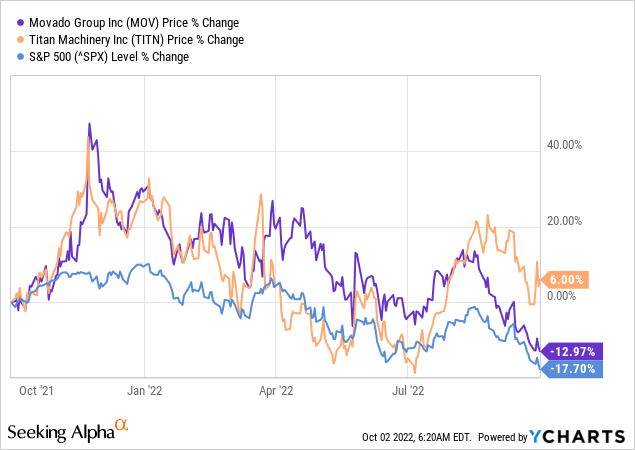
Movado Group, Inc. (NYSE:NYSE:MOV) stock more than doubled in value through 2021 but has lost a third of its value YTD. Still, it outperformed the S&P 500 by 600 bps in the previous 52 weeks because of a steep rise in Q4 2021 pertaining to the above-expectations Q3 2021 earnings report. This downtrend has resulted in Movado’s market cap dropping from $960 million in January to $656 million to date.
The company has a strong balance sheet, with a third of its market cap in cash. It has also been showing performance improvements, including stable revenue growth and margin expansion, resulting in a favorable value proposition for the security, and making me bullish on the stock.
The Company
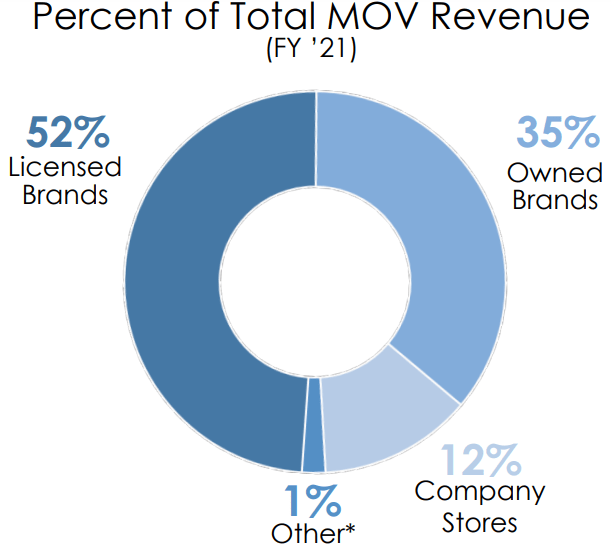
Movado Group is a global designer, manufacturer, and distributor of watches, operating through 2 segments: Watch and Accessory Brands and Company Stores. The former segment designs, manufactures, and distributes watches, jewelry, and other accessories of owned and licensed brands and generates revenue from after-sales service activities and shipping.
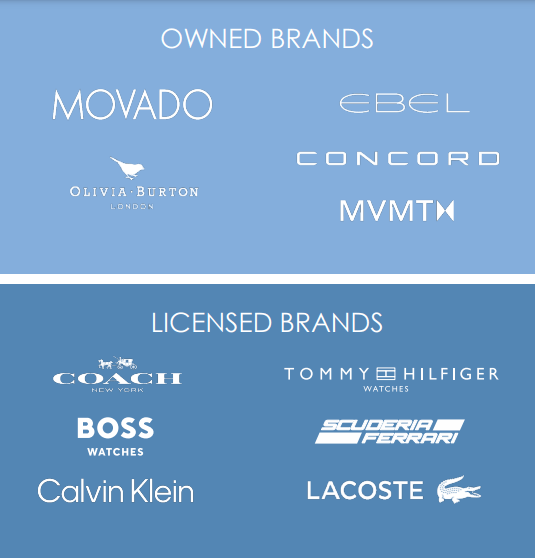
It is further divided into two subsections, owned brands, which include Movado®, Concord®, Ebel®, Olivia Burton®, and MVMT® brands, and licensed brands, which include Coach®, Tommy Hilfiger®, Hugo Boss®, Lacoste®, and Calvin Klein®, with Scuderia Ferrari® agreement ended at the end of the MRQ.
Movado Group Q2 Presentation
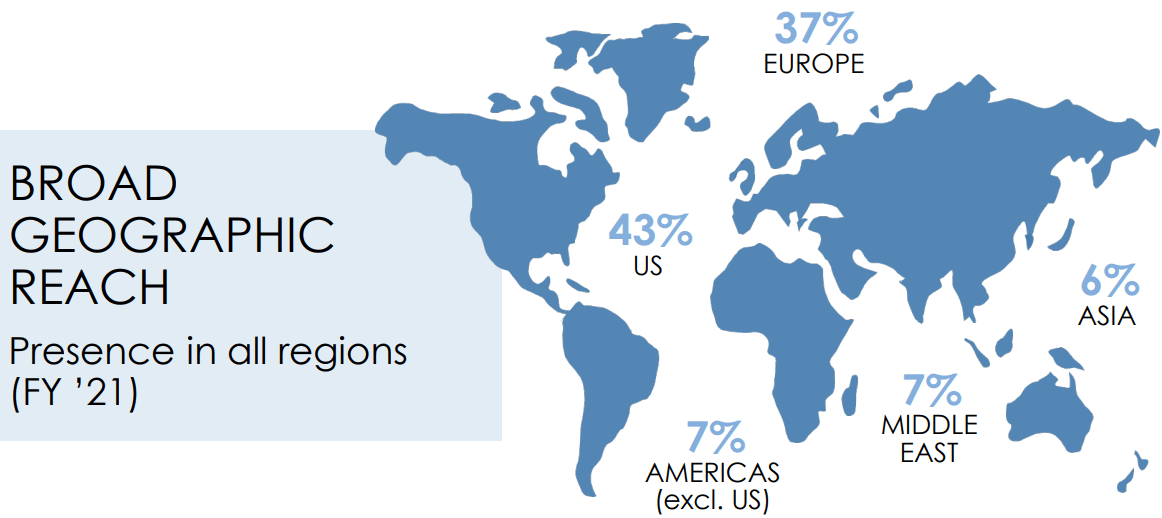
Geographically, it divides its operations into the US, accounting for 44% of the H1 2022 revenue, and International, accounting for the remaining 56%.
Movado Group Q2 Presentation
Improving Financial Performance
The company has had a tumultuous post-pandemic history with significant cyclical swings in its topline, deeply impacted by the Covid-imposed lockdowns and general economic uncertainty, leading to its quarterly revenue per share and revenue currently below its 3 and 5-year marks.
The company’s 3 and 5-year revenue CAGR stands at 2.6% and 7.4%, below the 13% & 10%, respectively, exhibited by its competitor, Titan (TITN).
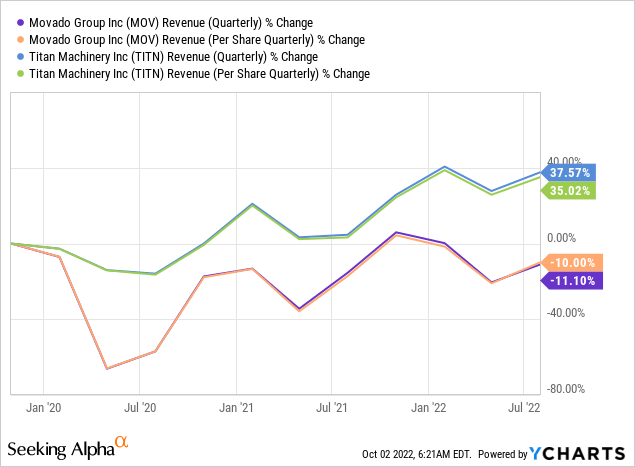
Given the normal business cyclical swings, it is more pertinent to use TTM figures for analyzing the company than quarterly figures, which point in a different direction but tell the same story compared to Titan. Observing it individually, the EPS and net income growth appear substantial, almost doubling since the pandemic, but dwarfed compared to its peer.
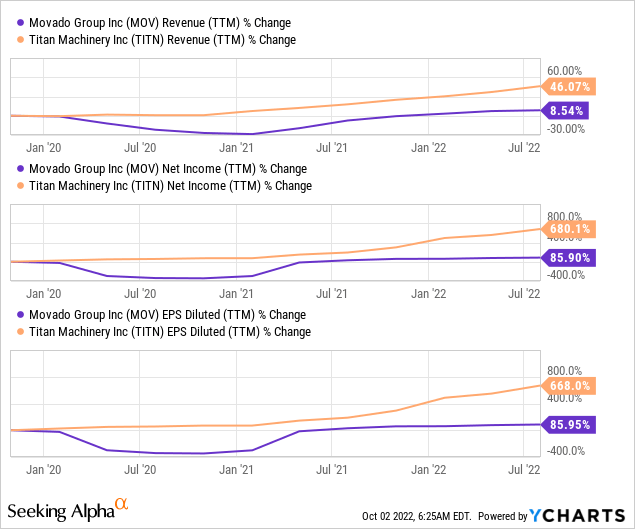
However, as is apparent, the company’s profitability has far outgrown its revenue, with the MRQ EPS up 26% compared to a 10.5% revenue growth. It has maintained an average quarterly operating margin of 8.6% and an EBITDA margin of 10.7% since 2020 despite the 27% operating loss in Q1 2020. In fact, during the previous 4 quarters, the company has consistently improved its YoY profit margins with an average growth of 323 bps in the gross margin, 449 bps in operating margin, and a 257 bps growth in net margin.
| Million USD (Except Percentages) | Q4 19 | Q1 20 | Q2 20 | Q3 20 | Q4 20 | Q1 21 | Q2 21 | Q3 21 | Q4 21 | Q1 22 | Q2 22 | Average |
| Total Revenues | 191 | 69.7 | 88.5 | 169.9 | 178.3 | 134.8 | 173.9 | 217.7 | 206 | 163.4 | 182.8 | |
| Revenue Growth | -63.51% | 26.97% | 91.98% | 4.94% | -24.40% | 29.01% | 25.19% | -5.37% | -20.68% | 11.87% | 7.60% | |
| Cost Of Revenues | 90.4 | 34.3 | 43.2 | 77.4 | 80.3 | 60.6 | 75.4 | 92.2 | 85.1 | 66.7 | 75.9 | |
| COGS Growth | -62.06% | 25.95% | 79.17% | 3.75% | -24.53% | 24.42% | 22.28% | -7.70% | -21.62% | 13.79% | 5.34% | |
| Gross Profit | 100.6 | 35.4 | 45.3 | 92.5 | 98 | 74.2 | 98.5 | 125.5 | 120.9 | 96.7 | 106.9 | |
| Gross Margin | 52.67% | 50.79% | 51.19% | 54.44% | 54.96% | 55.04% | 56.64% | 57.65% | 58.69% | 59.18% | 58.48% | 55.43% |
| Gross Margin Expansion | 3.20% | 3.73% | 4.14% | 1.84% | 3.23% | |||||||
| Total Operating Expenses | 94.3 | 54.4 | 46.9 | 68.6 | 74.5 | 60.8 | 73.8 | 84.1 | 83.8 | 71.4 | 76.1 | |
| Operating Income | 6.3 | -19 | -1.6 | 23.9 | 23.5 | 13.4 | 24.7 | 41.4 | 37.1 | 25.3 | 30.8 | |
| Operating Margin | 3.30% | -27.26% | -1.81% | 14.07% | 13.18% | 9.94% | 14.20% | 19.02% | 18.01% | 15.48% | 16.85% | 8.63% |
| Operating Margin Expansion | 4.95% | 4.83% | 5.54% | 2.65% | 4.49% | |||||||
| Net Interest Expenses | -0.2 | -0.3 | -0.6 | -0.6 | -0.5 | -0.3 | -0.2 | -0.1 | -0.1 | -0.1 | -0.1 | |
| Income Tax Expense | 4.6 | -32.3 | -1.6 | 7.5 | -4.8 | 3.3 | 5.3 | 9.6 | 6.6 | 6 | 6.4 | |
| Net Income after Minority Interests | 3.5 | -150 | -6.6 | 14.8 | 30.3 | 9.4 | 19.4 | 31.4 | 31.4 | 18.5 | 24 | |
| Net Profit Margin | 1.83% | -215.21% | -7.46% | 8.71% | 16.99% | 6.97% | 11.16% | 14.42% | 15.24% | 11.32% | 13.13% | -11.17% |
| Profit Margin Expansion | 5.71% | -1.75% | 4.35% | 1.97% | 2.57% | |||||||
| EBITDA | 8.4 | -15.1 | 1.8 | 27.2 | 24.9 | 16.5 | 27.7 | 44.6 | 38.5 | 28.2 | 33.6 | |
| EBITDA Margin | 4.40% | -21.66% | 2.03% | 16.01% | 13.97% | 12.24% | 15.93% | 20.49% | 18.69% | 17.26% | 18.38% | 10.70% |
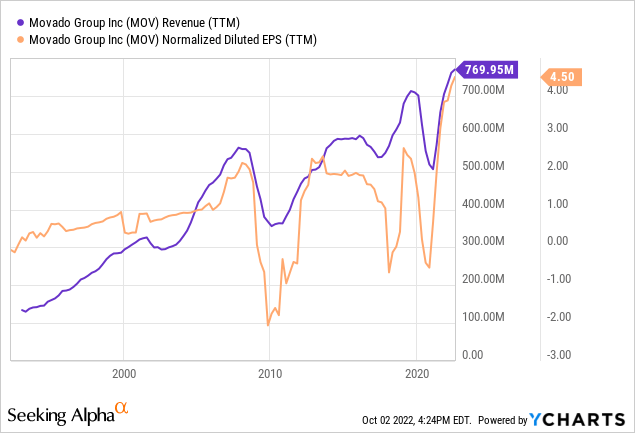
In absolute values, the MRQ results were an all-time high for the company, transitioning it toward achieving its guidance and making 2022 a record year. In line with its performance, the company expects to exceed its pre-pandemic sales and will likely surpass its 2022 guidance, with annual revenue of almost $790 million, generating a gross margin of about 58% and an operating margin of over 16%. This will demonstrate a YoY annual revenue growth of almost 8% and a diluted EPS growth of over 6.5%, which is marginally higher than its average post-pandemic growth.
The margins are also likely to expand with improving operational leverage and higher spreads because of improved pricing, as evident by the recent 12% YoY retail price increase in its higher-priced watches and a 70 bps improvement in operating expenses in the MRQ. Their forecasted annual income statement is likely to look somewhat like the following:
| (Million USD) | 2022 | 2021 | YoY Growth |
| Revenue | 785 | 732.4 | 7.18% |
| COGS | 329.7 | 313.3 | 5.23% |
| Gross Profit | 455.3 | 419.1 | 8.64% |
| Operating Expenses | 327.8 | 301.6 | 8.69% |
| Operating profit | 127.5 | 117.5 | 8.51% |
| Interest | -1 | -0.7 | 42.86% |
| Effective Tax @ 25% | 31.88 | 24.8 | 28.53% |
| Net Income attributable to MOV | 96.63 | 91.6 | 5.49% |
| Diluted EPS | 4.21 | 3.95 | 6.56% |
| Diluted Shares | 22.97 | 23.20 |
This shows a conservative but stable growth trend in the company’s financial performance and its move away from the post-pandemic turmoil.
Attractive Valuation
The company holds almost one-third of its current market cap of $631.63 million in liquid assets and has a strong balance sheet with an Altman-Z score of 4.7. Despite this indicated low-security risk, the stock is being traded at a discount to the industry medians. However, what really adds to MOV’s value proposition is its debt-free balance sheet which drops its EV-based relative valuation metrics to half of its peers.
One relevant metric that offsets the above is the conservative revenue growth, which has led to a P/S ratio of 0.84x and a forward P/S ratio of 0.8x, which is considerably higher relative to Titan’s 0.3x.
According to the forward EPS-based fair value calculator, even if I use a 5% growth rate, a 0.5% terminal growth rate, and a 10% discount rate (which essentially results in a YoY revenue decrease in present value), the stock appears 75% undervalued, ousting a price target of $49, where the company last traded in 2018.
This is considerably higher than Wall Street’s $38 target price, an upside of 35%, which most likely accounts for a recessionary environment that halts luxury goods’ sales. Either way, the stock is imbued with upside potential, adding to its bullish sentiment.
A Cherry On Top: Dividends
Movado has a share buyback program and pays dividends based on its cash flows, adding an extra layer of investor confidence to the security. It currently has a forward yield of 5%, based on a $1.4 per share annual payout. This is an amply better yield than the 2.7% of its competitors.
Further, the dividend is well-covered, with an FCF yield of over 11% and an earnings yield of over 15%. Even though the company has had a strong dividend growth CAGR of over 20% for the previous 5 years, I don’t expect a dividend hike during the year, as the company would likely invest the cash in its operations to safeguard against a recessionary environment. However, a $0.35 per share quarterly dividend can be expected later this year, in line with its history and the availability of cash.
The company repurchased approximately $21.5 million or 587,000 shares under its share repurchase program in the first half of the year and will likely amplify this number in the second half of the year as its earnings and cash flows are historically higher because of the cyclicality.
Conclusion
Movado’s owned and licensed brands are something that all of us have heard about or interacted with at some point in time. This brand recognition has very strong goodwill attached to it that sways investor confidence and market sentiment, improving stock volatility. The stock’s post-pandemic beta of 1.11 is a great indicator of this stability, which is a significant investor concern when it comes to navigating a recessionary environment.
Movado Group Q2 Presentation
Additionally, since the stock’s share price has faltered alongside the market, its buy thesis has significantly improved because of attractive valuation metrics, which are considerably lower than its 5-year average.
Considering an expected dividend and the upside potential, the stock’s short-term sentiment appears positive. Meanwhile, despite its slow current growth, the long-term prospect indicates that when the market starts recovering, it will start pricing in the upside of the stock, adding to investor gains. This whole scenario makes me rate the stock as a buy.
Be the first to comment