

THEPALMER/E+ via Getty Images
The energy sector did not lack news flow in the first quarter, with Russia’s invasion of Ukraine limiting a key global energy supplier, elevated inflation proving to be persistent, and the first Federal Reserve (FED) rate hike in three years occurring. With global energy supply uncertainty, the role of the midstream segment and the US shale industry is now firmly on investors’ radars. Rising rates also present midstream equities as an option, given their current higher yields compared to other income-oriented asset classes. Midstream companies are able to pass rising costs to customers through fee-adjusted contracts, which is one reason why midstream equities could be well-positioned if US energy production increases. With balance sheets improving, further return of capital via dividend increases and buybacks are made possible. Long-term, the ongoing conflict in Ukraine also shifts focus to the U.S. energy sector, as countries that rely on Russian energy are likely to explore alternative solutions.
Key Takeaways
- For investors looking for yields in this market, midstream equities could be an attractive alternative because they’re well situated when rates rise, due in part to their ability to pass through costs.
- Additional free cash flow for midstream equities through increasing US energy production could result in further dividend and buyback activities, highlighting balance sheet strength.
- Geopolitical risks associated with the situation in Ukraine mean oil prices are likely to remain elevated amid Russian sanctions. However, we believe that U.S. domestic producers can step in as an alternative to meet rising demand, creating potential tailwinds for midstream equities.
Midstream Equities Expected to be Well-Positioned for Rising Rate Environment
The Fed is on track for seven to eight rate hikes based on the futures curve totaling 200 basis points in 2022, and on March 16th, it kicked off its latest hiking cycle.1 The Fed raised its target federal funds rate by 25 basis points in an attempt to tame inflation after it set rates at near zero levels during the pandemic.2 The Consumer Price Index (CPI) rose 7.9% year-over-year (YoY) in February 2022, its biggest jump in almost 40 years.3 Higher operating costs and inflation are often a headwind for most equities, but midstream equities are more insulated from these inflationary pressures than others.
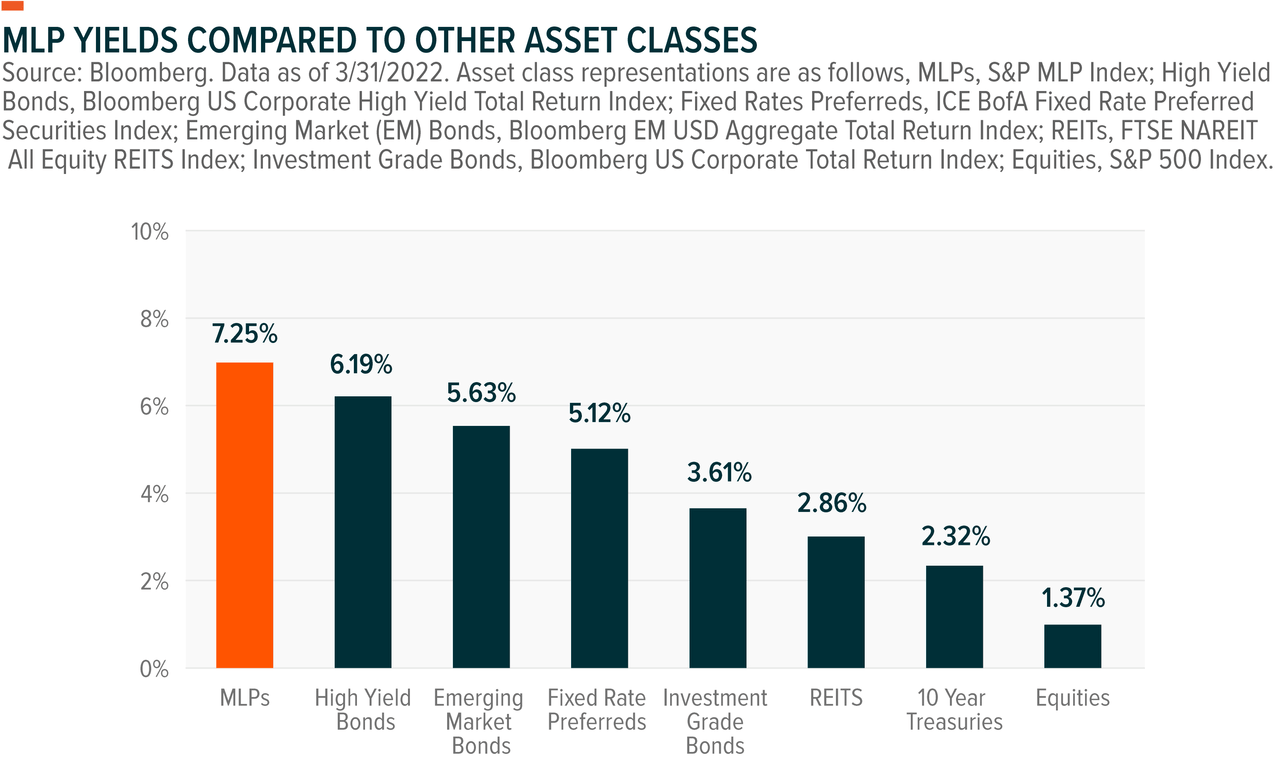
We believe MLPs, which are yield oriented segment of the midstream asset class, are well-positioned for this inflationary cycle, and MLPs have historically performed well during rising rate environments.4 Rates start rising when inflationary expectations respond to economic growth, and MLPs tend to benefit from those market conditions given that demand for energy rises. Recent increases in energy demand over the past decade were often fueled by the US shale industry, in turn leading to greater transportation volumes moving through midstream pipelines. With yields north of 7%, MLPs currently offer more income potential than most fixed income asset classes bonds, as the chart below shows.
Midstream’s shift to the self-funding model also reduces its reliance on debt issuance, so the threat of rising borrowing costs is less impactful on the midstream model than it may have been in the past. Debt for major midstream companies was also 5% lower in 2021 compared to 2015, as midstream earnings grew more than 43% in that seven-year period.5 Many midstream companies consequently paid down debt and reduced leverage ratios into the 3.5-4.0x range in 2021.6
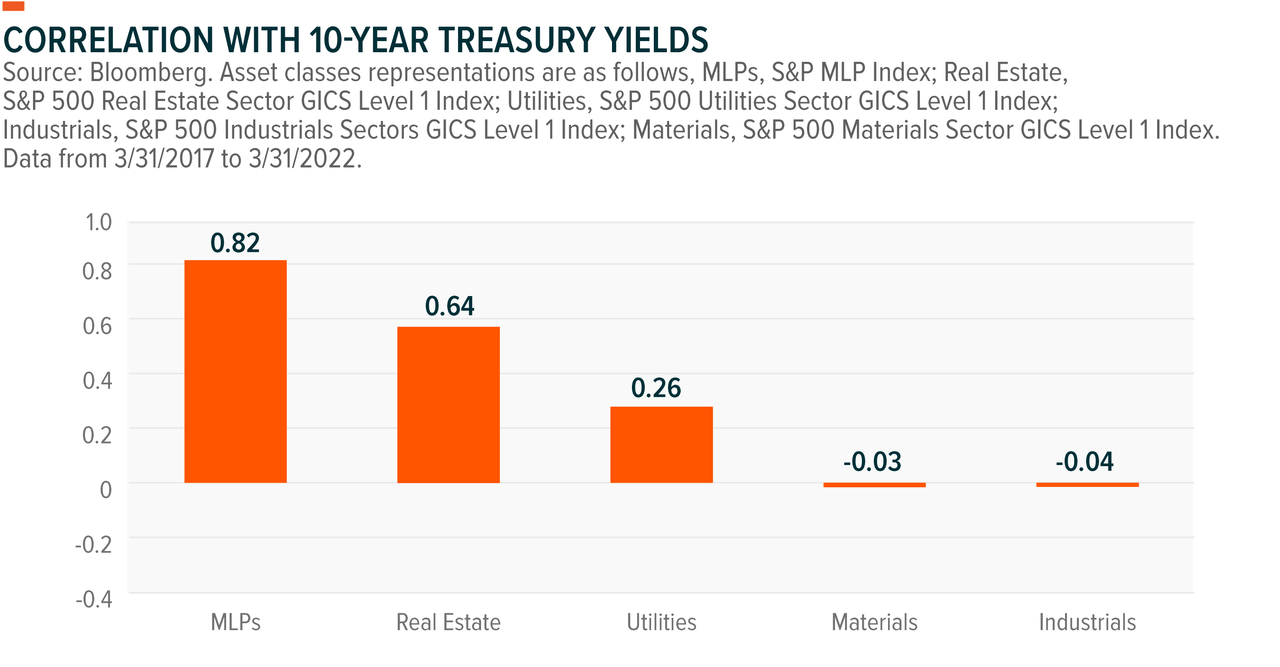
Midstream companies’ exposure to real assets across the energy infrastructure grid, such as long-haul pipelines, are also benefiting the asset class. Compared to other sectors with significant exposure to real assets, MLPs, which are yield orientated segment of midstream equities, are highly correlated to rising rates. The nature of midstream contracts allows them to pass through fees to customers, rate-adjusted for inflation. For example, many interstate liquids pipeline companies adjust fees based on the Federal Energy Regulatory Commission’s (FERC) Oil Pipeline Index. This index is based on the Producer Price Index (PPI) for finished goods, which is adjusted every five years. As a result, many midstream companies are able to include a degree of inflation protection in their contracts.
Energy Sector Shows Strong Free Cash Flow Generation
Both the energy sector’s and midstream’s earnings were notably strong in Q4 2021, powered by oil prices reaching a seven-year high in the last quarter of 2021. Oil majors had their best net earnings since 2014, allowing them to increase their quarterly dividends and buy back shares.7 We believe that rising buyback activities signal that the management teams still view the shares as undervalued even after the recent rally in the market.
Oil majors’ strength permeated across the sector as well. In the midstream segment, energy infrastructure companies reported a 29% increase in earnings compared to the same period last year, which reflected record transportation volumes as the economy re-opened.8 Reduced capital expenditure (CAPEX) and lower debt payments in recent years led to a steady upward trajectory of free cash flow yield since February 2020 due to this higher oil price environment.9 Companies reduced CapEx by roughly 45% from 2018 to 2021 as weaker oil prices prompted them to halt investments.> Also, midstream debt levels declined by 2% in 2021 compared to 2020.11
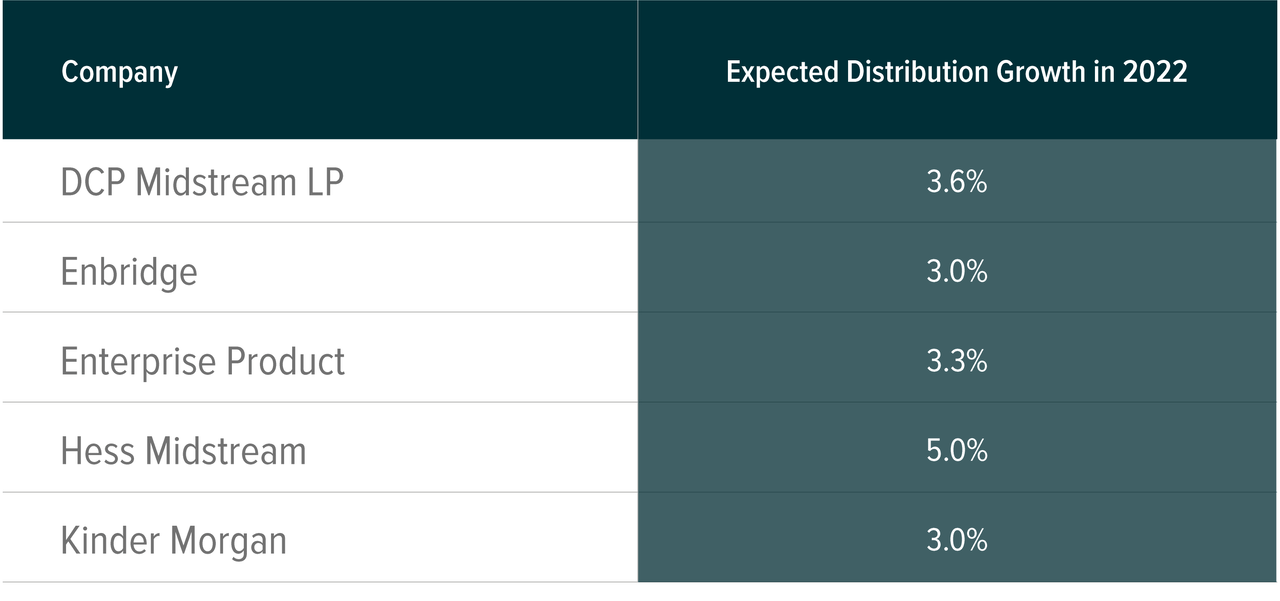
The rise in oil prices resulted in greater buyback activities and dividend growth of 4% in Q4 2021 compared to the prior quarter.12 Large midstream companies led much of the return of capital across the sector. Enterprise Products Partners returned 84% of its cash flow to investors through distributions and buybacks in 2021, and Magellan Midstream returned a record $1.4 billion of value to shareholders through cash distributions and buybacks, a 19% increase over 2020.13,14 The actions of some of the larger companies can sometimes lead to actions across the rest of the sector, and many midstream companies announced dividend payment increases for 2022, communicated to be in the 3–5% range. Strong expected cash flow and the rising oil price environment could contribute to further dividend increases.
Higher Oil Prices Expected for Longer
Following the significant tightening of global oil supply, we expect a prolonged deficit will lead to elevated oil prices for the foreseeable future. Russia, the world’s third largest oil supplier, representing 10% of global oil supply, was hit by extensive sanctions and raises questions about its role as a major energy supplier.15 A significant portion of Russia’s 10 million barrels per day (bpd) oil supply could come offline from the global markets depending on the extent of Western sanctions. Adding to the bull case for oil prices, global oil demand is expected to rise from 95.5 million bpd in 2021 to 99.7 million bpd in 2022 as inflationary pressures spread across the global economy.16
Amid growing pressures from oil-consuming nations to increase output, OPEC+ is taking a conservative approach to raising production. Some of this caution may stem from potential Covid spike risks, geopolitical conflicts, inventory control for future oil prices, amongst other reasons. To fulfill increasing demand, OPEC+ is targeting a gradual increase in oil production, raising its output by 400,000 bpd each month since July 2021. Its ultimate goal is to fully recover the 9.7 million bpd of output it lost due to the pandemic by the end of 2022.17 However, as of March 2022, OPEC+ production only increased its production by 253,000 bpd, a mere 63% of the group’s initial targets due to falling production of other member states like Libya and Nigeria.18 We believe this lagging production by OPEC+ will be a supply side catalyst to oil prices for the rest of the year.
U.S. domestic production is also expected to increase from an average of 11.2 million bpd in 2021, to 11.8 million bpd in 2022, and 12.4 million bpd in 2023.19 However, production levels are still below pre-pandemic levels of 12.9 million bpd in 2019, and more drilling activities in the U.S. will be needed in order to fulfill the global shortfall.20 The sluggish production growth in the US can partly be attributed to shareholder preferences for return of capital rather than growth activity. However, as the commodity price environment remains supportive, investors are likely to see the value in monetizing energy assets at these oil prices. The supply deficit is also shining the spotlight on the US shale industry as an alternative source of energy production for Western nations.
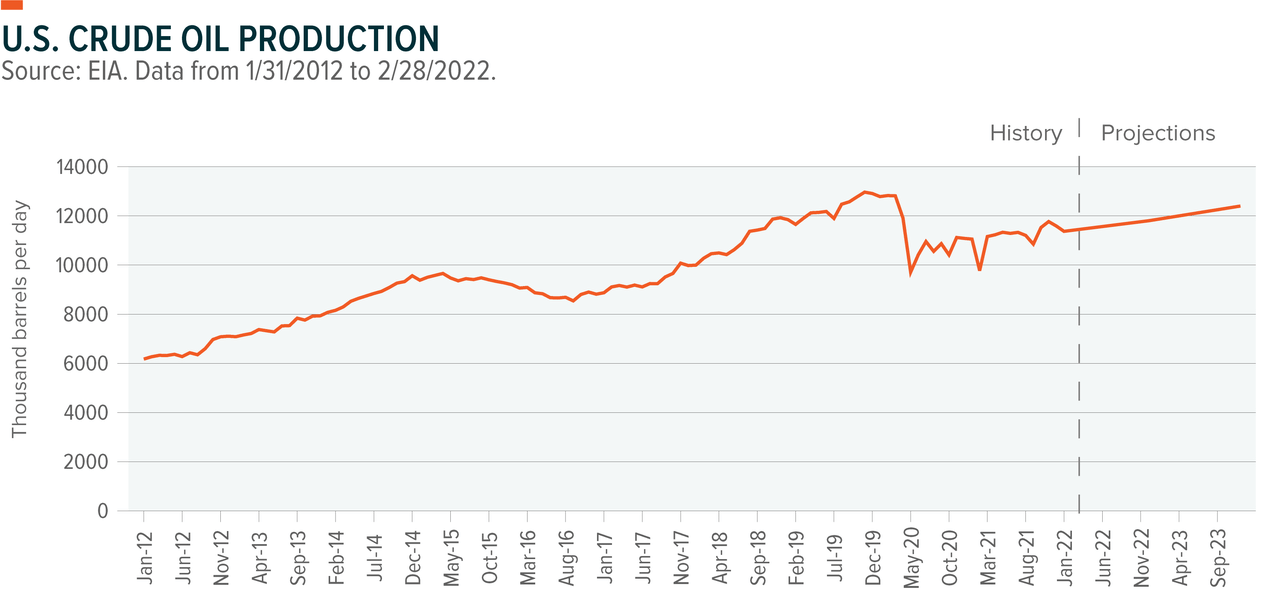
The U.S. imports only about 3% of its oil demand from Russia, but prices are based on the global commodity markets, so it is not immune to the war’s effects on energy.21 With Russian oil no longer accepted at U.S. ports and given conservative OPEC+ policies, the U.S. needs to find alternatives. We believe that midstream is poised to contribute, and benefit, as more U.S. domestic producers plan to ramp up production. The U.S. has been producing roughly 11.6 million bpd in 2022, and producers are boosting production as quickly as they can.22 Exxon Mobil plans to increase its production from the Permian by 25% this year.23 Chevron has plans to increase production by 10%, which would produce another 60,000 barrels per day.24 By end of 2023, EIA expects U.S. crude oil production to grow by 6% as oil prices are expected to be elevated.
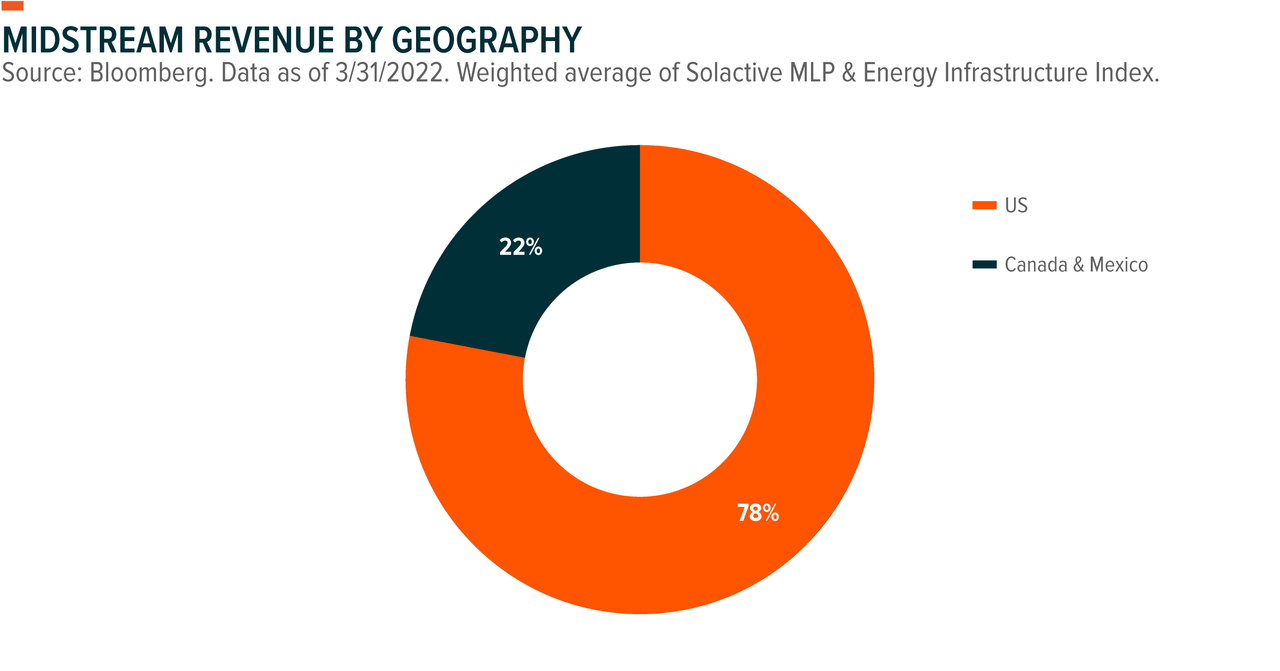
As drilling activities from the upstream are expected to increase domestically, U.S. energy infrastructure companies are expected to generate higher revenue from increased transportation volumes. Currently, 78% of the U.S. midstream revenues come from the U.S. while 22% of midstream revenues are from Canada and Mexico.25 Higher oil prices and Russian shortfalls could allow more U.S. energy infrastructure companies to consider raising CapEx to increase production to keep up with rising global demand.
Conclusion: Current Scenario Favorable for MLPs and Midstream
We expect the factors that made for an eventful Q1 to persist throughout the year. Oil prices could remain high as inflation remains elevated and oil supply is curtailed by OPEC+. Rising energy prices remained the top driver of inflation in 2021, and this could be an opportunity for the energy sector as they can generate higher revenue from increased prices.26 As of December 2021, the U.S. is the world’s largest oil producer with roughly 20% of the global market share.27 Higher oil prices coupled with the supply disruptions in Eastern Europe could increase the U.S.’ share. Especially in Europe, U.S. energy could be a long-term alternative to combat the reliance on Russian energy. We expect increased drilling activities in the U.S. as a result of upstream benefits from rising oil prices and greater global demand. For midstream, increasing CapEx makes sense in this environment, as higher oil production leads to greater volumes for the midstream infrastructure companies.
Related ETFs
MLPA: The Global X MLP ETF invests in some of the largest, most liquid midstream Master Limited Partnerships (MLPs).
MLPX: The Global X MLP & Energy Infrastructure ETF is a tax-efficient vehicle for gaining access to MLPs and similar entities, such as the General Partners of MLPs and energy infrastructure corporations.
Definitions:
S&P MLP Index: Provides investors with exposure to the leading partnerships that trade on the NYSE and NASDAQ. The index includes both master limited partnerships (MLPs) and publicly traded limited liability companies (LLCs), which have a similar legal structure to MLPs and share the same tax benefits.
S&P 500 Real Estate Sector GICS Level 1 Index: The Index comprises those companies included in the S&P500 that are members of the Global Industry Classification Standard (GICS) Real Estate sector. These companies include equity real estate investment trusts and real estate management & development.
S&P 500 Utilities Sector GICS Level 1 Index: The Index comprises those companies included in the S&P500 that are members of the Global Industry Classification Standard (GICS) Utilities sector. These companies include electric utilities, gas utilities, water utilities, independent power and renewable electricity producer.
S&P 500 Materials Sector GICS Level 1 Index: The Index comprises those companies included in the S&P500 that are members of the Global Industry Classification Standard (GICS) Materials sector. These companies include chemicals, construction materials, containers & packaging, metals &mining, and paper & forest products companies.
S&P 500 Industrials Sector GICS Level 1 Index: The Index comprises those companies included in the S&P500 that are members of the Global Industry Classification Standard (GICS) Industrials sector. These companies include capital goods, commercial & professional services and transportation.
Solactive MLP & Energy Infrastructure Index: The Solactive MLP & Energy Infrastructure Index is intended to give investors a means of tracking the performance of the energy infrastructure MLP asset class in the United States. The index is composed of Midstream MLPs engaged in the transportation, storage, and processing of natural resources.
EBITDA: Earnings before interest, tax, depreciation and amortization (EBITDA) is a measure of a company’s operating performance. Essentially, it’s a way to evaluate a company’s performance without having to factor in financing decisions, accounting decisions or tax environments.
Crude Oil: Measured based on the Generic 1st ‘CL’ Future, which is the nearest crude oil future to expiration.
Self-Funding Model: Involves reducing an MLP’s reliance on outside sources of financing, namely the capital markets, and using more organic sources of financing such as internal cash flow.
Footnotes:
- Reuters, “Fed’s Harker expects 25-basis-point rate hikes, but open to 50 basis points. 3/29/2022.
- Federal Reserve. 3/16/2022.
- S. Bureau of Labor Statistics. Data as of 3/10/2022.
- Data represented by S&P MLP Index. Data from 9/6/2007 to 3/31/2022. Since 2007, the four major rising rate periods resulted in the 10-year Treasury rate increasing by 193 basis points, 134 basis points, 188 basis points and 153 basis points, respectively. In those four periods, S&P MLP Index increased 78%, 6.1%, decreased 14.4% and increased 64.1% respectively.
- Data represented by Solactive MLP & Energy Infrastructure Index. Data from 12/31/2015 to 12/31/2021. Leverage measured by Total debt to Total Asset.
- Data as of 12/31/2021. Midstream sector represented by Solactive MLP & Energy Infrastructure Index. Measured by Debt to EBITDA.
- Oil Majors include Shell, BP ExxonMobil, Chevron, TotalEnergies and ConocoPhillips. Oil Majors combined net income of $41.3 billion, more than double the $17.3 billion recorded in the previous quarter.
- Data represented by Solactive MLP & Energy Infrastructure Index. Calculated by comparing adjusted Earnings Before Interest, Taxes, Depreciation, and Amortization (EBITDA) per share of 7.05 in Q4 2021 vs. 5.46 in Q4 2020.
- Represented by Solactive MLP & Energy Infrastructure Index. Data from 2/28/20 to 2/28/22
- Data represented by Solactive MLP & Energy Infrastructure Index. Data from 12/31/2017 to 12/2021.
- Data represented by Solactive MLP & Energy Infrastructure Index. Data from 12/31/2020 to 12/2021.
- Data Represented by Solactive MLP & Energy Infrastructure Index. Data from 9/30/21 to 12/31/21
- Enterprise Products Partners, Form 8-K. 2/1/2022.
- PR Newswire, “Magellan Midstream Reports Fourth-Quarter 2022 Financial Results”. 2/2/2022.
- IEA, “Energy Fact Sheet: Why does Russian oil and gas matter?” 3/21/2022.
- Reuters, “OPEC sees well supported oil market in 2022, despite Omicron”. 1/18/2022.
- Reuters, “OPEC+ supply gap widens further as February compliance jumps”. 3/18/2022.
- Reuters, “OPEC output rise in March falls short of pledged increase”. 4/1/2022.
- “Short-Term Energy Outlook” 1/12/2022.
- EIA, “Petroleum & Other Liquids” Data as of 3/31/2022.
- EIA, “The U.S. imports more petroleum products than crude oil from Russia”. 3/22/2022.
- EIA, “Short-Term Energy Outlook”. 3/8/2022.
- Reuters, “Exxon boosts oil production with new vessel, raises Guyana outlook”. 2/11/2022.
- Chevron, Earnings Report Q4 2021.
- Source: Bloomberg. Data as of 1/31/2022. Weighted average of Solactive MLP & Energy Infrastructure Index.
- US Bureau of Labor Statistics.
- EIA, “What countries are the top producers and consumers of oil?”. 12/8/2021.
Carefully consider the funds’ investment objectives, risks, and charges and expenses. This and other information can be found in the funds’ full or summary prospectuses, which may be obtained at globalxetfs.com. Please read the prospectus carefully before investing.
Global X Management Company LLC serves as an advisor to the Global X Funds.
Editor’s Note: The summary bullets for this article were chosen by Seeking Alpha editors.
Be the first to comment