

baranozdemir
By Barbara Velado
When it comes to climate change, one of the most effective mitigation options is to decarbonize the economy.1 Not only does the world need to rethink energy systems, transport technologies, and materials production processes, but also the role of capital in financing the low-carbon transition. Low-carbon indices offer market participants an efficient way of managing and mitigating carbon-related financial risks within investments. Launched in August 2021, the S&P Carbon Control Indices seek to systematically reduce index-level carbon intensity2 relative to its underlying benchmark while maintaining similar industry group and country composition. Here, we explore how.
How Are the S&P Carbon Control Indices Constructed?
Exhibit 1 highlights how the S&P Carbon Control Indices are constructed. First, within each underlying universe, the carbon control index excludes based on a variety of factors, including:
- Companies with poor S&P DJI ESG Score3 relative to their GICS industry group peers
- Companies involved in detrimental business activities
- UNGC violators and companies involved in controversies
Then, the index reweights stocks to minimize index-level-weighted average carbon intensity compared to that of its market-cap-weighted benchmark.4
S&P Dow Jones Indices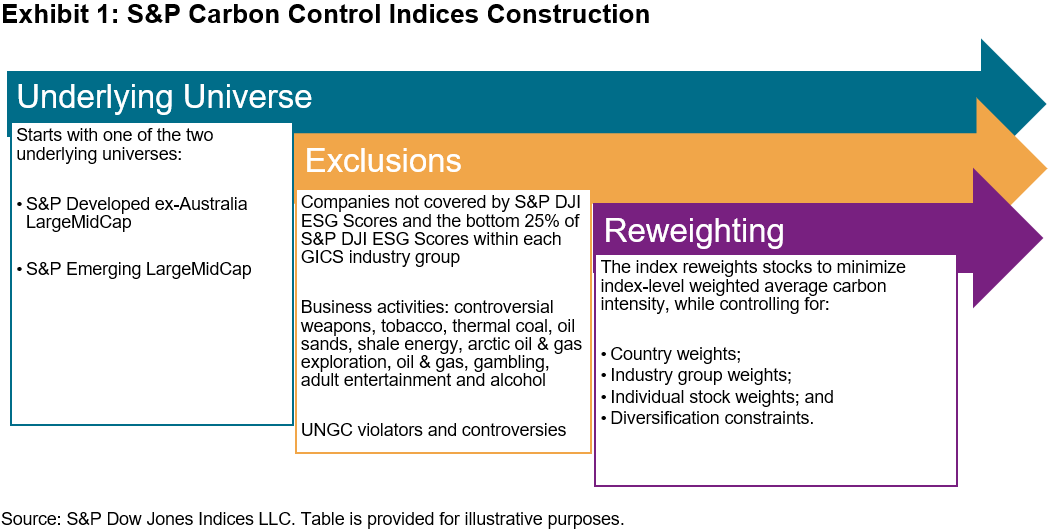
Understanding Sources of Emissions
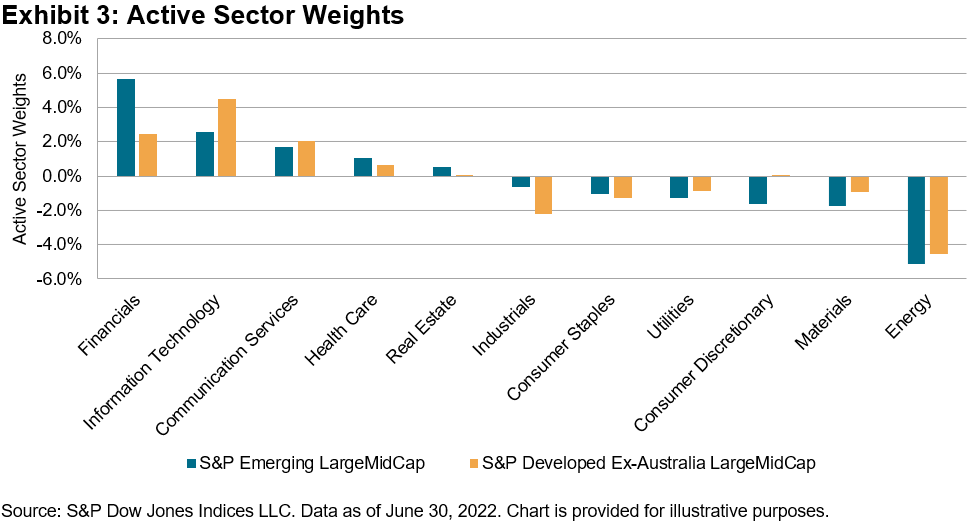
Unsurprisingly, when looking at sectors more closely, we find that Utilities, Materials, and Energy have been the largest carbon emitters of direct and first-tier upstream emissions per unit of revenue,5 accounting for more than 80% of total emissions. It’s also interesting to note how Utilities and Materials companies within emerging markets are more carbon intense than their counterparts in the developed market region (see Exhibit 2). It follows that the S&P Carbon Control Indices underweighted those sectors while overweighting Financials, Information Technology, and Communication Services, whose products and services have been generally low-carbon intense (see Exhibit 3).
S&P Dow Jones Indices S&P Dow Jones Indices S&P Dow Jones Indices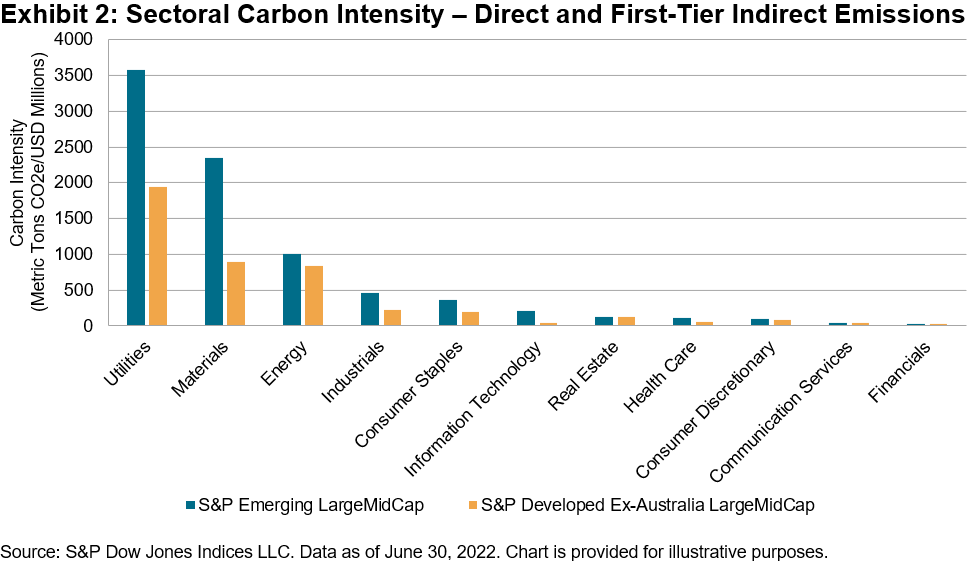
Systematically Reducing Carbon Intensity
As seen in Exhibit 5, the S&P Carbon Control Indices minimized index-level weighted average carbon intensity by 70% and 80%, for the developed and emerging market regions, respectively. Further, they also reduced fossil fuel reserves emissions by 100%, mostly due to the fossil fuel exclusions. As these indices also incorporate the S&P DJI ESG Score into the selection stage of index constituents, it also provides an overall improvement of the index-level S&P DJI ESG Score and its sub-dimensional scores. This is a beneficial outcome: S&P DJI ESG Scores cover far more areas than carbon emissions, thus only incorporating carbon intensity would not guarantee that broader ESG objectives would be accounted for.
S&P Dow Jones Indices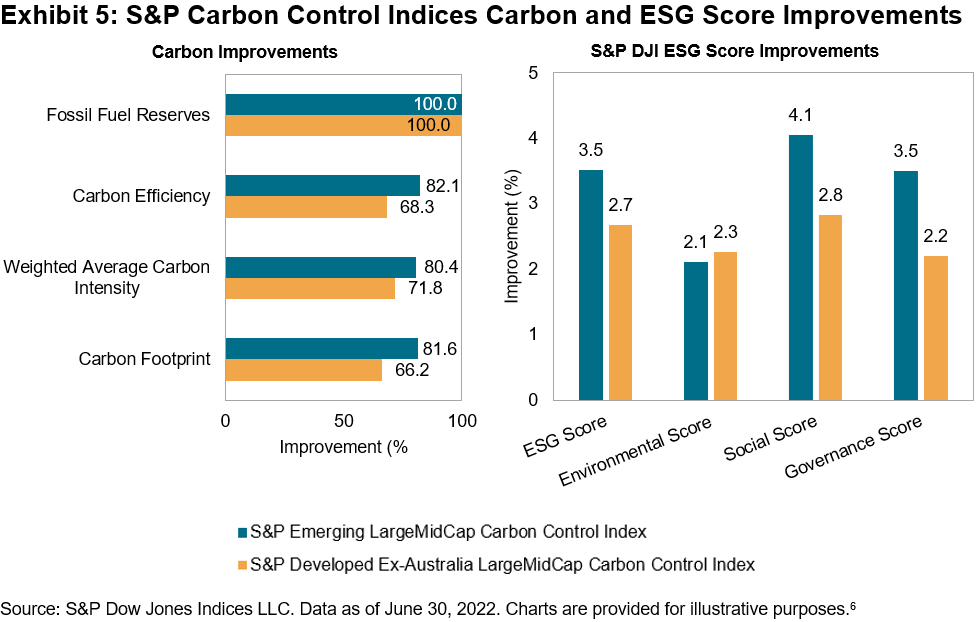
The S&P Carbon Control Indices have shown positive performance relative to their market-cap-weighted benchmarks, both in the back-tested and live periods of the indices, with a three-year tracking error of 1.16% and 1.36% for the emerging and developed market regions, respectively.
S&P Dow Jones Indices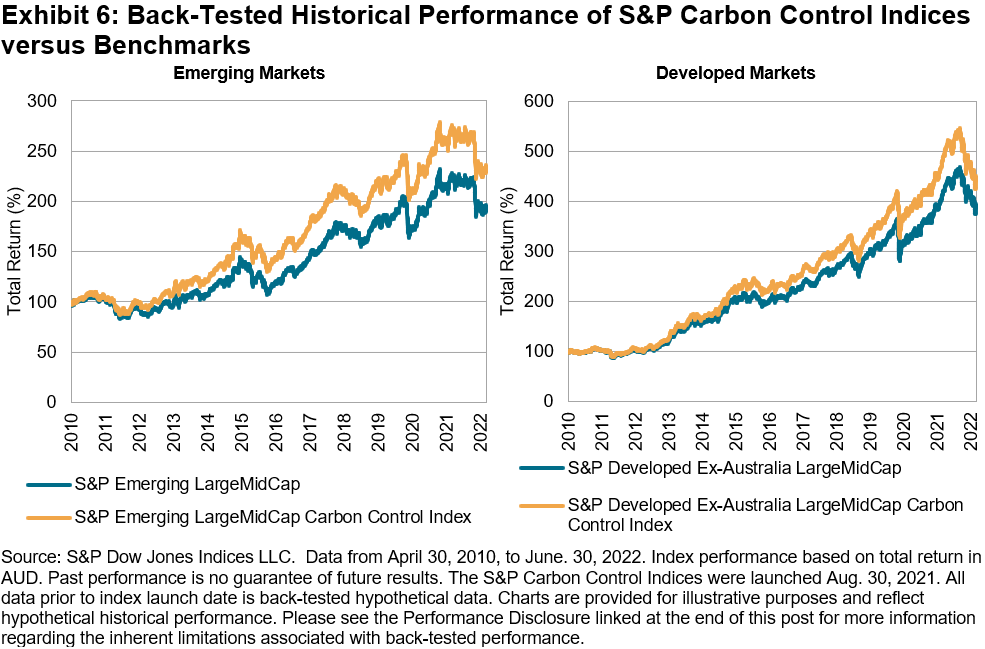
As the world pushes to transition to a greener economy, carbon will continue to represent an imminent risk for businesses and the investment community alike. The S&P Carbon Control Indices combine selection and reweighting approaches that significantly reduce index-level carbon intensity relative to their underlying benchmarks. Simply put, these indices provide a relative improvement – not an absolute one. For carbon-conscious market participants, this may be just the right fit.
1 According to the IPCC, to keep warming below 1.5°C as called for in the Paris Agreement, by 2030, global emissions need to be reduced by 45% and reach net zero by 2050. Please note that the S&P Carbon Control Indices do not seek to align with the objectives of the Paris Agreement to keep warming below 1.5°C.
2 Carbon intensity is defined as the metric tons of operational and first-tier supply chain carbon emissions per USD 1 million in revenues.
3 For more information on S&P DJI ESG Scores, please see here.
4 For more information on the S&P Carbon Control Indices, please refer to the methodology.
5 For more information on greenhouse gas emissions calculated by Trucost, please see here.
6 For more information on index carbon metrics, please see here.
Disclosure: Copyright © 2022 S&P Dow Jones Indices LLC, a division of S&P Global. All rights reserved. This material is reproduced with the prior written consent of S&P DJI. For more information on S&P DJI please visit www.spdji.com. For full terms of use and disclosures please visit Terms of Use.
Editor’s Note: The summary bullets for this article were chosen by Seeking Alpha editors.
Be the first to comment