


piranka/E+ via Getty Images
Microsoft, IBM
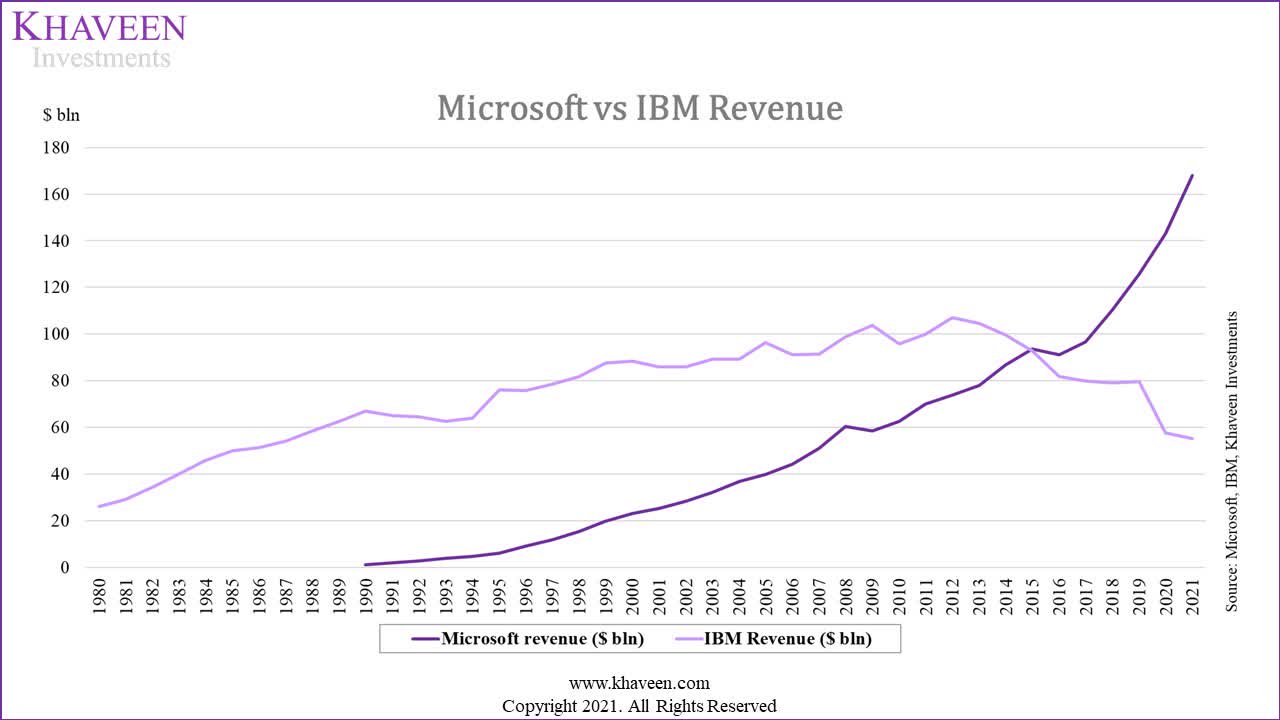
Both International Business Machines Corporation (NYSE:IBM) and Microsoft Corporation (NASDAQ:MSFT) are among the top IT companies. IBM was the largest IT company by revenue ($7.2 bln) from the 1970s until 2007 and is not even in the top 10 in 2021. In contrast, Microsoft, which was founded in 1975, continued to grow to become the second-largest IT company in 2021 by revenue ($168 bln) only behind Apple ($365 bln).
We analyzed Microsoft and IBM’s businesses and contrasted their strategies based on product innovation, diversification, acquisition, integration and cloud strategies to determine which company has better executed their strategies and ranked the companies against each other.
Moreover, we compared the companies in terms of their financials. In terms of diversification, we broke down its segments and analyzed its revenue growth. Also, we compared their margins in terms of gross, net and FCF margins. Additionally, we looked at both companies based on efficiency and credit analysis.
Finally, we looked at their valuation ratios and compared them against each other and their 5-year averages, as well as our in-house DCF analysis and compared it against analyst consensus. Considering their historical investment returns and dividend yields, we formulated a long/short strategy for the two stocks.
Strategies
IBM, Microsoft, Khaveen Investments
Product Innovation Strategy
IBM was founded in 1911 but rose to the top of the tech sector in 1962 as the largest computer company with a 62% market share, as it created the first portable computer (IBM 5100). However, with the rise of IBM clones created by Compaq, competition for the company increased while its market share eroded to 32% in 1980. According to All About Circuits, IBM had tried to make clone computers redundant by developing the new Micro Channel Architecture computer architecture but it was not even compatible with its software. Overall, the company was unable to develop a competitive advantage in software and hardware to remain competitive in the computer market due to increased competition from competitors’ compatible products and cheaper products as prices of mainframe computers fell by 90% as well as new product innovations such as PCs and workstations from Compaq and Sun Microsystems. It held its market leadership in the PC market until 1994 before falling behind Compaq, Apple (AAPL) and Packard Bell.
In comparison, since Microsoft’s launch in 1975 and securing the contract to provide OS to IBM’s computers, Microsoft had dominated the OS market since the late 1980s with a market share of over 80%. In 2021, Microsoft continues to be the market leader with a market share of 74% in OS but is seeing increasing competition from Apple’s macOS with the strong sales of its PCs. Microsoft focused on OS with continuous innovation with subsequent product development and launches of new OS products including 15 Windows product launches (including Windows 11) while IBM only had 8 main PC product series. Also, it made deals with PC makers to supply OS to be preinstalled at discounted prices. Although it tried to run crack down on clone software and free alternatives such as Linux which continue to exist, it instead tolerated piracy of Windows OS as explained by the following quote of the potential opportunities to monetize it.
As long as they’re going to steal it, we want them to steal ours. They’ll get sort of addicted, and then we’ll somehow figure out how to collect sometime in the next decade. – Bill Gates, Founder & Former CEO of Microsoft
Overall, we believe Microsoft edges out IBM in terms of its product innovation strategy as it maintained its market share in the OS market with its continuous product development and more product launches than IBM, which lost its market share leadership to stronger competitors. Microsoft also established various partnerships with PC makers, which IBM failed to do.
Diversification Strategy
In 1980, IBM’s revenue from its largest (Hardware) segment was 84%. In 1993, the company decided to focus on higher-margin software businesses such as middleware and consulting, targeting enterprises along with its mainframe business. This was successful for the company as its revenues grew again from 1983. However, with the rise and shift towards public clouds, the company’s growth started to decline in 2013 as IBM began losing server hardware market share rapidly to ODM competitors for public cloud customers. Though, its Hardware segment still represented 25% of its revenue in 2021, its third-largest segment behind IT consulting (31%) and Software (27%).
On the other hand, Microsoft diversified away from its largest segment, system software (53% of revenue in 1986) into application software such as productivity and HR software. In 2021, Windows only accounted for 13% of the company’s revenues and had a 5-year average growth of 5.8% below its total average of 13.1%.
- Diversified within the software industry with productivity software in 1983 with Microsoft Word and Microsoft Excel in 1985
- Diversified into the Media Industry with its advertising segment with Internet Explorer web browsers launched in 1995
- Expanded within the software industry with HR software Microsoft Dynamics in 2006
- Diversified into the entertainment industry with its Xbox business in 2001
|
Company |
Microsoft (1986 – Non-System Software) |
IBM (1980 – Non-Hardware) |
|
Revenue Breakdown (Past) |
47% |
16% |
|
Revenue Breakdown (2021) |
87% |
75% |
|
Revenue (Past) ($ mln) |
93 |
4,192 |
|
Revenue (2021) ($ mln) |
146,237 |
43,013 |
|
Annualized Growth % |
23.4% |
5.8% |
Source: Microsoft, IBM. Khaveen Investments
Based on the table above, we calculated the annualized growth rate of the revenue contribution of the revenue streams of Microsoft’s non-System Software revenue in 1986 and IBM’s non-Hardware revenue from 1980 to 2021. Thus, we believe that Microsoft has a superior diversification strategy with its higher annualized growth of 23.4% compared to 5.8% for IBM.
Acquisition Strategy
|
IBM Acquisitions |
Acquisition Cost ($ mln) |
Revenue ($ mln) |
Microsoft Acquisitions |
Acquisition Cost ($ mln) |
Revenue ($ mln) |
|
Red Hat |
34,000 |
3,400 |
Activision Blizzard |
68,700 |
8,800 |
|
Cognos |
5,000 |
1,000 |
|
26,200 |
2,970 |
|
PwC Consulting Business |
3,500 |
4,900 |
Nuance Communications |
19,700 |
1,931 |
|
Lotus Development Corporation |
3,500 |
1,150 (excluded) |
Skype Technologies |
8,500 |
622 |
|
Truven Health Analytics |
2,600 |
544 |
ZeniMax Media |
8,100 |
1750 |
|
Rational Software Corp |
2,100 |
592 |
GitHub |
7,500 |
200 |
|
SoftLayer Technologies |
2,000 |
280 |
Nokia (Mobile Phones unit) |
7,200 |
1990 |
|
Netezza |
1,700 |
190.6 |
aQuantive |
6,333 |
700 |
|
FileNet Corp |
1,600 |
422 |
Mojang |
2,500 |
412 |
|
Sterling Commerce |
1,400 |
479 |
Visio Corp |
1,375 |
166 |
|
Total |
57,400 |
11,808 |
Total |
156,108 |
19,541 |
|
Revenue Contribution |
20.6% |
Revenue Contribution |
11.6% |
Source: Company Data, Khaveen Investments
The table above shows the top 10 acquisitions by IBM and Microsoft in terms of their acquisition costs and revenue. IBM made a series of acquisitions such as Lotus Development Corp for middleware software which was later divested off to HCL in 2018 for just $1.8 bln, translating to a loss of $1.7 bln. Also, it acquired PwC’s management consulting arm in 2002. Besides that, it also acquired software companies such as Cognos, Truven Health Analytics, Rational Software, SoftLayer, Netezza, FileNet and Sterling Commerce as well as hybrid cloud company Red Hat which was its largest acquisition ever at $34 bln.
On the other hand, Microsoft’s largest deal is the planned acquisition of Activision Blizzard (ATVI) for $68.7 bln to expand its footprint in the gaming market, followed by LinkedIn, Nuance Communications, Skype, ZeniMax Media, GitHub, Nokia (Mobile phones), aQuantive, Mojang, and Visio Corp.
The total revenue contribution of Microsoft’s top 10 acquisitions ($19.5 bln) is higher than IBM at $11.8 bln (excludes Lotus) but its revenue contribution is lower at 11.6% compared to 20.6%. However, Microsoft ($156.1 bln) spent more than IBM ($57.4 bln). This translates to a revenue per cost of $0.21 for IBM which is higher compared to Microsoft at only $0.13.
Therefore, while IBM divested Lotus, its revenue contribution from its largest acquisitions is still higher than Microsoft. Additionally, with a higher revenue per acquisition cost, we believe that IBM has a superior acquisition strategy to Microsoft.
Integration Strategy
IBM provides mainframe software such as containerized software, DevOps and operations management which are integrated with its server systems. Despite its expansion into software, consulting, and cloud, we believe this is its only product integration and it has not built up an ecosystem of integrated products and services. Moreover, its other segments such as software had stagnant growth of 1% and hardware’s revenue declined which we believe indicates its inability to successfully synergize the segments.
As covered in our previous analysis, Microsoft had established solid market leadership in office productivity with over 80% market share based on Gartner and we expect it to continue defending its lead with its comprehensive features and integrations with its other Microsoft products and competitive cost against competitors. Besides that, other examples of Microsoft’s integrations are:
- Integration between Windows and Microsoft through Office Hub for easier access to documents
- It developed the cloud-based Dynamics 365 in 2016 which is integrated with Power Platforms, Teams and SharePoint.
- In Gaming, Microsoft focused on its gaming segment with its gaming subscription in 2017 integrated with Windows.
- It also acquired companies such as LinkedIn in 2016 and integrated them with its Dynamics 365 and the Office suite.
Thus, we believe Microsoft, with its ecosystem with integrated productivity & HR software, gaming and LinkedIn is stronger compared to IBM (only hardware and software) and we believe it supports its growth outlook. In our previous analysis, we saw that Microsoft was the only company out of the top 3 software companies (IBM and Oracle) which had above industry 7-year average revenue growth (7.9%).
Cloud Strategy
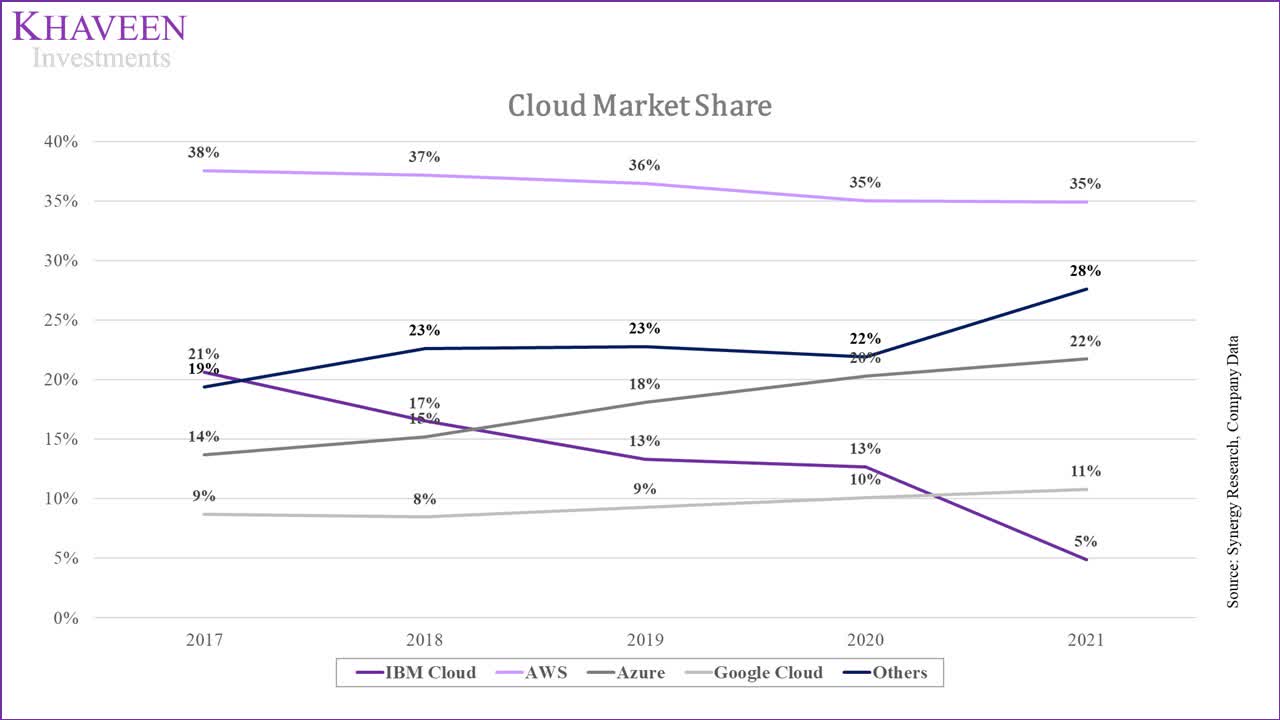
Microsoft entered the cloud market with the launch of Azure in 2010, followed by IBM in 2011. Although both entered roughly similar periods, we compared both companies’ cloud strategies based on a comparison of their market share & revenue growth, number of availability zones, features and number of users.
Synergy Research, Company Data, Khaveen Investments
|
Cloud Service Providers |
Average 5-years Revenue Growth |
|
IBM Cloud |
3.1% |
|
AWS (AMZN) |
37.5% |
|
Azure |
57.2% |
|
Google Cloud (GOOG) |
47.5% |
|
Alibaba Cloud (BABA) |
51.9% |
Source: Synergy Research, Company Data, Khaveen Investments
Based on the chart and table above, Microsoft had strengthened its cloud market share with the highest average revenue growth (57.2%) in the past 5 years to catch up with market leader AWS which had a lower growth (37.5%). In comparison, IBM had the lowest growth among its competitors at only 3.1%. As highlighted in our previous analysis, IBM had divested its public cloud business (Kyndryl) and focused on its hybrid cloud business following its RedHat acquisition in 2019. That said, based on the data, we believe Microsoft had strengthened its positioning in the cloud market and could provide it with an advantage over IBM.
|
Company |
Microsoft |
IBM |
|
Cloud Users |
550 mln |
0.0038 mln |
|
Growth % YoY |
10% |
35% |
|
Type of Users |
Companies, Individuals |
Companies |
To understand the rise of Microsoft’s cloud business vs IBM, we looked into the user bases of each company. Compared to Microsoft, IBM specifically targets companies while Microsoft targets both companies and individuals with its cloud. Microsoft had 500 mln active monthly users, on Azure Directory compared to 3,800 clients for IBM. However, IBM had a higher growth rate of 30% YoY than Microsoft at 10%.
|
Company |
Availability Zones |
Number of Features |
Pricing |
|
IBM |
19 |
43 |
$71.27 |
|
AWS |
84 |
60 |
$154.50 |
|
Microsoft |
66 |
70 |
$152.60 |
|
|
88 |
90 |
$116.10 |
Source: Source: IBM, AWS, Microsoft, Google, GetApp, Khaveen Investments
To compare the reach of their cloud services globally, we examined the number of availability zones by each company in the table above from our previous analysis of Oracle (ORCL). As seen in the table, Microsoft is third with 66 availability zones behind AWS and Google. However, Microsoft was still more than 3 times higher than IBM Cloud. Microsoft had announced its planned data center expansions across the US in Georgia and Texas and across the globe in Israel and Malaysia.
To determine the competitiveness of their cloud services, we examined the features and compared them with each company. Based on the table, IBM has the least number of features (43) according to GetApp while Microsoft Azure has 70 features, the second-highest behind Google Cloud Platform with the most features (90).
Furthermore, we also compared their cloud pricing to determine the competitiveness of their cloud services. As seen in the table, Azure has the second most expensive pricing behind AWS based on its online website cost estimator (2 virtual CPUs and 8GB of RAM running on Windows OS). In comparison, IBM’s pricing ($71.29) is the lowest among competitors and has pricing below the average of $123.62 which we believe indicates its pricing advantage.
To sum it up, we believe Microsoft’s cloud strategy had been superior to IBM’s due to its superior market share, growth, availability zones and a wider user base despite IBM’s higher user growth and competitive pricing.
Overall
We believe Microsoft edges out IBM in the Strategy factor by being the superior company in Product Innovation, Diversification, Integration and Cloud strategies. However, we believe IBM is better in terms of the Acquisition strategy.
|
Strategy |
Advantage |
|
Product Innovation |
Microsoft |
|
Diversification |
Microsoft |
|
Acquisition |
IBM |
|
Integration |
Microsoft |
|
Cloud |
Microsoft |
|
Overall |
Microsoft |
Source: Khaveen Investments
Financials
To compare the differences between Microsoft and IBM based on their financials, we looked at their diversification, revenue growth, profitability, efficiency and credit position.
Diversification
|
Industries (Growth Rate) |
Microsoft |
Average Revenue Growth |
Revenue Breakdown % |
IBM |
Average Revenue Growth |
Revenue Breakdown % |
|
IT Services (12.4% CAGR) |
Server products |
22.6% |
31.3% |
Internet Services & Infrastructure |
26.0%** |
15.2% |
|
Enterprise Services |
4.2% |
4.1% |
IT Consulting & Other Services |
1.4% |
31.1% |
|
|
Software (5.78% CAGR) |
Office products |
10.8% |
23.7% |
Software |
-0.1% |
26.9% |
|
Windows |
5.8% |
13.8% |
||||
|
Dynamics |
14.8% |
2.3% |
||||
|
Entertainment (8.3% CAGR) |
Gaming |
11.4% |
9.1% |
|||
|
Interactive Media & Services (8.4% CAGR) |
|
25.1%* |
6.1% |
|||
|
Media (15% CAGR) |
Search advertising |
9.6% |
5.1% |
|||
|
Technology Hardware, Storage & Peripherals (8.76% CAGR) |
Devices |
-0.9% |
4.0% |
Technology Hardware, Storage & Peripherals |
-2.3%** |
24.7% |
|
Others |
Other |
8.7% |
0.4% |
Others |
-0.9% |
2.1% |
|
Total |
13.1% |
100.0% |
-5.7% |
100.0% |
*3-year average
**1-year average
Source: Microsoft, IBM, The Business Research Company, Statista, Khaveen Investments
Firstly, we compiled and compared their revenue streams based on GICs classification. Based on the table, Microsoft’s revenues are split across 6 industries namely IT Services, software, entertainment, interactive media & services, media, technology hardware, storage & peripherals. Whereas IBM’s revenue streams are more concentrated as it is only split across 3 industries (IT Services, software, technology hardware, storage & peripherals). Moreover, Microsoft has more segments (9) compared to IBM (4).
The largest segment for Microsoft is Server products (31.3% of revenue) followed by Office products (23.7%) and Windows (13.8%). In comparison, IBM’s largest segment revenue contribution is similar to IT consulting (31% of revenue) and followed by software (27%). In terms of revenue growth, IBM’s Internet Services & Infrastructure segment was its fastest-growing segment (26%) and was higher than Microsoft’s Server products (22.6%). Though, IBM’s Internet Services & Infrastructure segment only accounted for 15% of the company’s revenue compared to Microsoft’s Server products segment (31% of revenue).
Also, 3 of Microsoft’s segments (Server products, LinkedIn, Dynamics) totaling 40% of revenue have above-average revenue growth (13.1%) compared to IBM which only has 2 segments (Internet Services & Infrastructure and IT Consulting) totaling 46% of revenue which grew above its total company average (-5.7%).
Thus, we believe that Microsoft has better diversification compared to IBM with a wider revenue exposure across more GICS industries than IBM and more segments. Microsoft’s fastest-growing segment’s revenue contribution is also twice that of IBM’s.

Microsoft, Khaveen Investments

IBM, Khaveen Investments
Revenue Growth
SeekingAlpha
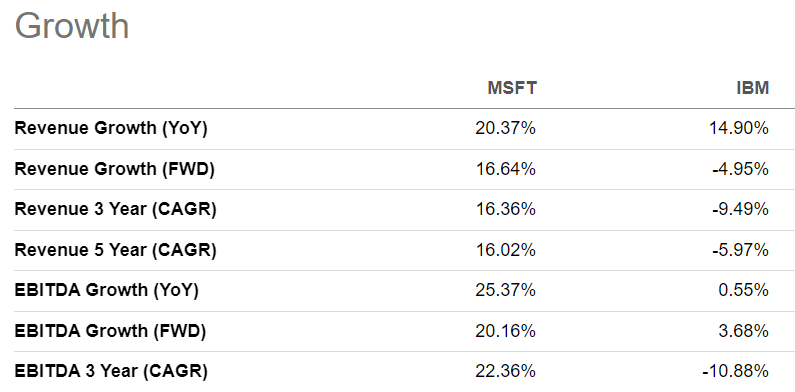
Furthermore, as seen in the tables above, Microsoft’s YoY revenue growth (20.37%) is higher than IBM’s (14.9%). Both companies’ revenue growth had been higher than their 5-year averages, but Microsoft’s 5-year CAGR (16.02%) had been superior to that of IBM (-5.97%). Based on our previous analyses, we forecasted Microsoft to have a higher 5-year forward average revenue growth of 21.5% compared to just 5% for IBM. Also, the company has higher current and 3-year average EBITDA growth than IBM. Therefore, we believe all the factors above point to Microsoft’s superior growth compared to IBM.
Profitability Analysis
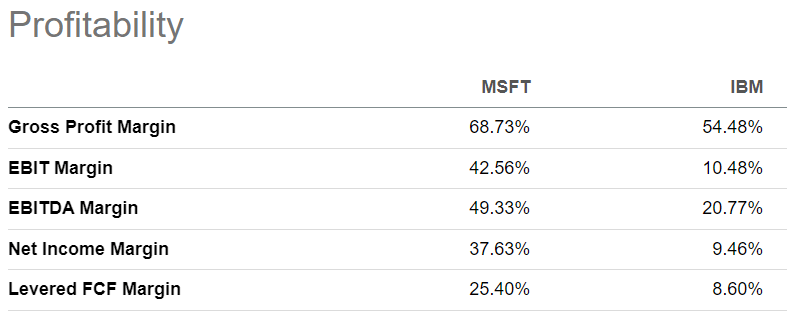
For the profitability comparison, we compared the companies in terms of their TTM gross, operating, EBITDA, net and FCF margins.
Seeking Alpha
Based on the table, IBM has remained profitable with positive average margins despite its revenue decline. Notwithstanding, Microsoft has superior profit margins than IBM with higher gross, operating, EBITDA, net margins and FCF margins based on both current and a 5-year average.
More importantly, Microsoft’s margins have been improving with higher current margins than its 5-year averages for its gross, operating, EBITDA, net margins and FCF margins. Whereas for IBM, except for its gross margins, the rest of its margins have declined compared to its 5-year average. Therefore, we believe Microsoft clearly beats IBM with superior profitability.
Efficiency Analysis
SeekingAlpha
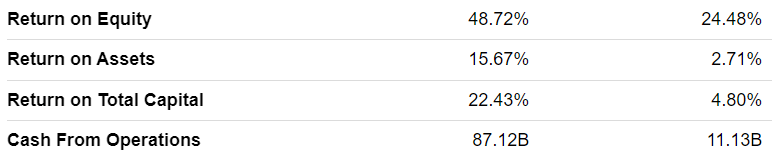
In terms of its efficiency, Microsoft has superior ROE, ROTC, and ROA to IBM. Though, Microsoft had higher capex/sales compared to IBM in both current and a 5-year average. Compared to IBM, Microsoft’s ROE, ROTC and ROA ratios have improved in the past 5 years while IBM had deteriorated due to the decline of its profitability margins. Additionally, Microsoft had a higher asset turnover ratio as well as cash from operations which highlights its superior efficiency.
Thus, we believe Microsoft has an advantage over IBM based on efficiency analysis with superior ratios to IBM and improving ratios compared to its 5-year average.
Credit Analysis
For credit analysis of both companies, we compared their net debt, interest coverage ratios, EBITDA/Net debt and Debt to Equity ratios.
|
Credit Ratios |
Microsoft |
IBM |
|
Net Debt ($ mln) |
46,372 |
101,800 |
|
Net Debt as % of Market Cap |
2.3% |
79.7% |
|
Debt/Equity (5-year Average) |
1.64x |
5.94x |
|
EBITDA interest coverage (5-year Average) |
406.1x |
16.5x |
|
FCF interest coverage (5-year Average) |
246.8x |
7.8x |
|
EBITDA/Net Debt (5-year Average) |
1.60x |
0.14x |
Source: Company Data, Khaveen Investments
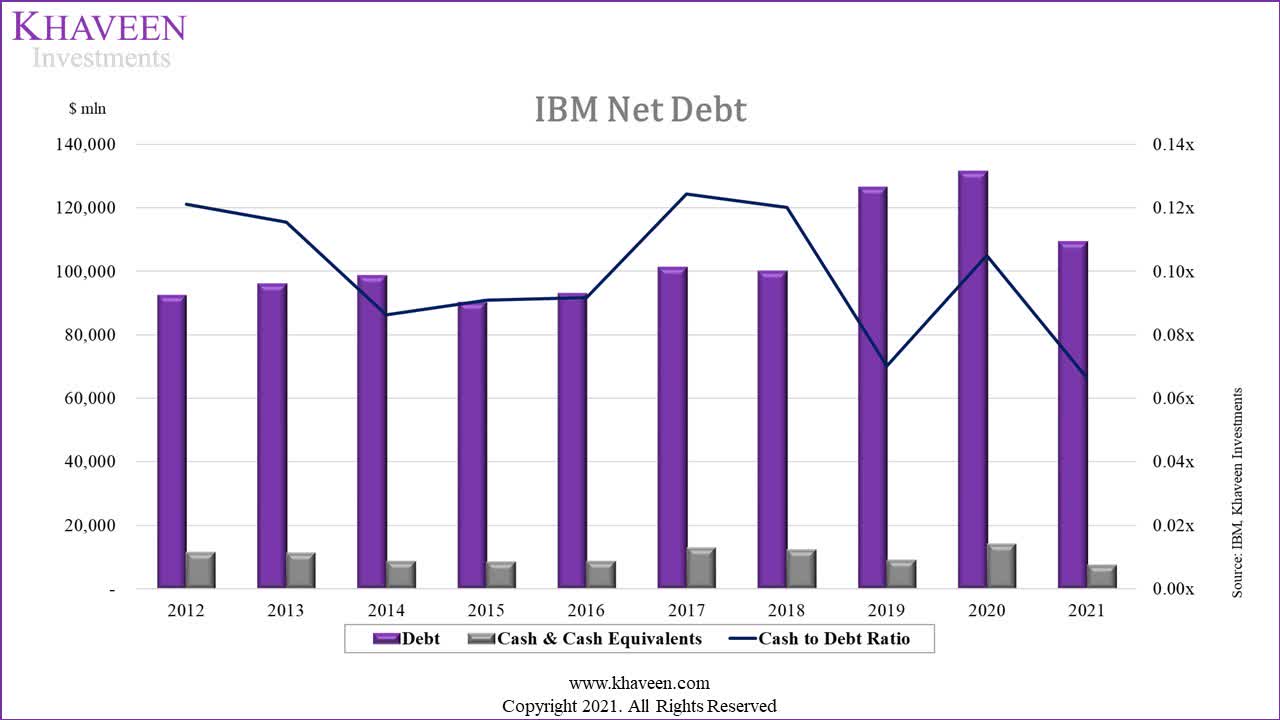
From the table, Microsoft has a lower net debt than IBM and lower net debt as a % of the market cap (2.3%) compared to IBM (79.7%). Also, Microsoft has a much lower debt/equity ratio of 1.64x than IBM (5.94x). In the charts below of their cash to debt ratios, both companies saw their ratios declining over the past 10 years. Notwithstanding, Microsoft continues to maintain a higher cash-to-debt ratio than IBM.
Moreover, Microsoft has superior coverage ratios compared to IBM which indicates its superior ability to service its debt obligations.

Microsoft, Khaveen Investments
IBM, Khaveen Investments
Source: IBM, Khaveen Investments
In the charts above of their cash to debt ratios, both companies saw their ratios declining over the past 10 years. Notwithstanding, Microsoft continues to maintain a higher cash-to-debt ratio than IBM. Therefore, we believe Microsoft has an advantage over IBM based on credit analysis, beating IBM on all 7 metrics we looked at.
Overall
We believe Microsoft has the overall advantage over IBM based on its financials as we determined it to have better diversification, revenue growth, profitability, efficiency and credit than IBM.
|
Financials |
Advantage |
|
Diversification |
Microsoft |
|
Revenue Growth |
Microsoft |
|
Profitability analysis |
Microsoft |
|
Efficiency analysis |
Microsoft |
|
Credit analysis |
Microsoft |
|
Overall |
Microsoft |
Source: Khaveen Investments
Valuation
Multiples
|
Ratios |
Microsoft Current |
Microsoft 5-year Average |
Upside |
IBM Current |
IBM 5-year Average |
Upside |
|
P/E |
26.5x |
34.4x |
16.0% |
25.14x |
18.48x |
-22.0% |
|
P/S |
9.9x |
9.4x |
-15.8% |
2.12x |
1.64x |
-41.0% |
|
P/FCF |
30.7x |
29.5x |
25.6% |
13.09x |
7.91x |
-54.6% |
|
Average |
9.5% |
-39.2% |
Source: SeekingAlpha, Company Data, Khaveen Investments
Based on the table above of the valuation multiples, all of Microsoft’s ratios (current) including P/E, P/S and P/FCF are higher than IBM. Moreover, based on a 5-year average, all of Microsoft’s valuation ratios are also higher than IBM indicating IBM’s better value compared to Microsoft.
However, when comparing each company’s current and 5-year average ratio, Microsoft’s PE (26.5x) ratio is below its 5-year average (34.4x) while the other ratios are higher than its 5-year average. Whereas all of IBM’s ratios are above its 5-year average. Based on their ratios, we obtained an upside of 9.5% for Microsoft and -39.2% for IBM.
Therefore, we believe that despite IBM’s better value compared to Microsoft with its lower current and 5-year average ratios, Microsoft edges out IBM with its higher upside than IBM as its P/E and P/FCF ratios (current) are lower than its 5-year averages while IBM’s ratios are above its 5-year average
Ratings
|
Ratings |
Microsoft |
IBM |
|
DCF Rating |
Strong Buy |
Sell |
|
DCF Upside |
114.4% |
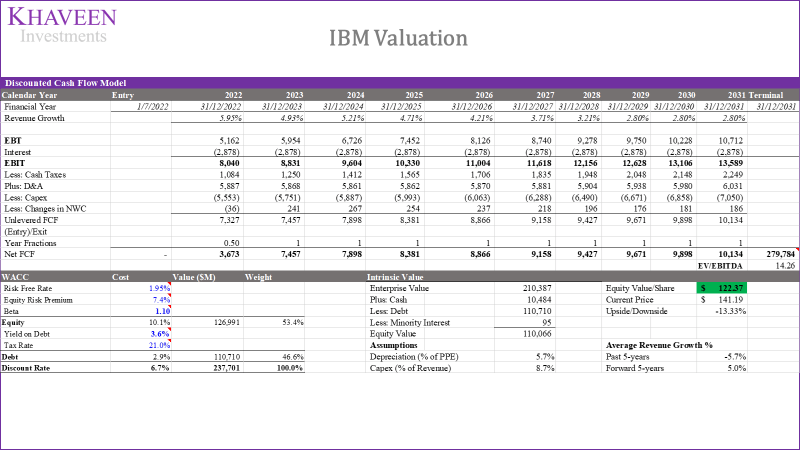
-13.3% |
|
DCF Price Target |
$550.55 |
$122.37 |
|
Analyst Consensus Rating |
Strong Buy |
Hold |
|
Analyst Consensus Upside |
39.3% |
1.6% |
|
Analyst Consensus Price Target |
$357.85 |
$143.50 |
Source: SeekingAlpha, Company Data, Khaveen Investments
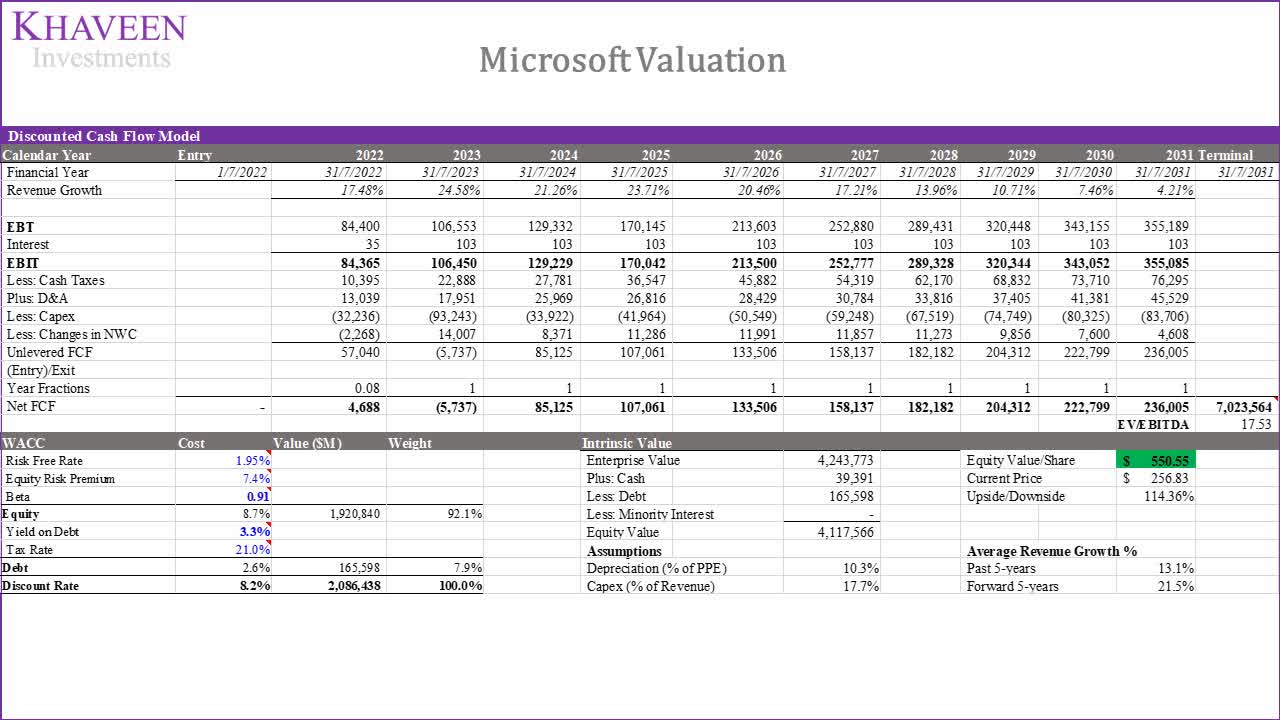
Based on the table above, we derived a DCF upside of 114% for Microsoft and rated it as a Strong Buy whereas for IBM we obtained a 13.3% downside and rated it as a Sell. With reference to analyst consensus estimates, Microsoft was rated as a Strong Buy with a 39.3% upside compared to IBM at only a Hold with a 1.6% upside. Thus, we believe Microsoft is clearly superior to IBM with a higher rating from DCF and analyst consensus.
Khaveen Investments
Khaveen Investments
Investment Returns
|
Company |
5-year Stock Return |
Annualized Return |
Dividend Yield |
Total Annual Return |
|
Microsoft |
275.54% |
30.2% |
0.96% |
31.16% |
|
IBM |
-5.78% |
-0.89% |
4.77% |
3.88% |
Source: Seeking Alpha, Company Data, Khaveen Investments
Finally, we compared the investment returns based on the past 5 years between Microsoft and IBM and computed its annualized return and calculated the total return with its dividend yield. Overall, Microsoft (31.16%) has a higher annualized total return than IBM (3.88%) which highlights its advantage
Overall
To sum it up, based on the multiples, ratings and investment returns, we believe Microsoft edges out IBM with its Strong Buy ratings based on DCF and analyst consensus and higher investment return compared to IBM.
|
Valuation |
Advantage |
|
Multiples |
Microsoft |
|
Ratings |
Microsoft |
|
Investment Returns |
Microsoft |
|
Overall |
Microsoft |
Source: Khaveen Investments
Risk: Dividend Growth
IBM

SeekingAlpha
We believe the risk for the long/short strategy between Microsoft and IBM is its high dividend yield. IBM had a dividend yield of 4.77%, which is one of the considerations for shorting the stock. IBM’s dividend growth was 0.77% as seen above. However, IBM’s dividend growth had continuously slowed in the past 10 years from a 10-year CAGR of 8.17% to 3.6% (5-year) and 2.42% (3-year), which reduces the probability of much higher dividend payments going forward.
Verdict
|
Factor |
Advantage |
|
Product Innovation |
Microsoft |
|
Diversification |
Microsoft |
|
Acquisition |
IBM |
|
Integration |
Microsoft |
|
Cloud |
Microsoft |
|
Strategy Factor |
Microsoft |
|
Diversification |
Microsoft |
|
Revenue Growth |
Microsoft |
|
Profitability analysis |
Microsoft |
|
Efficiency analysis |
Microsoft |
|
Credit analysis |
Microsoft |
|
Financials Factor |
Microsoft |
|
Multiples |
Microsoft |
|
Ratings |
Microsoft |
|
Investment Returns |
Microsoft |
|
Valuation Factor |
Microsoft |
|
Overall |
Microsoft |
Source: Khaveen Investments
To summarize, we determined that Microsoft is superior to IBM for the Strategy factor based on their strategies as we believe its product innovation, diversification, integration and cloud strategy to be superior to IBM. Moreover, we also determined its superior financials based on diversification, revenue growth, profitability, efficiency and credit. Finally, we determined Microsoft comes up on top for the Valuation factor considering its upside based on multiples, DCF and higher investment returns. We determined our long/short strategy by taking into account its dividend yield, borrow fee (between 0.3% to 3%) and short sale proceeds interest of 0%.
|
Case |
Stock |
Upside |
Div Yield |
Gross Return |
Avg Borrow Fee |
Int |
Net Return |
Weight |
Net Return |
|
Our Case |
MSFT |
114.4% |
1.0% |
115.3% |
115.3% |
81.3% |
94.99% |
||
|
IBM |
-13.3% |
4.8% |
-8.6% |
1.7% |
0% |
6.9% |
18.8% |
||
|
Base Case |
MSFT |
16.10% |
0.96% |
17.06% |
17.06% |
81.25% |
34.25% |
||
|
IBM |
-16.42% |
4.77% |
-11.65% |
1.65% |
0% |
10.00% |
18.75% |
||
|
Bear Case |
MSFT |
16.10% |
0.96% |
17.06% |
17.06% |
81.25% |
15.74% |
||
|
IBM |
-16.42% |
4.77% |
-11.65% |
1.65% |
0% |
10.00% |
18.75% |
||
|
Bull Case |
MSFT |
60.0% |
1.0% |
61.0% |
61.0% |
81.3% |
54.1% |
||
|
IBM |
17.6% |
4.8% |
22.3% |
1.7% |
0% |
24.0% |
18.8% |
Source: SA, IBKR, Khaveen Investments
To determine the appropriate weights for the trade, we computed a sensitivity analysis based on the different scenarios and long-short weights. As seen in the chart below, long Microsoft (81% weight) and short IBM (19% weight) would generate the highest net return in all scenarios.

Khaveen Investments
Overall, we believe both Microsoft and IBM have contrasting fundamentals which provides a clear opportunity for a Long-Short trade. While IBM was the old leader of the IT sector, Microsoft has emerged as the new dominant player with a clear-cut advantage owing to its superior product innovation, diversification, integration, cloud strategies as well as solid financials and attractive valuation. Thus, we believe a long/short strategy can be implemented on this pair of stocks, and carry a Strong Buy rating on Microsoft and a Sell rating on IBM.
Be the first to comment