

MicroStockHub/iStock via Getty Images
Chart created by writer from C Trader
With Microsoft’s (NASDAQ:MSFT) latest break of $246 adding further confirmation that this is possibly no flash lower low, we will be looking at Microsoft’s three wave structure potentially to $190 in this article.
Given that third waves can fail to replicate their wave one, I prefer to have as much evidence as possible before charting a third wave higher or lower. In this case it came with the break below $246, technically the third wave south had already commenced by the break of $270 but to add credence to it not being just a dip into a new low I look to work back through the timeframes and find waves within waves to further the probability of wave three numerically replicating wave one.
Microsoft Monthly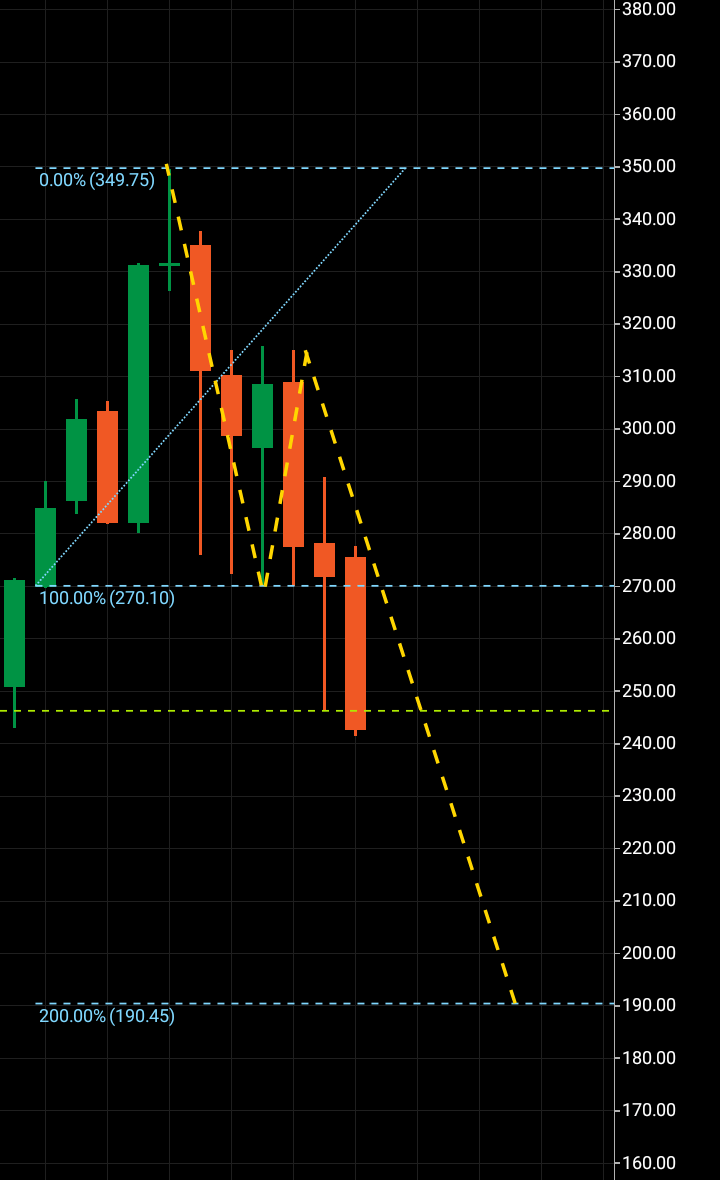
We can see here on the monthly chart Microsoft initially topping at $349 before somewhat reluctantly bottoming to form the macro wave one at $270. It then encountered immediate bullish action moving to top out at $315 forming the now macro wave two. Still in a bullish structure even with the steep drop to the doorstep of support before eventually giving up the ghost and technically forming the third wave downwards. A break below $270 followed by a drop to $246 before rising again above support. It is now the re break of the $246 region we will focus on by moving to the weekly timeframe.
Microsoft Weekly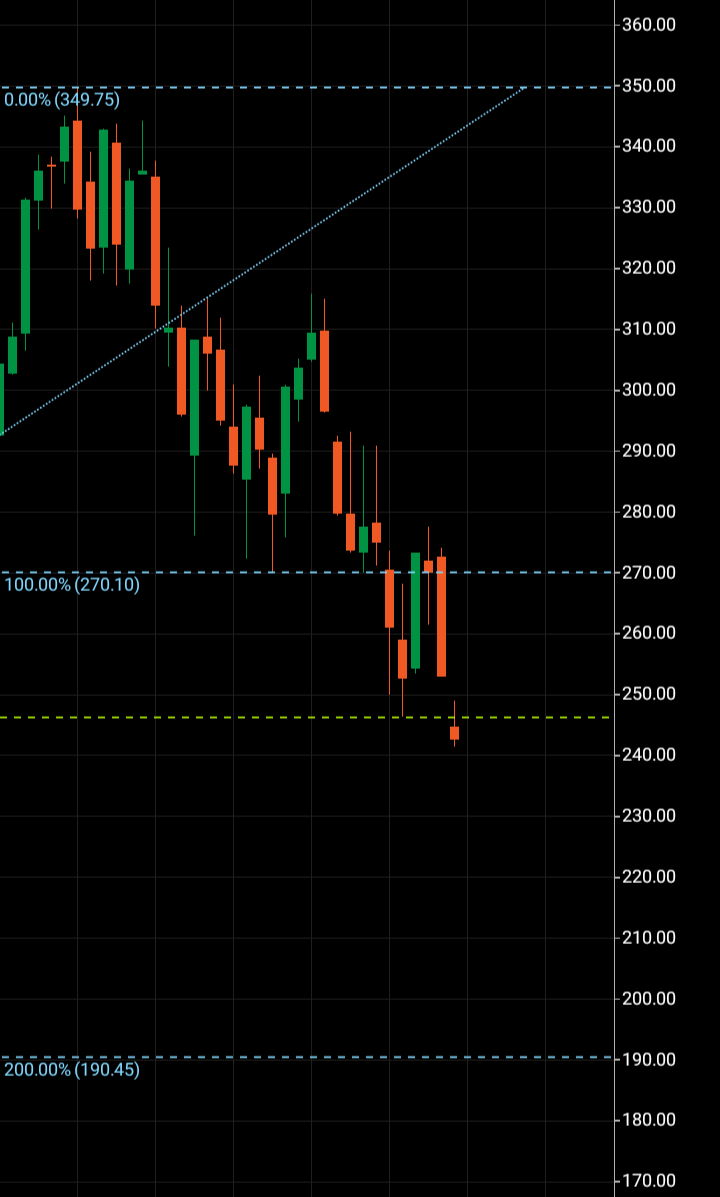
We can now see the break below $246 forming a new wave on the weekly timeframe. Formally in a potentially bullish structure on the weekly if Microsoft had chosen to break above $280 immediately, a new third wave on the could have seen a challenge for the macro wave two high of $315. Instead, an immediate break of $246 it was, with a move to newer lows towards $190 potentially an imminent favorable path.
Overall Microsoft is in a macro third wave with its break of $270 with the new low giving more printed information as to its next immediate direction. I would expect Microsoft to complete its third wave and land at $190 within the next 90-120 days. It is possible the third wave could go lower in this case we only have the evidence of the wave one bearing as a target. I will be looking for reversal patterns if the third wave completes at the target region.
About the Three Wave Theory
The three wave theory was designed to be able to identify exact probable price action of a financial instrument. A financial market cannot navigate its way significantly higher or lower without making waves. Waves are essentially a mismatch between buyers and sellers and print a picture of a probable direction and target for a financial instrument. When waves one and two have been formed, it is the point of higher high/lower low that gives the technical indication of the future direction. A wave one will continue from a low to a high point before it finds significant enough rejection to then form the wave two. When a third wave breaks into a higher high/lower low the only probable numerical target bearing available on a financial chart is the equivalent of the wave one low to high point. It is highly probable that the wave three will look to numerically replicate wave one before it makes its future directional decision. It may continue past its third wave target, but it is only the wave one evidence that a price was able to continue before rejection that is available to look to as a probable target for a third wave.
Be the first to comment