

vzphotos
Introduction
My thesis is that Micron’s (NASDAQ:MU) valuation is tricky. The industry is cyclical, technology changes are hard to model, and the rationality of competitors is difficult to predict.
Dynamic random access memory (“DRAM”) accounts for nearly three-fourths of Micron’s fiscal 2022 revenue whereas NAND, which is short for “NOT AND” and is also called flash, accounts for about one-quarter. The Chip War book by Chris Miller explains that Japan’s DRAM companies consolidated to form Elpida. Micron then acquired Elpida in 2013. Along with Micron, Samsung (OTCPK:SSNLF) and SK Hynix (OTC:HXSCF) from South Korea are the key DRAM companies today.
Chip War gives an overview of the competitive landscape for NAND:
The market for NAND, the other main type of memory chip, is also Asia-centric. Samsung, the biggest player, supplies 35 percent of the market, with the rest produced by Korea’s Hynix, Japan’s Kioxia, and two American firms – Micron and Western Digital.
[Kindle Location: 2,799]
The Numbers
A tweet from @Maverick_Equity and @JoinCommonstock reminds us of the timeless valuation considerations Berkshire Hathaway (BRK.A) (BRK.B) CEO Warren Buffett wrote about in his 1993 letter to shareholders. An investor needs to end up with at least as much purchasing power as there was at the start, plus a modest rate of interest on the initial stake. I like to use the five primary factors which are given in this letter as:
1) The certainty with which the long-term economic characteristics of the business can be evaluated;
2) The certainty with which management can be evaluated, both as to its ability to realize the full potential of the business and to wisely employ its cash flows;
3) The certainty with which management can be counted on to channel the rewards from the business to the shareholders rather than to itself;
4) The purchase price of the business;
5) The levels of taxation and inflation that will be experienced and that will determine the degree by which an investor’s purchasing-power return is reduced from his gross return.
We need to understand Micron’s history in order to make judgments about valuation factor #1 above, the long-term economic characteristics of the business. Based in Idaho where land and electricity are cheaper than the Bay Area and Japan, Micron has an ethos of keeping costs low and this long standing consideration should continue. Chip War explains that Micron simplified the manufacturing process by learning to use fewer production steps and less equipment than competitors:
The more steps in manufacturing, the more time each chip took to make and the more room for errors. By the mid-1980s, Micron used far fewer production steps than its competitors, letting the company use less equipment, cutting costs further. They tweaked the lithography machines they bought from Perkin Elmer and ASML to make them more accurate than the manufacturers themselves thought possible. Furnaces were modified to bake 250 silicon wafers per load rather than the 150 wafers that was industry standard. Every step of the fabrication process that could handle more wafers or reduce production times meant lower prices. “We were figuring it out on the fly,” one early employee explained, so unlike other chipmakers, “we were prepared to do things that hadn’t been written in a paper before.” More than any of its Japanese or American competitors, the engineering expertise of Micron’s employees was directed toward cost cuts.
[Kindle Location: 1,721]
The 2022 Investor Day presentation shows that although the auto market demand for DRAM and NAND is relatively small at this time, this area should have the highest compound annual growth rate (“CAGR”) in the coming years at 40% for DRAM and 49% for NAND. It is hard to estimate the importance of this demand growth, as we don’t know how rapidly various auto companies will invest in self-driving. I believe full autonomy may take a while, but investments in automation are underway and BMW talked about advanced driver assistance systems (“ADAS”) at Micron’s 2022 Investor Day. There is a lot of guesswork and uncertainty with the 40% and 49% auto CAGR estimates below, but it is an exciting area of growth:
Micron markets (2022 Investor Day presentation)
A company is worth the amount of cash that can be pulled out from now until judgment day. This has to be discounted back to present value, and of course, interest rates are a factor. Ostensibly, stock-based compensation (“SBC”) isn’t part of free cash flow, but I like to treat it like cash seeing as management must buy back shares with cash to offset it. As such, my adjusted free cash flow (“FCF”) figure is lower than the figure given to us by management. The May 2022 Investor Day presentation gives us FCF from FY-11 to FY-21 on slides 88 and 89, and I adjusted by treating SBC as a cash expense. I then used the same framework for FY-12 from the numbers in the 4Q22 press release results:
Micron financials (Author’s spreadsheet)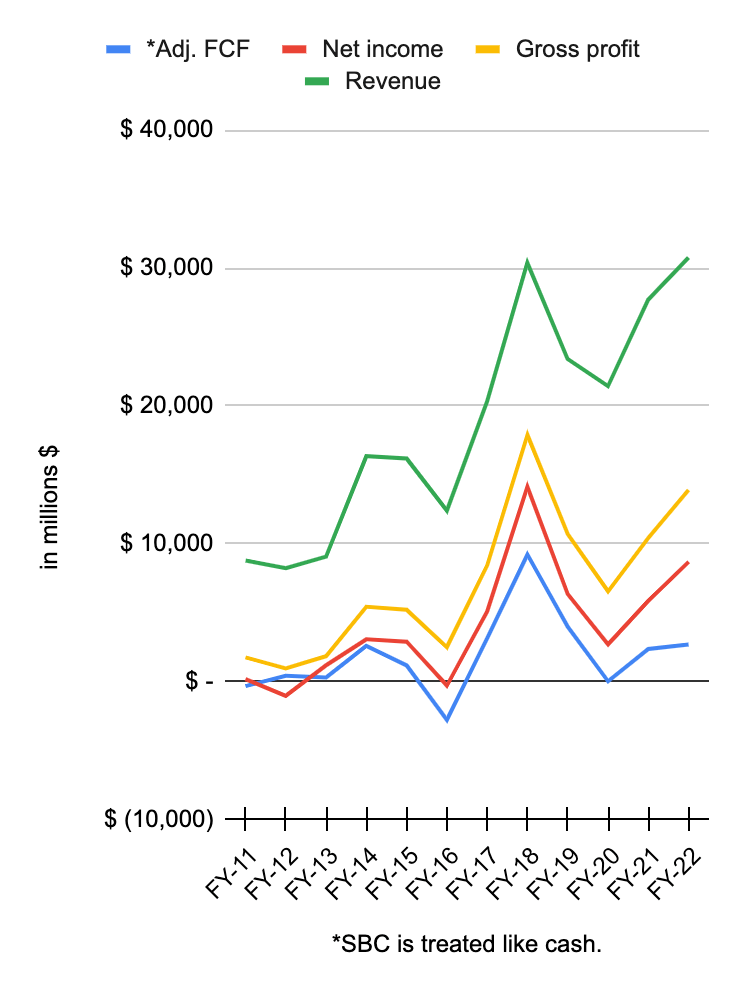
The 11-year revenue CAGR above from fiscal 2011 to fiscal 2022 was a little over 12%.
Including the SBC consideration, the above shows that adjusted FCF from the last 12 years has been a cumulative $22.9 billion. These historical numbers are a nice data point, but we care about the windshield view as opposed to the rear-view mirror view.
The fiscal 2018 number is elevated. Looking at the fiscal 2018 10-K, we see fiscal 2017 revenue of $10,388 million from China and $2,763 million from the US for a sub total of $13,151 million. It shows fiscal 2018 revenue of an elevated $17,357 million from China and $3,624 million from the US for an increased sub total of $20,981 million. The FY19 10-K shows that the fiscal 2019 sub total breakdown went back down to the fiscal 2017 level, but the country breakdown is different where $3,595 million of the fiscal 2019 revenue came from China and $12,451 million came from the US for a sub total of $16,046 million. Again, the cumulative revenue from the US and China excluding Hong Kong went from $13,151 million in fiscal 2017 up to $20,981 million in fiscal 2018 and then down to $16,046 million in fiscal 2019.
Slide 11 of Micron’s 2022 Investor Day presentation shows that industry profitability has strengthened such that gross margins have climbed from the 20% level for the calendar 2006 to 2013 timeframe to the 40% level for the calendar 2014 to calendar 2021 timeframe:
DRAM industry (2022 Investor Day presentation)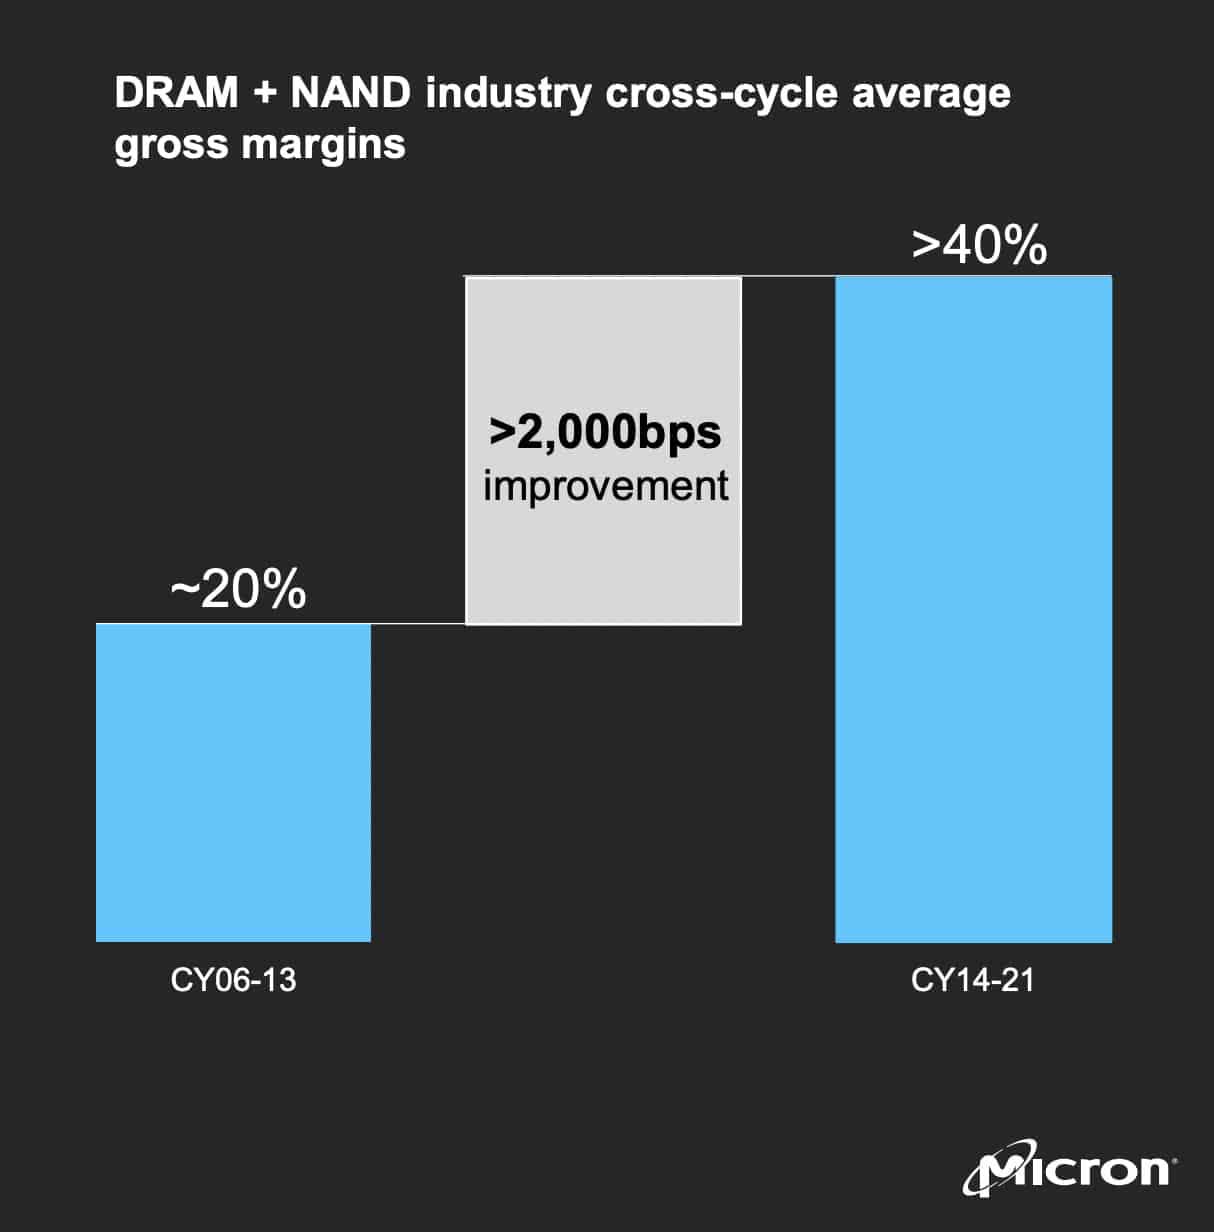
Micron’s fiscal years end a quarter before the calendar year, so this is kind of apples and oranges, but their overall gross margins lagged the industry DRAM/NAND gross margins until recently. Micron’s overall gross margins from fiscal 2014 to fiscal 2021 averaged out to 35% while industry gross margins for calendar 2014 to 2021 were above 40% per the slide above. This is a cyclical business, and we see Micron’s pricing was elevated from fiscal 2017 to fiscal 2019 where net margins were 25%, 47% and 27% respectively and gross margins were 42%, 59% and 46%, respectively:
|
*Adj. FCF margin |
Net margin |
Gross margin |
|
|
FY-11 |
-4% |
2% |
20% |
|
FY-12 |
5% |
-13% |
12% |
|
FY-13 |
3% |
13% |
20% |
|
FY-14 |
16% |
19% |
33% |
|
FY-15 |
7% |
18% |
32% |
|
FY-16 |
-22% |
-2% |
20% |
|
FY-17 |
16% |
25% |
42% |
|
FY-18 |
30% |
47% |
59% |
|
FY-19 |
17% |
27% |
46% |
|
FY-20 |
0% |
13% |
31% |
|
FY-21 |
9% |
21% |
38% |
|
FY-22 |
9% |
28% |
45% |
|
*SBC is treated like cash. |
One of the wildest margin swings above was the adjusted FCF margin which was 16% in fiscal 2017 an unbelievable 30% in fiscal 2018 and 17% in fiscal 2019. CFO Mark Murphy said the following at the 2022 Investor Day presentation:
We expect over 10% free cash flow margin cross-cycle.
At the 2022 Investor Day presentation, CFO Murphy talks about lagging the industry with respect to gross margin in the past, but he says Micron is now ahead of the industry, and he thinks this is sustainable:
If I look at the slide deck today, this is a gross margin slide on gross margin relative to the industry, excluding Micron. This is a pretty impactful slide on momentum. And this highlights Micron’s execution and financial progress since 2016. Now there are a number of factors in this around manufacturing excellence and mix and so forth. But I think what’s important, because this is not only was the absolute margin improvement by Micron, this is a relative improvement by Micron to the rest of the industry, a 1,500 basis point improvement. That’s a remarkable achievement. But all of us and especially this audience is forward-looking. And I think the most exciting thing is when you look at the fundamentals and you look at Micron’s capabilities, those capabilities are self-reinforcing. So we think that this margin sustainability is durable. And that’s the important thing at this point. So with continued leadership, execution and disciplined investment, we would expect to maintain margin through cross cycle at the levels that we’re seeing.
Here is the gross margin slide from CFO Murphy with respect to Micron improving such that they no longer lag the industry:
Micron gross margin (2022 Investor Day presentation)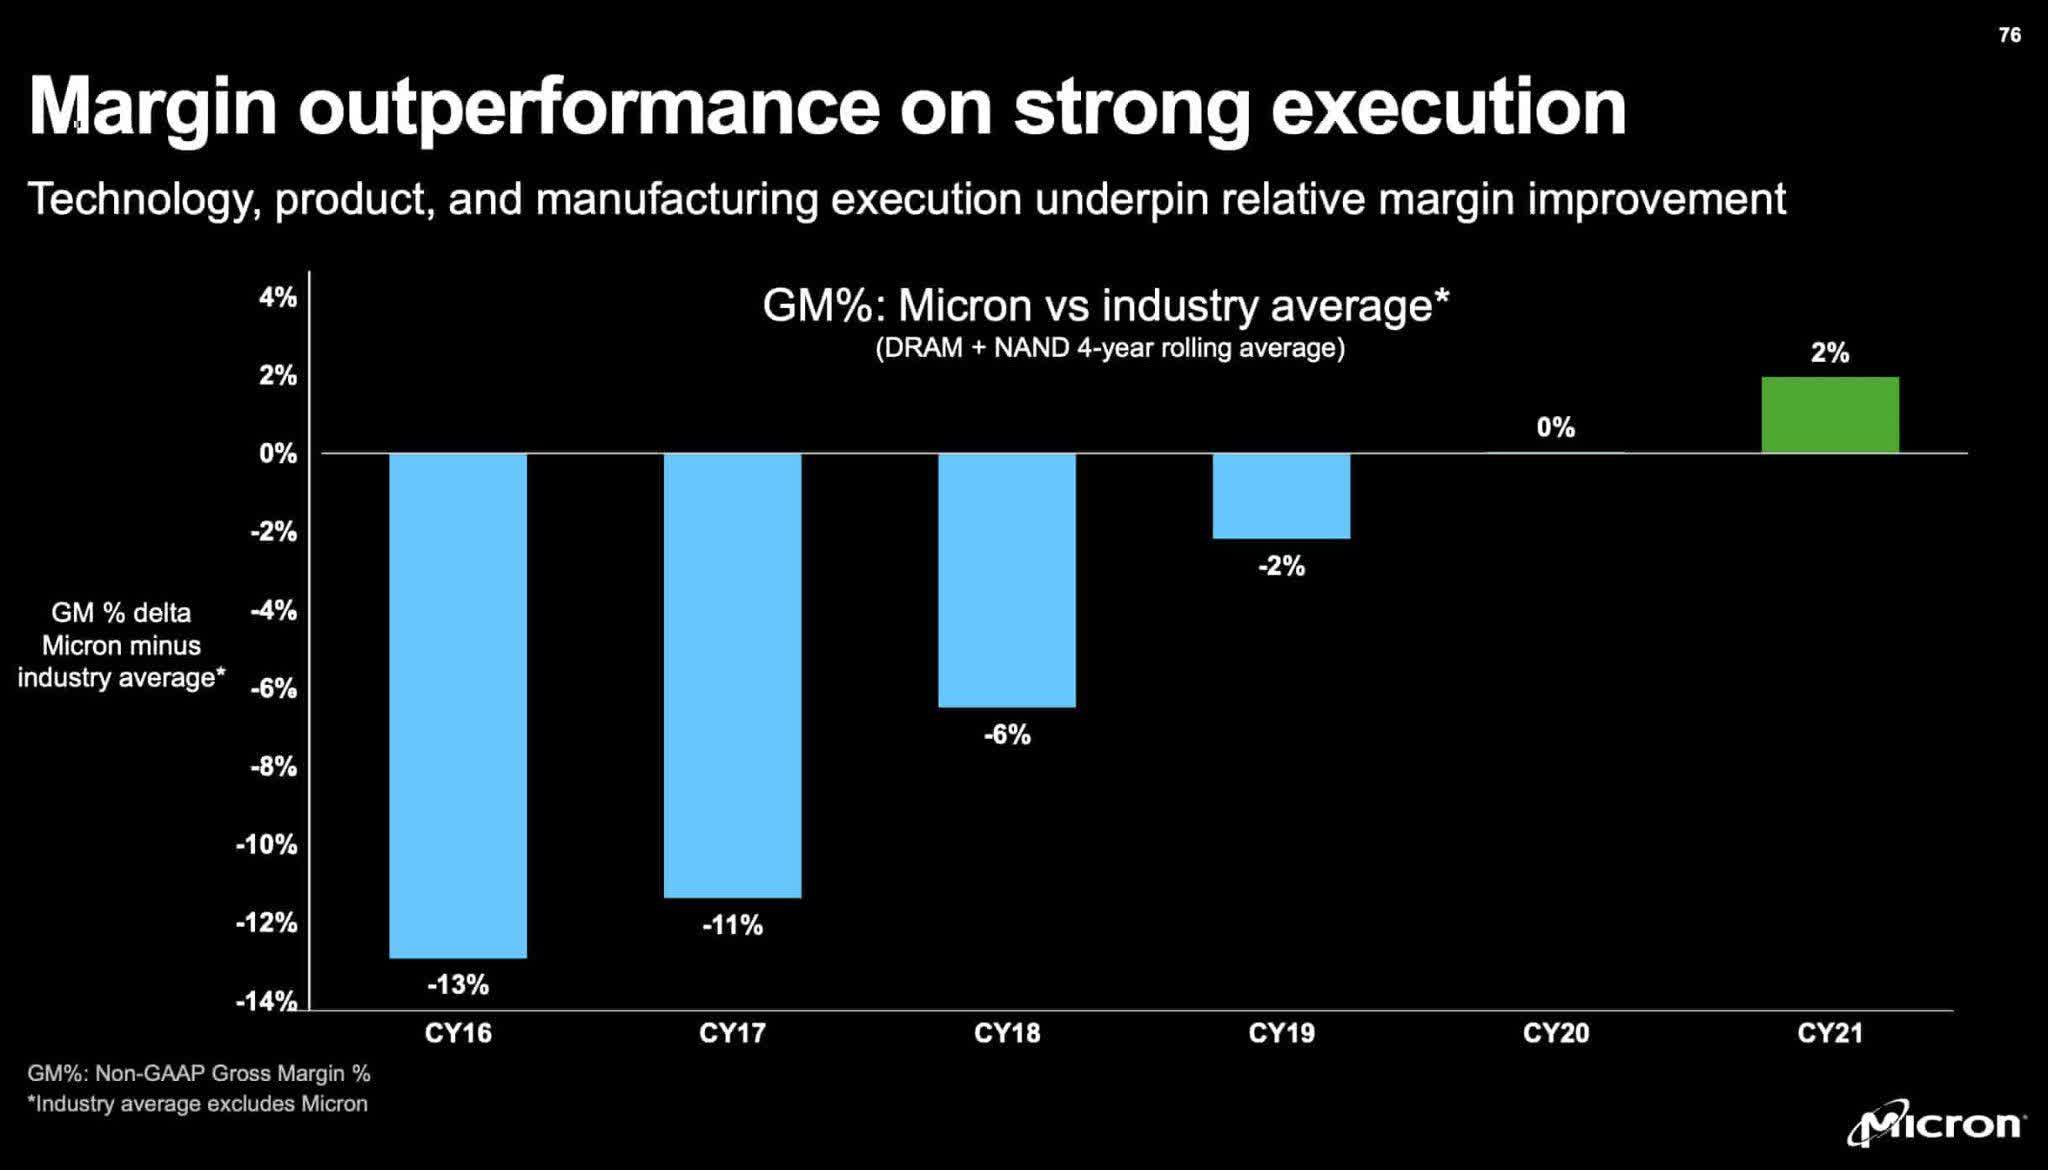
I agree with management that financials should be averaged out over 4-year periods to take some of the cyclicality out of the numbers. Adjusted FCF from fiscal 2019 to fiscal 2022 averaged out to $2.3 billion per year. Given the massive cyclical number we saw in fiscal 2018, the 5-year average for adjusted FCF from fiscal 2018 to fiscal 2022 is much higher at $3.7 billion. Looking at fiscal 2022 by itself, we had $2,691 million of adjusted FCF, which is a 9% margin from the $30,758 million in revenue.
Valuation consideration #2 above is management’s ability to wisely employ cash flows. The Chip War book says that American companies like Micron have been forced to stay on their toes in this respect. By contrast, Japan’s strategy of overinvestment in the 1980s was not sustainable:
Japan’s biggest semiconductor firms doubled down on DRAM production even as lower cost producers like Micron and South Korea’s Samsung undercut Japanese rivals. Japan’s own media perceived overinvestment in the semiconductor sector, with newspaper headlines warning of “reckless investment competition” and “investment they cannot stop.” CEOs of Japan’s memory chip producers couldn’t bring themselves to stop building new chip fabs, even if they weren’t profitable. “If you start worrying” about overinvestment, one Hitachi executive admitted, “you can’t sleep at night.” So long as banks kept lending, it was easier for CEOs to keep spending than to admit they had no path to profitability. America’s arm’s-length capital markets hadn’t felt like an advantage in the 1980s, but the risk of losing financing helped keep American firms on their toes. Japanese DRAM makers would have benefitted from Andy Grove’s paranoia or Jack Simplot’s wisdom about commodity market volatility. Instead, they all poured investment into the same market, guaranteeing that few made much money.
[Kindle Location: 2,161]
Micron has a long history of being shrewd with cash flows so as to not lose financing. I believe current management will continue to make rational decisions with respect to capital allocation decisions such as the right level for dividends as opposed to reinvestments in the business.
Looking at fiscal 2022, stock-based compensation (“SBC”) was $514 million, which was 1.7% of the $30,758 million revenue. I like to look at SBC as a percentage of revenue when thinking about valuation consideration #3 above, the propensity of managers to channel rewards to shareholders as opposed to themselves. The 1.7% is not overwhelmingly high relative to other tech companies, and I think management is not drastically out of line in this area.
Micron has economies of scale and know-how, which make it difficult for new competitors to emerge. Revenue grew at 12% annually from fiscal 2011 to fiscal 2022, and I think there is a good chance this will continue. I also think CFO Murphy is right about his margin assessment, such that we can see an average adjusted free cash flow margin of 10% moving forward. Inflation and interest rates have gone up in 2022 and these are considerations we have to weigh with respect to valuation factor #5 above, the levels of taxation and inflation. Given these considerations, I think it is reasonable to use a multiple in the neighborhood of 30x on the 4-year average adjusted FCF of $2.3 billion, a multiple in the neighborhood of 17x on the 5-year average adjusted FCF of $3.7 billion and a multiple of about 20x on the $2.7 billion adjusted FCF from fiscal 2022. This gives us valuations of $69 billion, $63 billion and $54. Taken together, the range here is almost $55 to $70 billion. Again, this range is tricky, especially because the long-term economics of the business are difficult to decipher.
The fiscal 2022 10-K shows that there were 1,087,168,584 shares outstanding as of September 30th. Multiplying this by the December 5th share price of $54.04 gives us a market cap of $58.8 billion. The enterprise value is a little bit below the market cap because debt and lease obligations aren’t completely offset by cash and equivalents.
The market cap is close to my valuation estimates, and I think the stock is reasonably valued.
Be the first to comment