

E_Y_E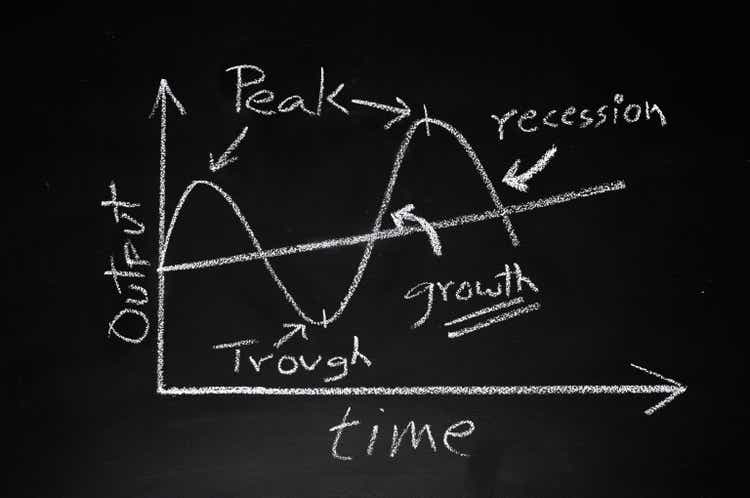
The investment thesis
We have a young kid and have created a small UTMA (Uniform Transfers To Minors) account for him. We have started buying Micron Technology, Inc. (NASDAQ:MU) shares lately around FW P/E of 7x in this account. Chip stocks like MU are, of course, notoriously cyclical and, therefore, not suitable for all accounts.
However, for accounts – like our UTMA account – that can wait out the near-term volatilities, the thesis here is that now is a good entry point. As argued in my earlier article, historically, chip-stock cycles (peak-to-peak and also bottom-to-bottom) typically have lasted around 4 years, and my reading is that we are currently at the beginning of the contraction phase. I expected the slump in business fundamentals to reach a bottom around late 2022 or early 2023. The trick, of course, is that the market is forever forward-looking. So, valuation always reaches its bottom before fundamentals. And, by the time the fundamentals reach the bottom, valuation has already expanded.
You can see such dynamics quite clearly from the chart below. The last time Micron’s valuation bottomed was around 2018, at a P/E of 2.7x. But its fundamentals did not reach the bottom till mid to late 2019, lagging the valuation bottom by about 10 months. If history, and more fundamentally, human nature is of any guidance, then I am expecting its current FW P/E of about 7.3x is near a cycle bottom already. It is far below the cycle average of 12.1x and close to one standard deviation below.
Next, we will see that: A) there are indeed volatilities ahead in the near term; but B) the stock is well poised to deliver a long-term annual return in the mid-teens from a combination of valuation expansion and fundamental recovery.
Author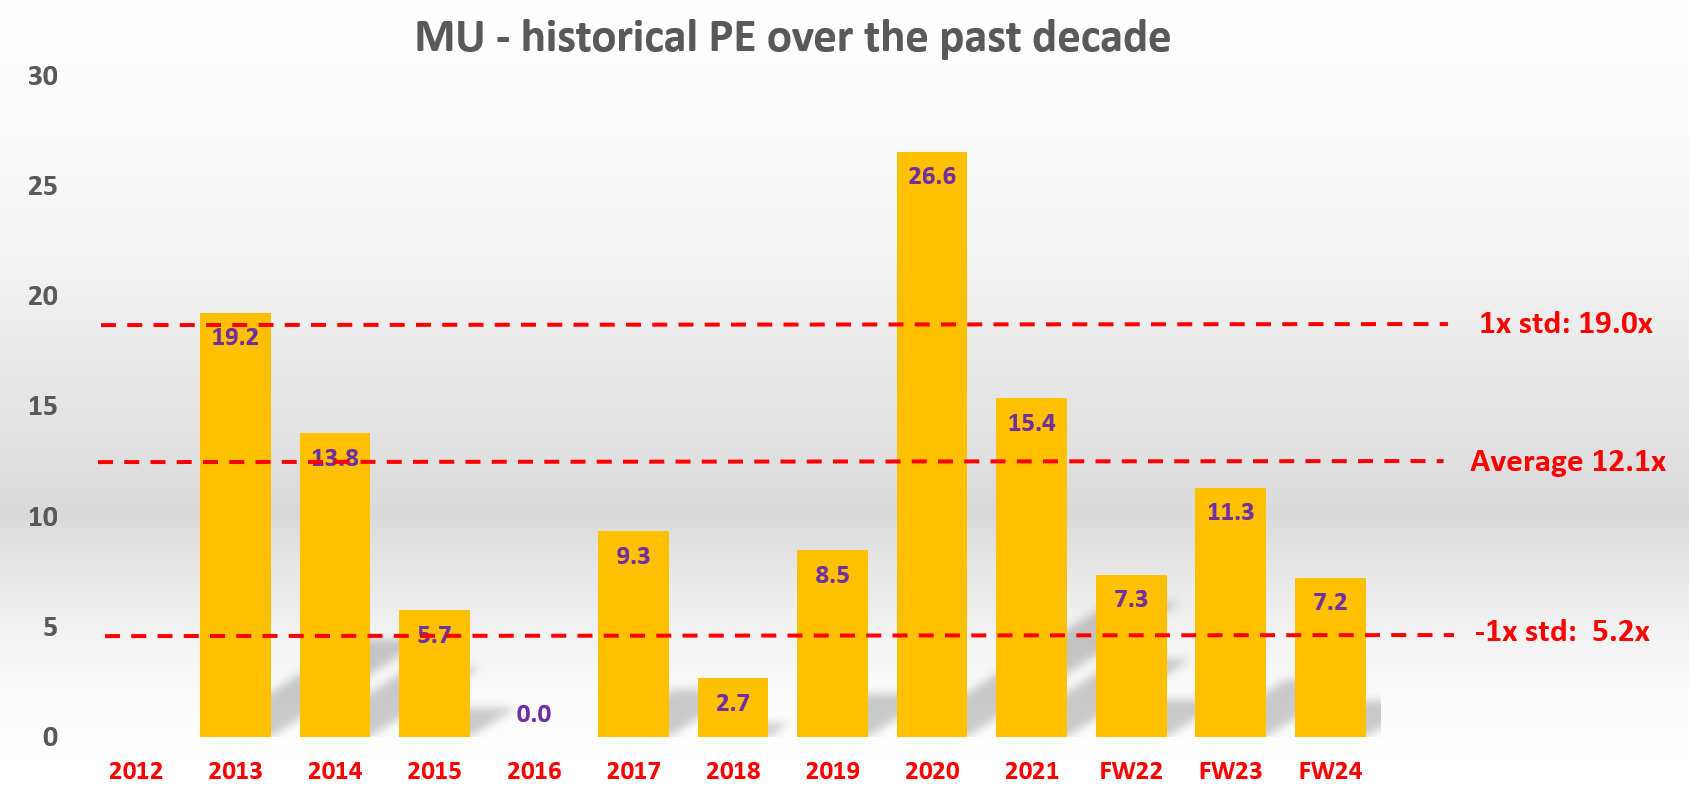
Our UTMA account holdings
Before diving into the details, a few quick words about our UTMA account in case it is of interest to you. More details can be found in our recent article or on this page from Fidelity (where our account is). To be brief, the key considerations for us to have such an account boil down to 3 buckets:
First and foremost, provide a nest egg for our son. Second, use it as an educational tool for him to learn investing and financial responsibility (it is a wish and we will see how it goes when he is old enough). And finally, it offers some tax advantages and the time horizon to accommodate more aggressive investment ideas like MU.
Our current holdings are listed below. A few notes:
- Due to the relatively small size of our account and the time horizon, we hold an even more concentrated portfolio than our other accounts. You should tailor your diversification and exposure accordingly.
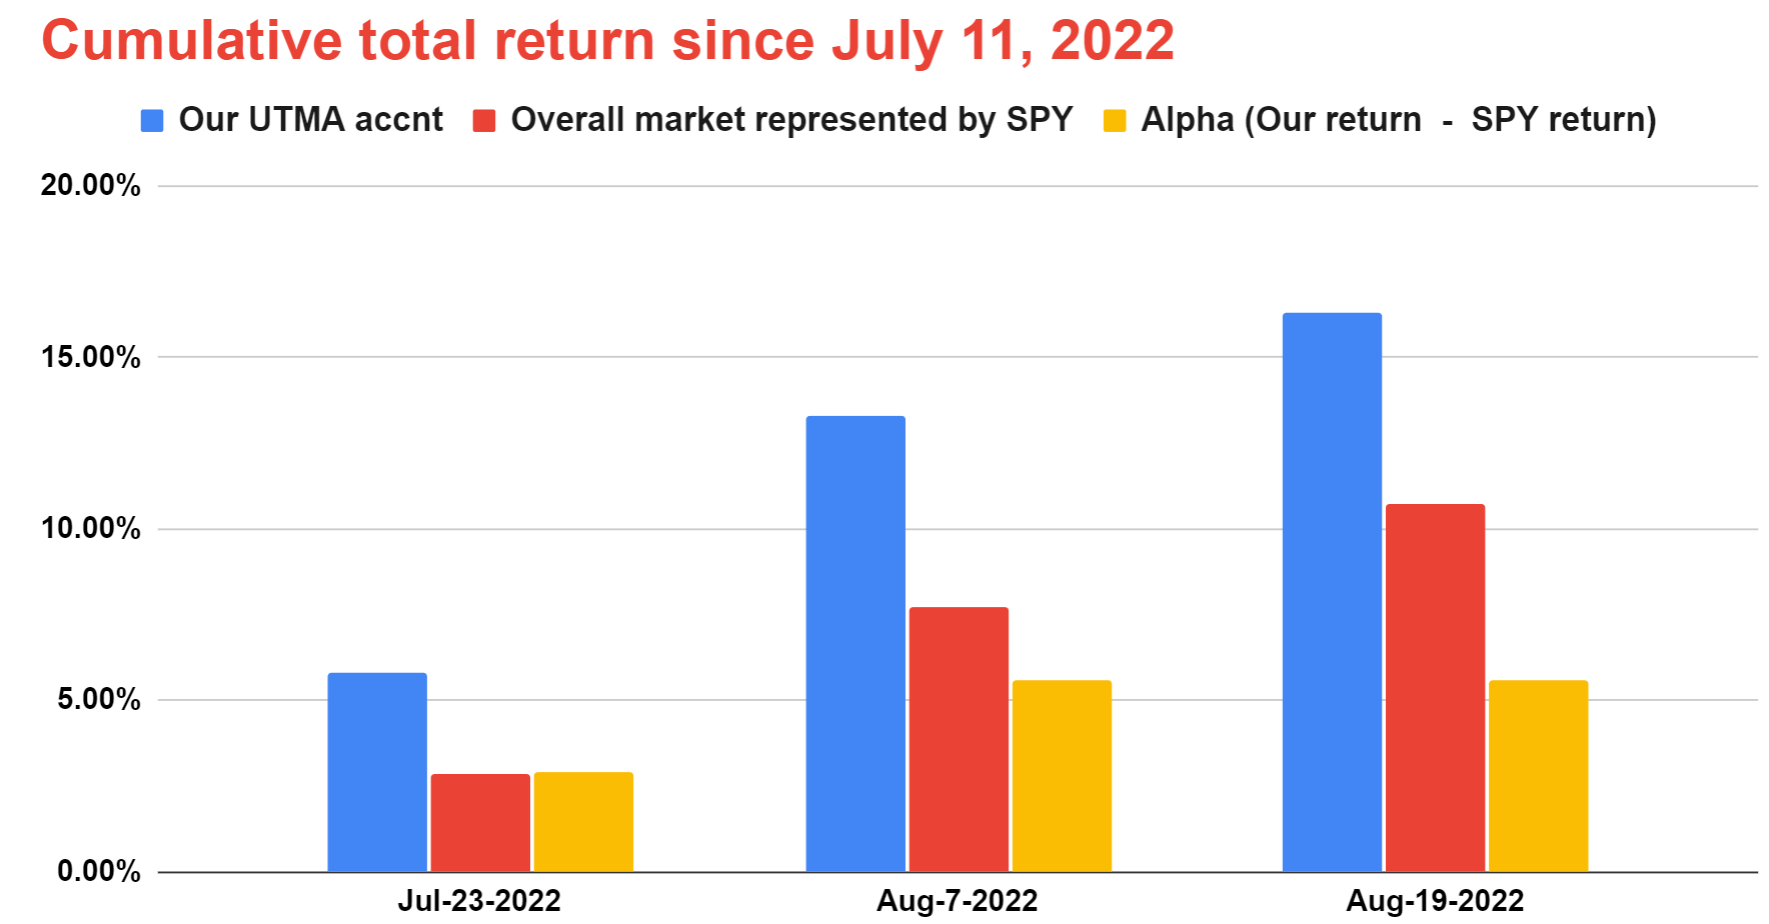
- For performance tracing purposes, I used the prices on July 11, 2022 (the date I first published this portfolio) on SA as the entry price. So, it’s easier for readers to verify and track its performance even though I’ve been holding some of the stocks for a while. As you can see, MU has returned about 6.4% since then. Overall, the whole account is leading SPY by a small margin of 5.56% since then adjusted for dividends.
- The current balance of this account, $115.7k, is based on an initial investment of $100k on July 11, 2022. Note that our actual portfolio size is substantially smaller. We chose $100k as the starting size for this model portfolio to simplify the math and suppress the role of rounding off errors.
Author Author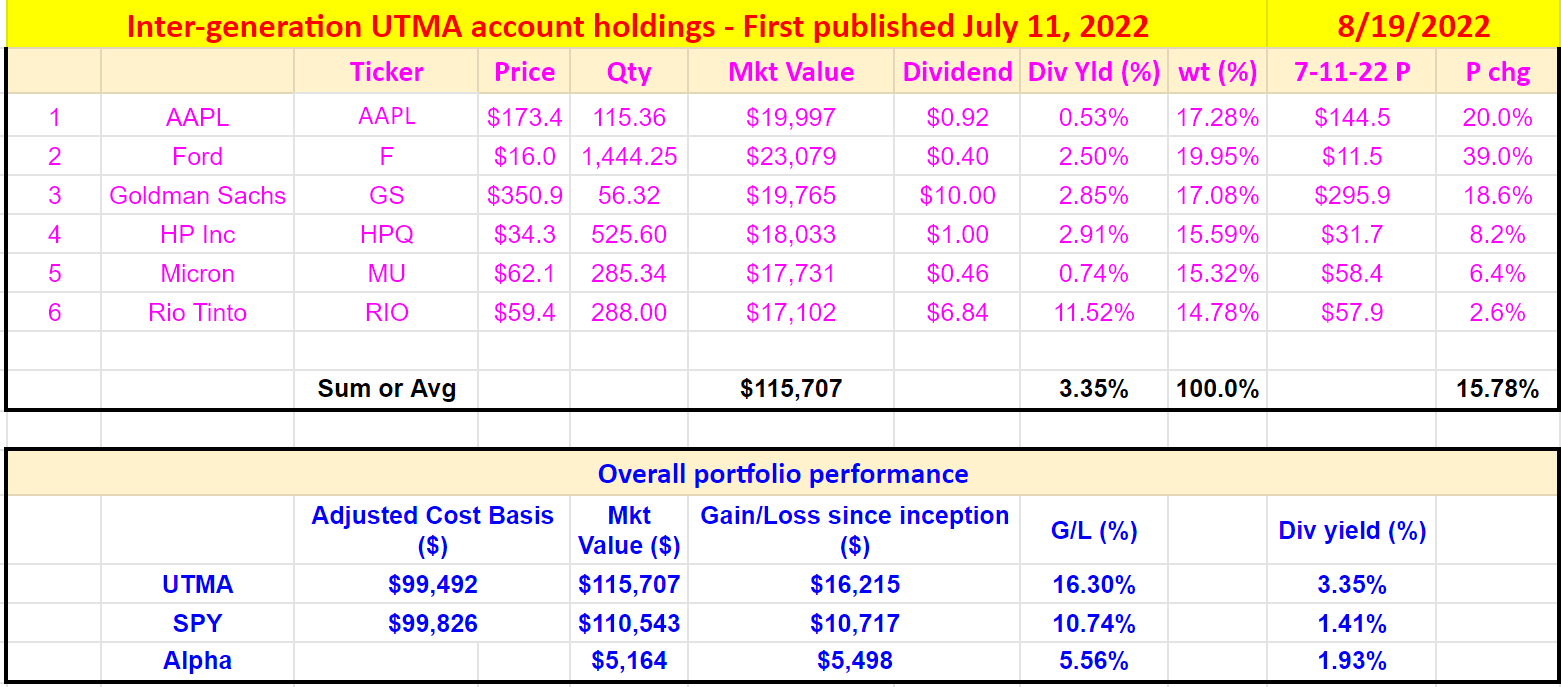
Margin cycles
Ultimately, three factors determine the profitability of a business in the long term: profit margin (“PM”), asset turnover ratio (“ATR”), and leverage according to the so-called DuPont framework. And here I think it is a very interesting framework to apply to MU because the framework really illustrates the cyclical nature of the business.
Here, I made a few modifications to the original DuPont method to suit modern corporations like MU. These modifications are detailed in my earlier writings and very briefly summarized below for easy reference:
The original DuPont method is developed to analyze return on equity (“ROE”). And here I modified it to apply on ROCE (return on capital employed) instead of ROE for several reasons. The first main reason is that ROCE is more fundamentally important than ROE as aforementioned. And secondly, the ROE concept is not even applicable at all to many modern corporations, because more and more corporations have decided to return all share equity to shareholders as they rely more and more on their intangible assets to make a profit.
Through simple math, we can show that ROCE is just the product of these three things, similar to the original DuPont framework, i.e.,
ROCE = PM x ATR x leverage.
Where PM here is defined as operating income divided by total revenue, ATR is defined as total revenue divided by total asset, and leverage is defined as total asset divided by total capital employed.
Based on the above discussions, we will examine MU’s 3 profitability drivers one by one next. The first chart below shows the profit margin driver. Here again, you can see its cyclical nature, showing a kind of sine wave behavior around the mean of 38.5%.
In particular, remember that its last bottom valuation happened in 2018 as just mentioned. But as you can see from the chart below, in 2018, its profit margin was actually at a peak level and its margin only bottomed in 2019, again illustrating the leading nature of valuation and lagging nature of business fundamentals.
The margin fluctuations have stabilized somewhat for MU over the years. It has deviated less from the mean since 2016. Currently, it hovers around the 48% level, higher than the mean by a good bit. And again, as I mentioned earlier, we are in the beginning phase of the contraction, and business fundamentals have not bottomed yet. Lastly, if you can look past the short-term cycles, an average margin of 38% is quite remarkable. As a rule of thumb, 10% is a very healthy profit margin and 20% is a very high margin. So MU’s 38% average margin is among the very high end compared to the overall economy.
Author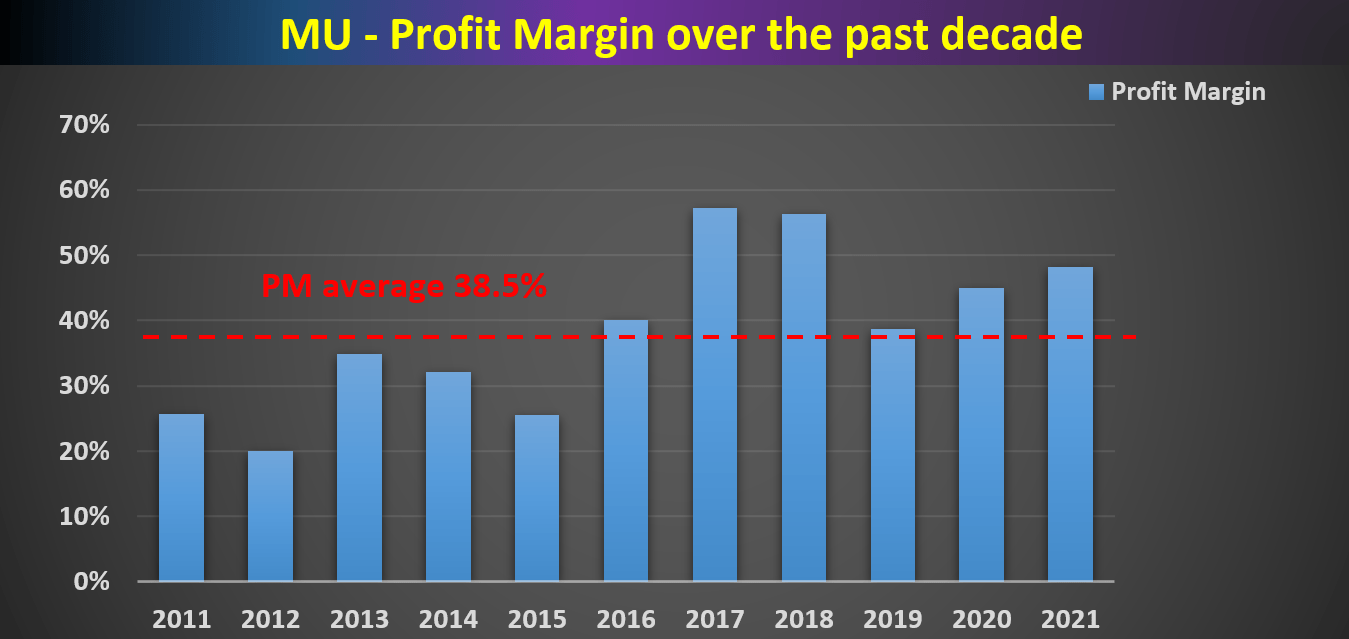
And its management certainly knows how to manage the cycle. From their comments, an example quoted below from its CFO Mark Murphy in the recent earnings release (abridged and emphases added by me), they are always thinking beyond the current speedbumps and focusing on the cycle. And note again that they quoted average cross-cycle operating margins of approximately 30%, close to but more on the conservative side compared to the historical average of 38.5%.
… we laid out a cross-cycle financial model for the Company that reflects the key attributes of our business: a strong revenue growth CAGR of high single digits, robust cross-cycle operating margins of approximately 30%, and healthy free cash flow margins that exceed 10% of revenues. Given our long-term financial outlook and the strength of our balance sheet, we see the current share price as very attractive and, at these levels, intend to repurchase shares more aggressively in fiscal Q4.
Operation headwinds
But indeed, the headwinds from cycles are real. The second chart shows the ATR driver. The ATR measures how efficiently a company uses its assets to generate revenue. The higher the ATR, the better the company is performing, since higher ratios imply that the company is generating more revenue per dollar of assets. As seen, MU’s ATR has also been demonstrating a cyclical nature around the mean over the years. The mean is 0.55x in the long term and the peak level is around 0.7x. And currently, it is 0.48x only, below the mean by about 13% and below the peak by about 1/3. It will probably get even lower in the near future due to the buildup of inventory, slower demand, and also global supply chain disruptions.
However, ATR is a knob that management can consistently tweak to suit its operations. And as conditions improve, MU can turn the knob to improve its operational efficiency relatively rapidly.
Author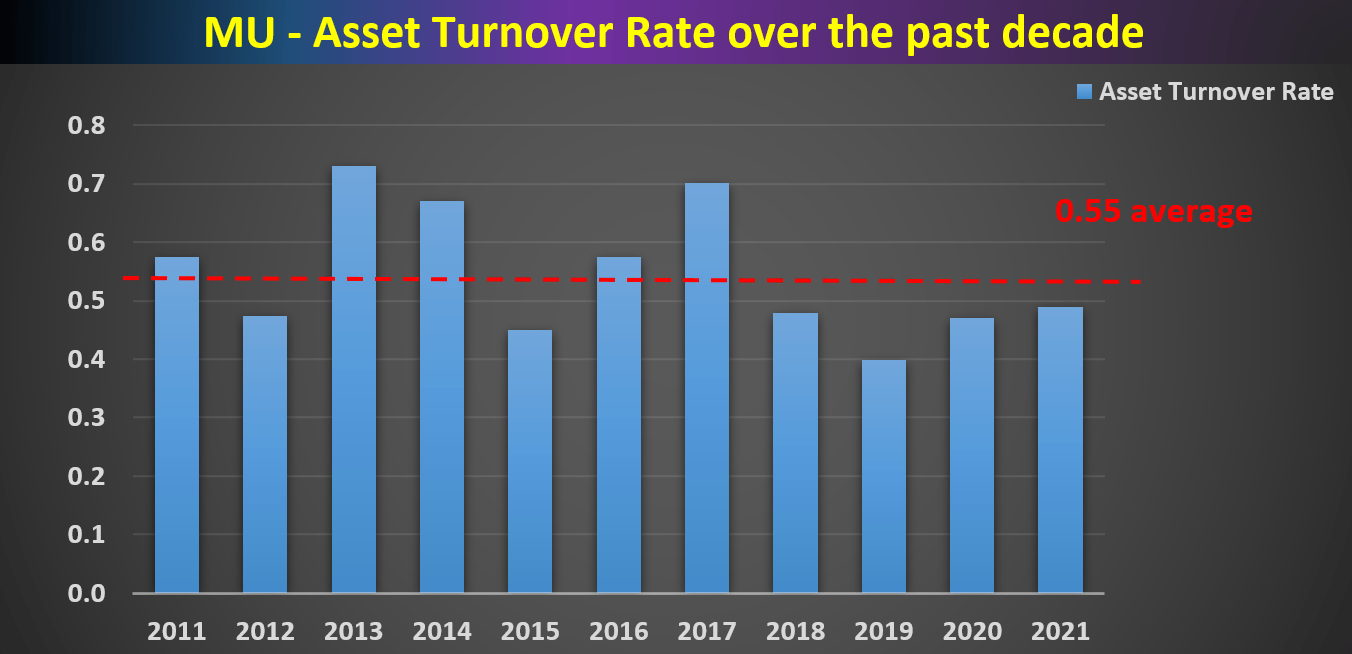
Strong Financial Strength and capital allocation flexibility
This third and last chart next shows the effective leverage. As seen, MU’s effective leverage has also been quite stable around an average of 1.4 over the past decade. And it has been deleveraging over the years. Its leverage decreased from about 1.6x at the beginning of the decade to the current level of 1.3 only, by almost 20%. Management certainly understands the key to surviving a cyclical business is to leverage conservatively.
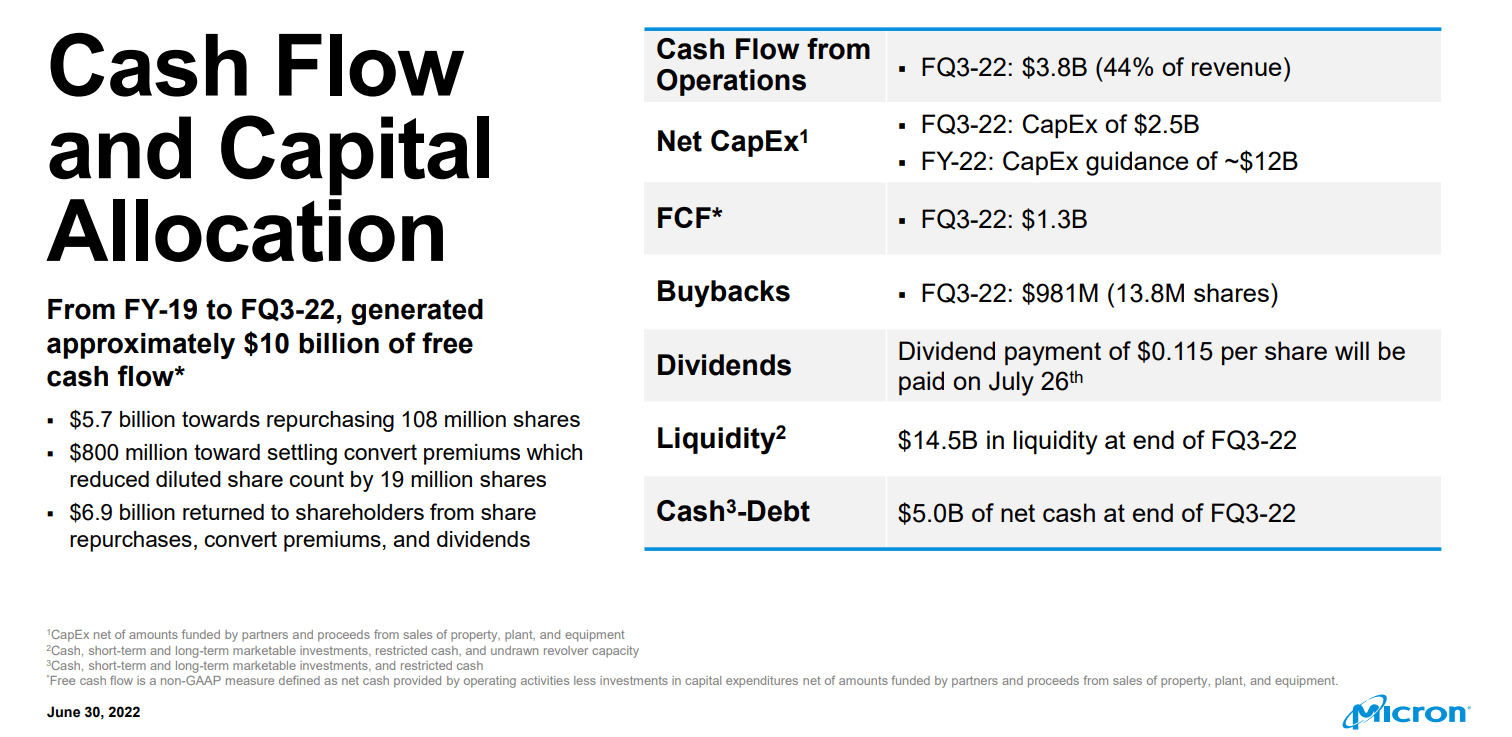
Besides maintaining stable and conservative leverage, at the same time, MU also enjoys strong capital allocations flexibility thanks to its thanks for its robust cash generation. As aforementioned in the CFO comment, MU intends to repurchase shares more aggressively in fiscal Q4 on top of the $981M it repurchased in Q2. It also spends aggressively on CAPEX to prepare for the next cycle. It spent $2.5B in Q3 on CAPEX projects and plans to spend a total of $12B in its full 2022 fiscal year.
And we will see next how such reinvestments can help its growth.
Author MU FQ3 earnings report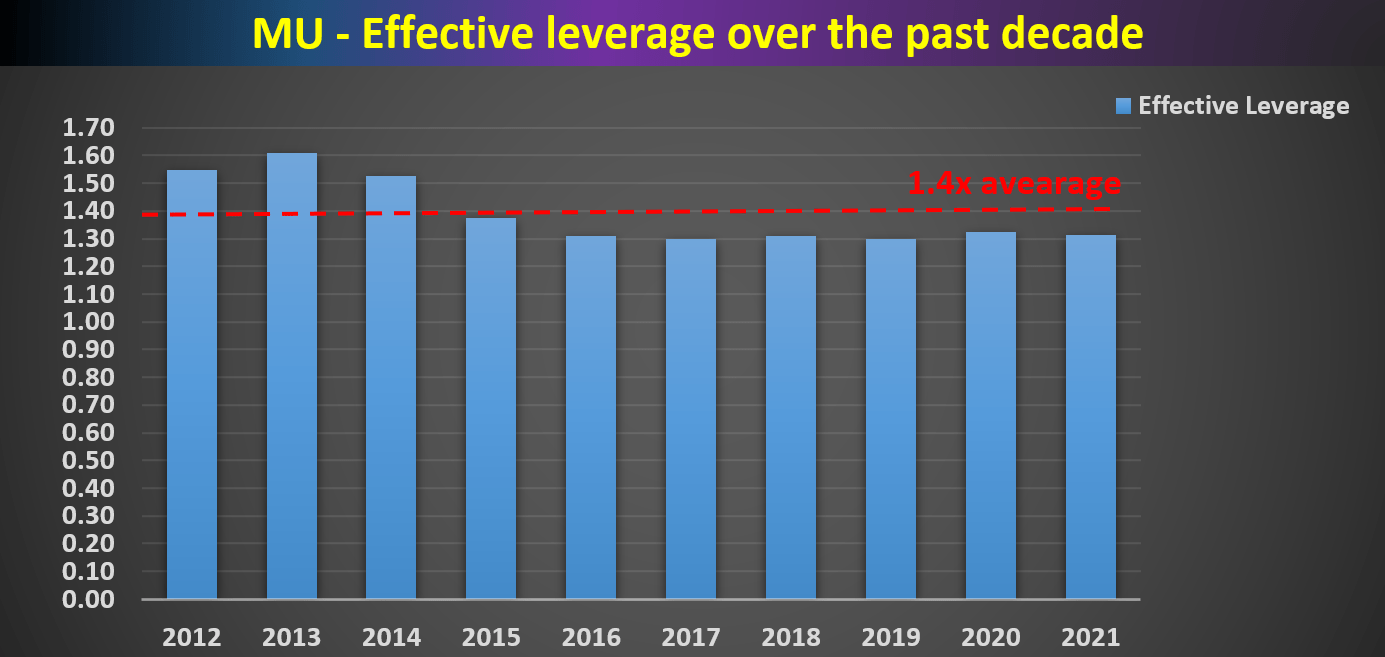
Projected profitability
Now with the above understanding of the fundamental profit drivers, we can make projections about future profitability and long-term returns. The following table summarizes the two profitability scenarios based on the above DuPont analysis.
- The base case assumes the profit margin to maintain at the historical mean of 38.5%, the ATR to stabilize around the historical average of 0.55, and the leverage stays at the current conservative level of 1.4. In this case, the projected ROCE will be 30%.
- The bull case assumes a profit margin of 45% and also a higher ATR of 0.6. Again, the leverage stays at the current conservative level of 1.4. The margin and ATR expansion are possible for several reasons. As aforementioned, there are signs that management is learning to better manage the cyclicality. And at the same time, future needs from EV, robotics, and AI will provide much stronger secular headwinds to spur demand. In this case, the projected ROCE will reach about 38%.
Author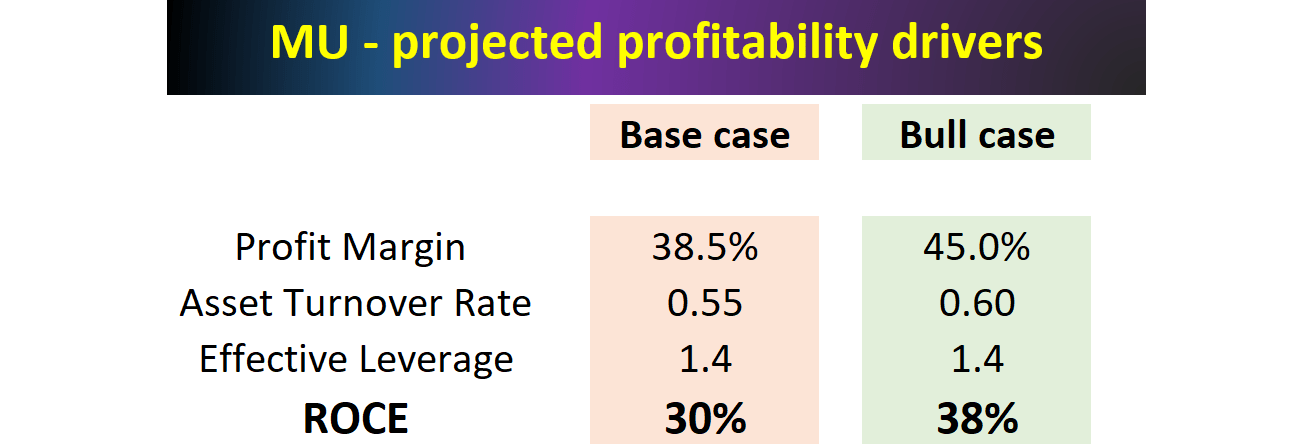
Projected return
With the above ROCE projections, I will put all the pieces together and project growth and returns. In the long term, when price volatilities are averaged out, the return is relatively “simple”. It is the sum of two parts: the owner’s earning yield when we made the investment (“OEY”) and the growth rate (“GR”) of the owner’s earnings. That is:
ROI = OEY + GR
And the growth rate is given by:
GR = ROCE * Reinvestment Rate
And the table below summarizes these pieces for MU for the base case and bull case mentioned above. A few notes about the assumptions that I made here. First, I used the EPS as the owner’s earnings. It is conservative in the sense that the portion of growth CAPEX should be added back. Second, the 10% reinvestment rate in the base case was taken as its reinvestment rate in recent years.
This is a conservative estimate in my mind. For once things, the recent passing of the CHIPS act will effectively boost its reinvestment rates significantly via various incentives and subsidies. For example, its R&D expenses can enjoy a tax benefit, a good part of its R&D can be supported by funds from the act too, and finally, it may potentially benefit from the act for some of its capital projects too.
By assuming a 15% reinvestment rate (an effective rate consisting of its own money plus the incentives from the CHIPS Act), the bull case projects a total annual return of about 15%, with about 9% coming from current OEY and 6% from growth. Even in the base case, the projected return is double-digit around 12%, with 9% coming from OEY and 3% from growth.
And finally, note that these following returns are real returns, i.e., without inflation adjustment. If you assume MU has the pricing power to at least adjust for inflation, then the nominal returns will be in the high-teens.
Author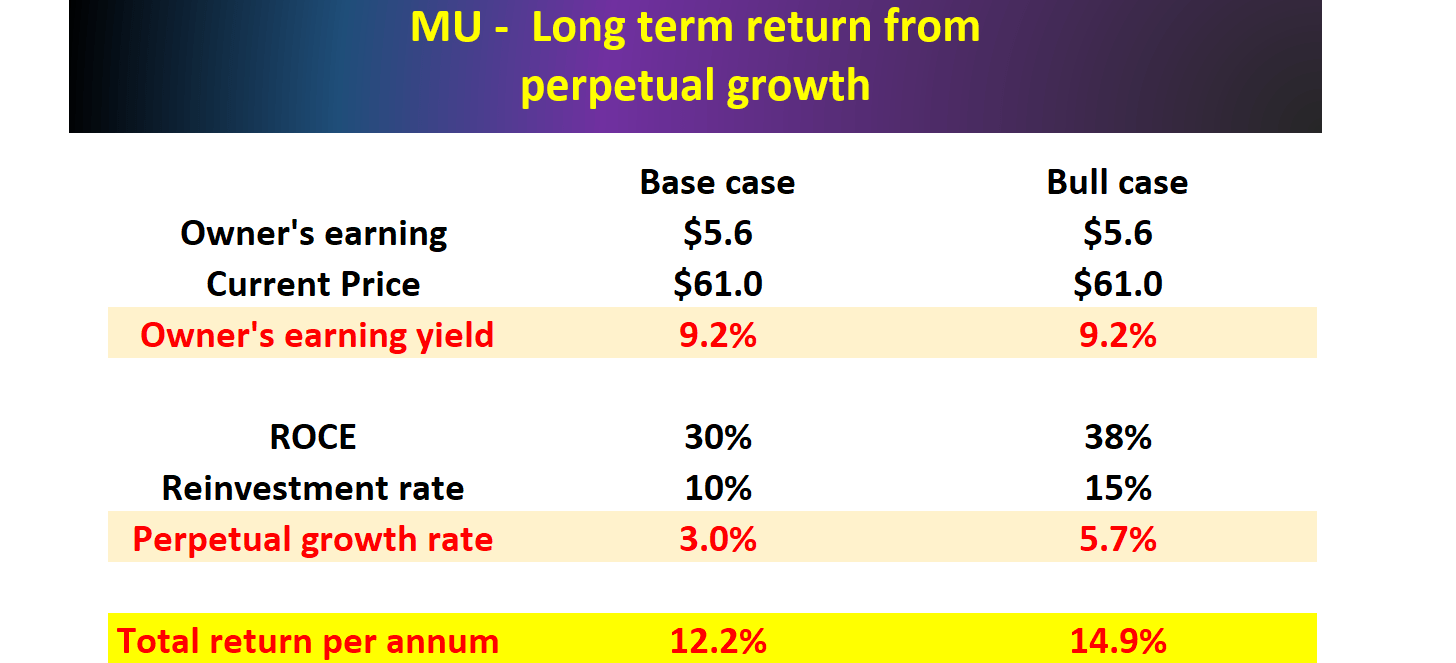
Final thoughts and Risks
Chip stocks like MU are notoriously cyclical and therefore not suitable for all accounts. The volatility in the near-term (or even mid-term) can be truly nerve-wracking. If you recall from the first chart above, its P/E varied from a bottom of 2.7x to a peak of 26.6x during the past cycle, a swing of almost 10 fold. However, for accounts that can sit out such near-term volatilities and account owners with a strong nervous system to fall asleep should such a swing happen again, such extreme cyclicity creates investment opportunities that are hard to find in other sectors.
Finally, risks. As mentioned above, I do not think the business fundamentals have bottomed yet. And MU is facing a range of headwinds in the near future due to inventory buildup, slower demand, global supply chain disruptions, softened demand from PC and smartphones, and also potentially a recession. Most of these issues will impact both MU and the rest of the chip sector. Specific to MU, it has to immediately start reducing its supply growth trajectory and prepare for a reduced level of bit supply growth in FY23. As demand softens, it may have to reduce the price to clear its current inventories. It also had to reduce its wafer fab equipment CAPEX for FY23.
MU FQ3 earnings report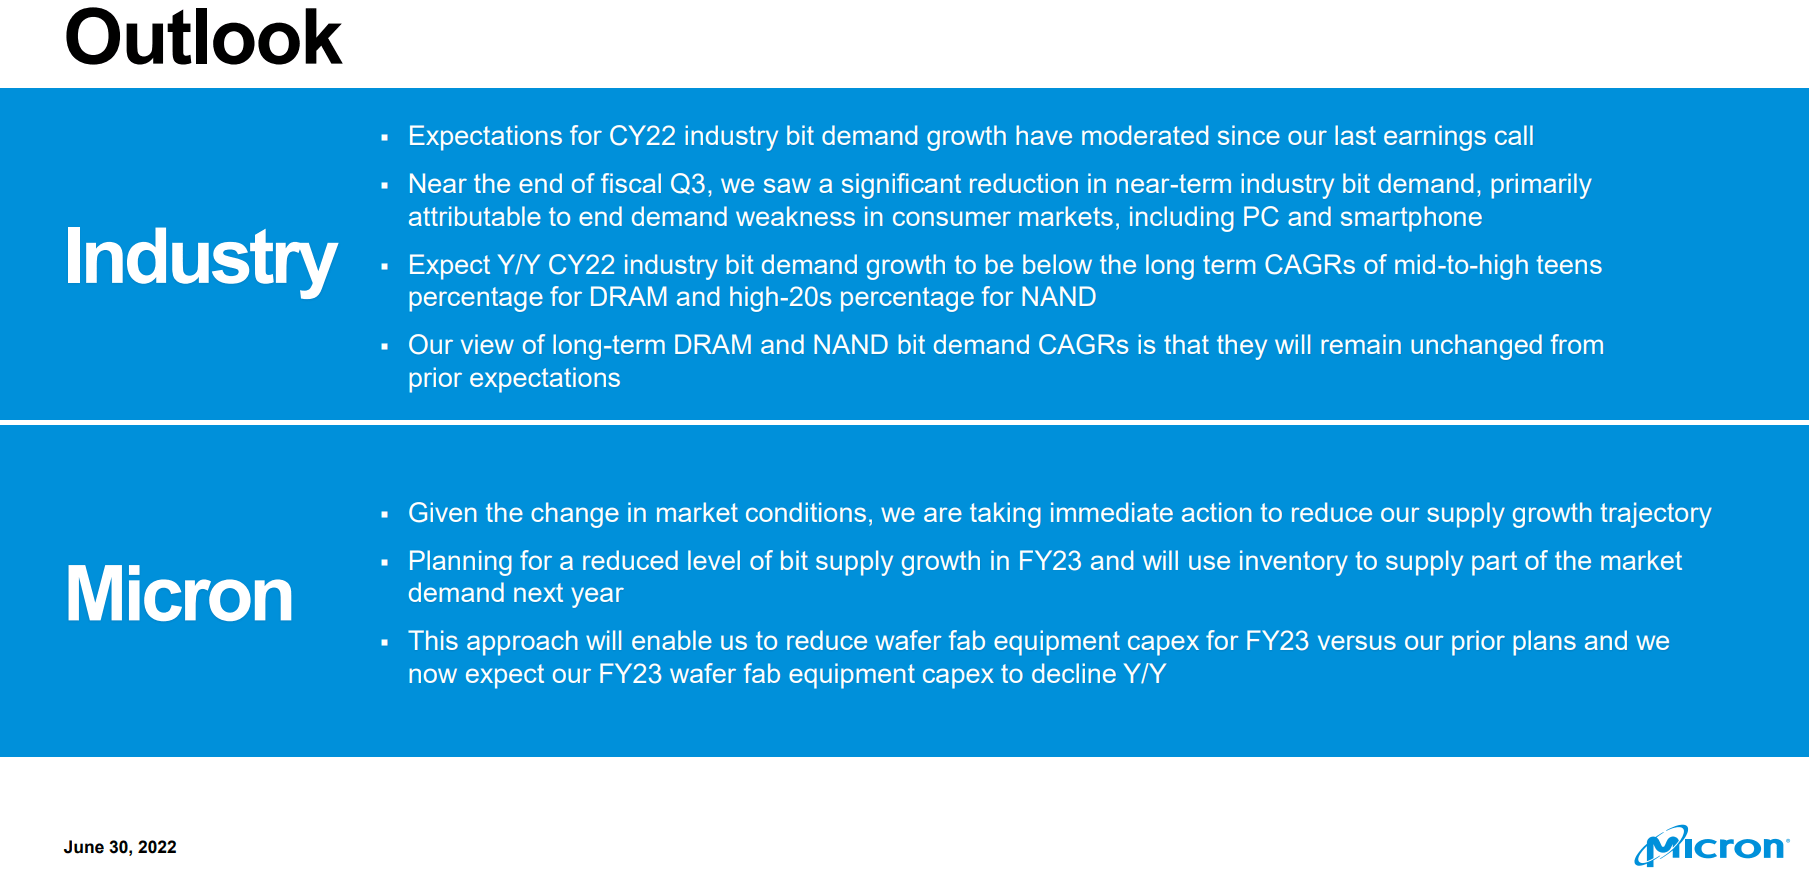
Be the first to comment