

Wolterk
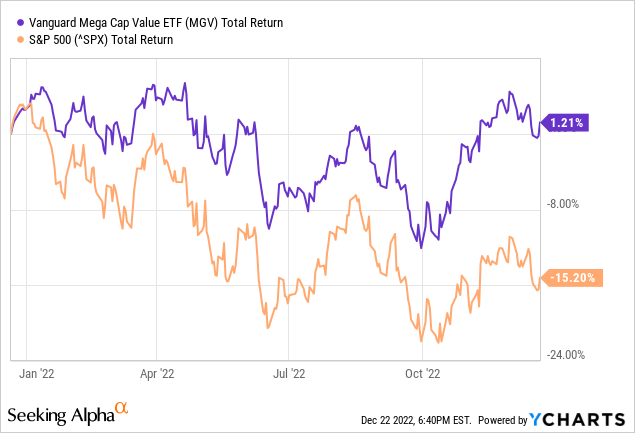
The Vanguard Mega Cap Value ETF (NYSEARCA:MGV) has been a relative shelter-in-the-storm during the 2022 bear-market and has significantly outperformed the broad S&P500 (see below). As the chart shows, MGV has – generally – been outperforming on both up- and down-cycles during the bear-market. That is because the ETF has a very defensive position and is selling at a significant discount to the broad S&P 500. Today, I’ll take a closer look at the MGV ETF, and then you can decide if it is a good choice for a long-term holding in your well-diversified portfolio.
What “Value” Means
Generally speaking, “value investing” is a strategy that picks stocks that appear to be trading for less than their intrinsic or book value. While it is not always easy – or even possible – to find companies in the universe of Mega-Cap stocks that trade below their book value, the MGV ETF tracks the CRSP US Mega Cap Value Index, which basically classifies and screens value stocks using the following criteria: price-to-book, P/E, forward P/E, dividend yield, and price-to-sales. That being the case, the MGV ETF should be defensively positioned, which is exactly the type of exposure investors should want exposure to, given the current challenging markets.
So, let’s take a closer look at the MGV ETF to see how it has positioned investors for success going forward.
Top-10 Holdings
The top-10 holdings of the MGV ETF are shown below and were taken directly from Vanguard’s MGV ETF homepage, which is where – in addition to this article – you can find more information on the fund. The top-10 holdings equate to what I consider to be a relatively well-diversified 26.6% of the entire 144 company portfolio:
Vanguard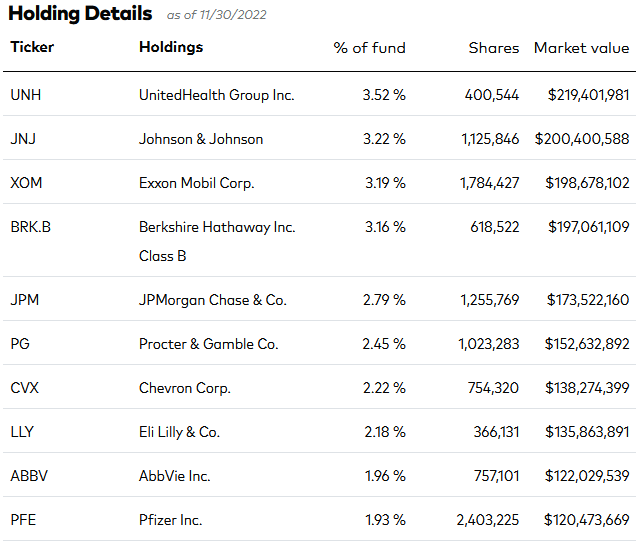
As you can see by the top-10 holdings, the MGV ETF is heavily weighted in HealthCare – indeed, it is the most highly allocated sector in the fund at 24%.
Diversified healthcare companies are the top-two holdings: UnitedHealth Group (UNH) is #1 with a 3.5% weight, followed by Johnson & Johnson (JNJ) with a 3.2% weight.
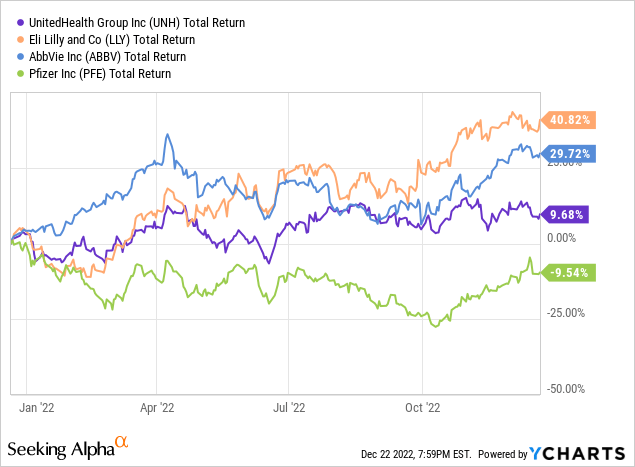
Three big-pharma companies – Eli Lilly (LLY), AbbVie (ABBV), and Pfizer (PFE) hold down the #7, #8, and #10 positions with an aggregate weight of 6.1%. As you might expect, these healthcare companies have all significantly outperformed the S&P500 this year:
Exxon Mobil (XOM) is the #3 holding in MGV with a 3.2% allocation. Exxon has had a resurgence this year as the recent addition of not one, not two, but three Engine #1 representatives to its Board-of-Directors has, finally, gotten Exxon to change its top-level strategy. The company ended its production growth-at-all costs strategy, and has significantly reduced its annual cap-ex budget (see How Tiny Engine #1 Was Able To Turn Exxon Around). That, combined with strong O&G prices, have led to bumper profits. That is welcome relief for long-suffering XOM investors, given the “lost decade” when Exxon actually delivered a negative total return over a 10-year period (even as CEO pay zoomed 30% higher …).
Exxon is up 76.3% over the past year and currently yields 3.37%. And while many Exxon shareholders are doing a “happy dance” over the stock’s recent performance, I would point out that the stock has only regained the level that it traded at way back in 2014.
The #4 holding is Berkshire Hathaway (BRK.B) with a 3.2% weight. The diversified conglomerate’s top-5 equity holdings, as of its last SEC filing, include Apple (AAPL), by far its largest position, Bank of America (BAC), and Coca-Cola (KO):
Bankrate.com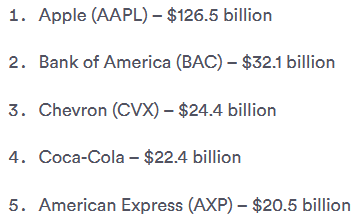
Chevron (CVX), the second-largest oil & gas company in the U.S., is the third-largest stock holding in Berkshire (despite Occidental Petroleum (OXY) getting most of the press…), as well as the #6 holding in the MGV ETF with a 2.2% weight. Chevron is the DJIA’s best performing stock this year (+44.3%) and yields 3.25%.
As far as the overall portfolio exposure, in addition to the HealthCare sector, MGV is overweight Financials (19.6%), Industrials (14.1%), Consumer Staples (11.6%), and Energy (9.1%)
Valuation
The graphic below compares various valuation metrics of the MGV ETF to those of the Vanguard S&P 500 ETF (VOO):
Vanguard Fund Compare Tool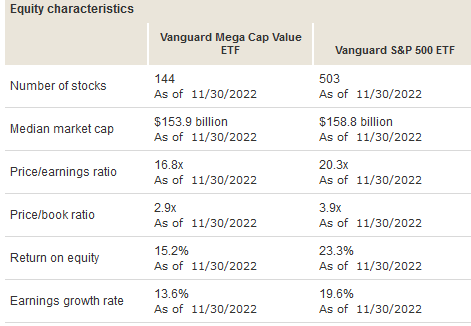
As you can see, the MGV portfolio trades at a P/E discount of 17.2% as compared to the broad S&P 500. On a price-to-book basis, the discount is even larger: 25.6%. Meantime, as you might expect, ROE is 34.8% lower, and the EPS growth rate is 30.6% lower. That said, defensive stocks are typically much more resilient on an ROE and EPS basis as compared to higher valued “growth” stocks during recessions – and many analysts and investors expect a recession next year.
Income
It’s too late for new investors to qualify for MGV dividends in FY22, but it is never too late to see what kind of income investors can expect from the fund going forward.
The TTM dividend declarations in FY22 are shown below:
Vanguard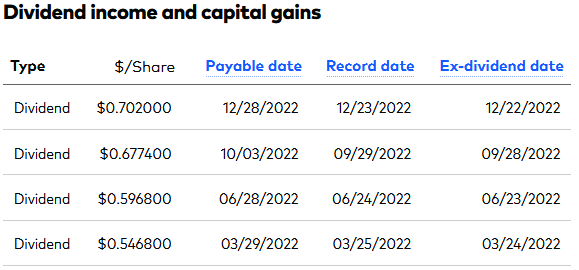
TTM total dividends for FY22 were $2.523/share, which at yesterday’s closing price ($101.93) equates to a 2.48% yield. That is 77 basis points above that of the S&P 500’s yield of 1.71%.
Also of note is that the quarterly dividends rose considerably throughout the year (bottom-to-top in the chart above). That indicates that – despite the bear-market and challenging economy – the portfolio demonstrated relatively strong dividend growth.
Performance
The MGV ETF has an average 10-year annual return of a very solid 12.59%.
The graphic below compares the MGV ETF to several of its peers, including its sister fund the Vanguard Value ETF (VTV) and the iShares S&P 500 Value ETF (IVE):
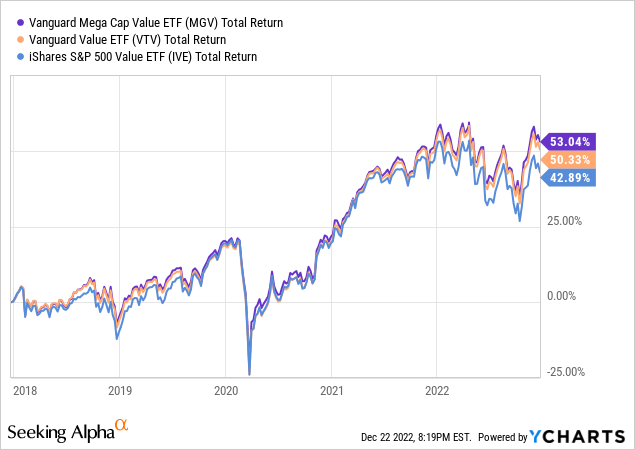
As you can see, the MGV ETF has represented itself quite well.
Risks
The companies held in the MGV ETF are not immune to the impact of the macro-environment, which includes several headwinds: high inflation, rising interest rates, the very negative impact from Putin’s horrific war-on-Ukraine that broke the global energy & food supply chains and that has put a big damper on the EU economy (and others), as well as China’s inability to fully open-up given its never-ending challenges related to Covid-19.
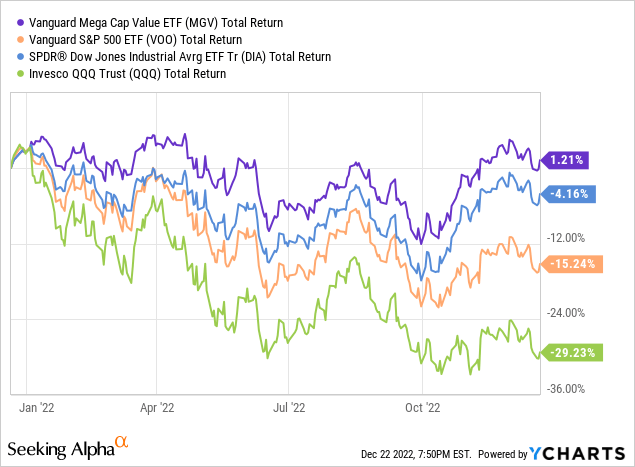
Any or all of these factors could lead to a global economic slow-down and or recession that could put pressure on the stocks in the MGV portfolio. That said, the whole idea of owning a “value” oriented investment is that it will be more immune to these pressures as compared to the broad market indexes (i.e., the S&P 500, the DJIA, and the Nasdaq-100). Indeed, the chart below shows the 1-year total return of the MGV ETF as compared to those indexes – as represented by the VOO, (DIA), and (QQQ) ETFs, respectively:
Summary & Conclusions
I find the MGV ETF to be a very attractive opportunity for investors given the current macro-investing environment. For investors who are still working – or retirees that generate sufficient and excess returns – and want to keep investing throughout the market cycles, MGV is an excellent choice in my opinion. As shown in this article, MGV is trading at a significant discount to the broad market indexes, has significantly outperformed them this year, and has demonstrated steady dividend growth. All those may be traits that repeat themselves in 2023. That being the case, investors should wrap-up the MGV in a nice-box, put a big red bow on the top, and give it to someone they love on Christmas.
I want to take this opportunity to thank all of my followers and readers and to wish you all a safe, healthy, and happy holidays as well as, of course, a very prosperous New Year!
Be the first to comment