

kynny/iStock via Getty Images
Investment Summary
Despite trading in a wide range for FY22, I’m still heavily bullish on the long-term outlook of Mettler-Toledo International Inc. (NYSE:MTD) shares. We originated a buying position in MTD shares in FY19 and have been active in the stock since. The company’s extended its now-legacy share repurchase program to $1 Billion (“Bn”) for FY23, and has authorized another $2.5Bn over the coming few years. Therein lies one part of the alpha opportunity the MTD looking ahead [amongst other factors], in the sustained capital appreciation underpinned by management’s capital budgeting.
I’ve written extensively about this opportunity previously [See: here, and here, and most recently here]. In the last analysis I noted MTD presented with a c.7% forward buyback yield. This continues to be the case with FY23 [and beyond] projections from management confirmed in the Q3 10-Q, as noted in Exhibit 1.
With shares trading ~$82 beneath our price target of $1,546, net-net, I continue to rate MTD a buy for those investors willing to remain constructive on the stock and maintain an active position looking ahead.
Exhibit 1. The c.700–750bps forward buyback yield continues to be present with management’s language on the Q3 earnings call.
Note: MTD Management confirmed its repurchase authorization on the Q3 earnings call after mentions in the Q3 10-Q. FY22 YTD buyback yield calculated on Q2 FY22 and Q3 FY22 market cap respectively; forward buyback yield calculated as function of MTD market cap before open 14/11/2022. (Data: HB Insights, MTD SEC Filings)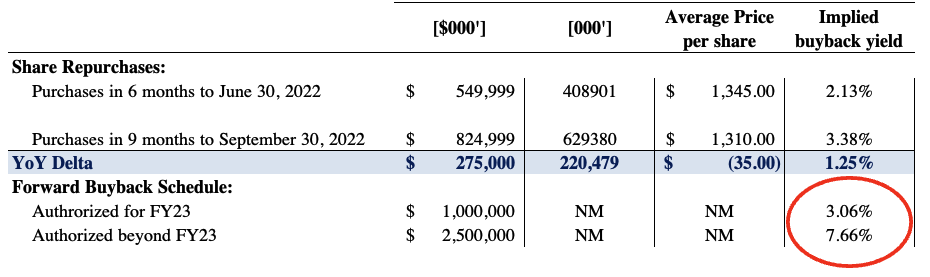
Exhibit 2. Broad equities have come out of a double bottom and jumped higher from August trading. We now have MTD pushing back to FY22 highs.
Data: Updata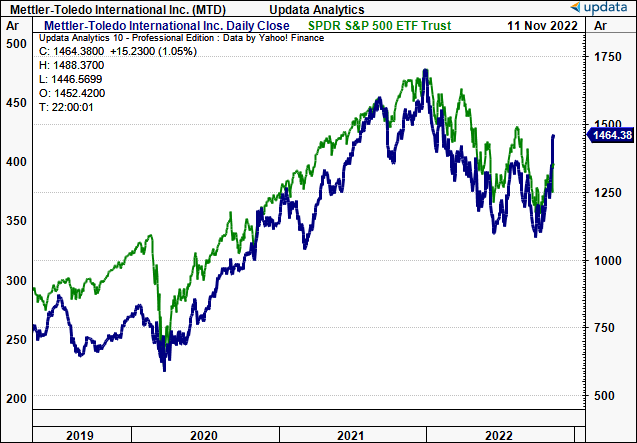
MTD earnings upside and return on capital
The company’s Q3 numbers came in strong, with sales growth of 10% [constant currency] to $985mm. In USD terms, growth actually contracted by ~600bps, with 100bps of “Russia-related headwinds” folded into this. Disaggregation of MTD’s Q3 YoY revenue growth by geography is 11% domestic/US, 13% from Americas, ~500bps in Europe and 15% YoY growth in its remaining global markets. Its important China market saw 15% constant currency growth in the 12 months to September 30, 2022 as well.
Segment growth meanwhile was on trend. Lab sales grew another 10%, with industrial and food retail up 10%, and 7% respectively. It also increased R&D investment by 10% YoY to $44.1mm, approximately 4.5% of turnover, leading pre-tax earnings growth of 11.4% to $275.8mm.
Meantime, FCF and return on invested capital (“ROIC”) maintained their cyclical uptrends during the quarter, with MTD realizing 46.8% in TTM ROIC last period.
The covariance between FCF and ROIC for MTD are standouts in my estimation. Periods of FCF downside/outflow are matched with corresponding uplifts in ROIC, illustrating that free-cash was/has been invested wisely across time [Exhibit 3].
This demonstrates management’s ability to generate economic profit [i.e. return above the cost of capital] with the ~47% TTM ROIC comfortably outpacing its WACC hurdle of 7.26% at the exit of Q3. The ROIC/WACC spread is therefore 6.4x of coverage. MTD’s management has therefore added 39.5 percentage points/644% of value in the past 12 months in my estimate [ROIC spread above the Q3 FY22 WACC hurdle].
Exhibit 3. ROIC and FCF trends continue in cyclical uptrend whilst adding 39.5 percentage points of value above cost of capital.
- These are clear standouts in the investment debate that tie in to management’s capital budgeting strategy of ongoing share repurchases.
Data & Image: HB Investments US Equity Fund, MTD SEC Filings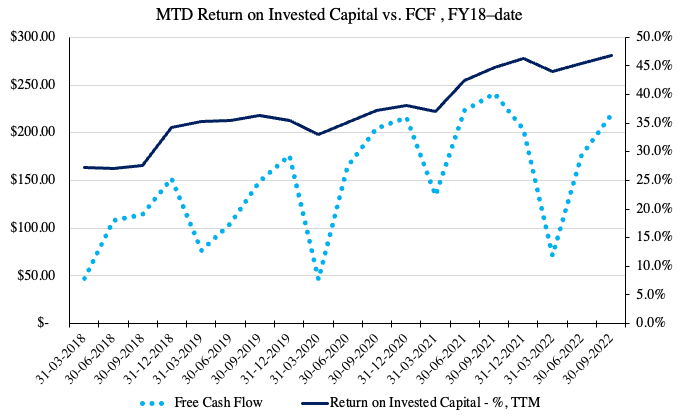
In addition, the company looks to continue its trajectory of quarterly and annual earnings growth. Driving this upside is projected revenue growth in each of MTD’s key markets, namely EMEMA, APAC and the Americas. Management forecast FY22 growth of 15% to $39.05 at the upper end. It projects ~900bps EPS growth in FY24 to $42.40. In my previous analysis it was noted each $100mm in buyback adds ~$0.15 in EPS accretion with a VWAP of $1,200 per share. As seen in Exhibit 4, we estimate an average of 12.2% EPS upside per quarter in FY24, and another 14.4% in annual EPS accretion into the same period.
At the same time, consensus EPS growth estimates for the S&P 500 for FY22 and FY23 are 6.7% and 7.3% respectively. We also project a quarterly reduction of ~3–3.5% in MTD shares outstanding, in keeping with the company’s repurchase program.
Exhibit 4. Projected average 12.2% and 14.4% in quarterly/annual EPS upside respectively.
Data: HB Insights Estimates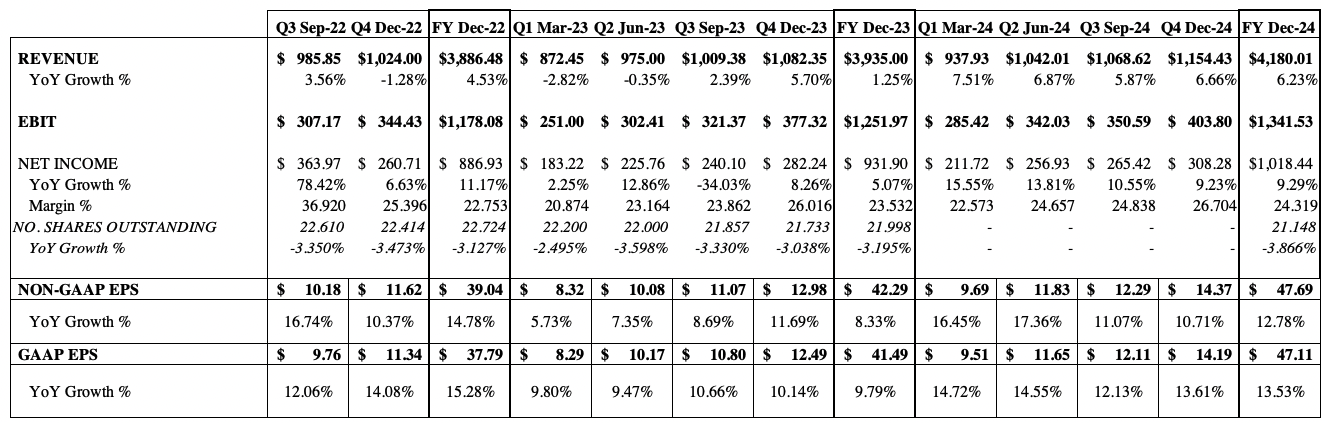
MTD Accumulation over FY22
There’s also been an adequate amount of fund accumulation of MTD shares over the past 3-4 months to date. In my estimation, an increase in fund exposure [mutual/hedge/CEFs, excluding ETFs] leading into an upside move is quintessential buying support required to validate a stock’s recent gains. Institutions own 95.3% of the MTD float, and therefore serve as a good proxy for directional momentum.
Turning to MTD’s bounce from weekly lows in October, registered investment funds [excluding ETFs] increased MTD exposure by a median of ~348%, measured by no. shares in ownership from Q2–Q3 [Exhibit 5; data from Refinitiv Eikon]. We see this accumulation in the increasing volume trend that has poked above the resistance line shown in Exhibit 6 in the market data section below.
As prices have closed higher for the past 5 consecutive weeks, this has been matched up uptrends in large volume, matching the buying activity of these funds. We also see volume counter-trending as prices were declining from August–October, in support of the increasing fund ownership [Exhibit 5].
Exhibit 5. Quarterly fund ownership changes Q2–Q3 FY22 [left–right]
Note: Fund ownership changes measured as percentage change in number of shares owned from period to period. (Data: HB Insights, Refinitiv Eikon)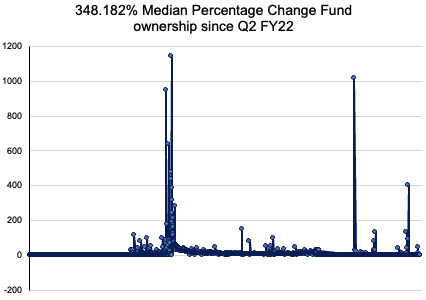
Market data corroborative of further upside for MTD
As seen in Exhibit 6 [showing weekly bars], the MTD share price has recently bounced from its October lows and gapped to the upside as of last week’s close. This is in-line with the broad trend of the market, as noted earlier on in Exhibit 2.
The first price reversal [June–August] was preceded by a downtrend that lasted for 23 weeks from FY21. This formed a wide and loose base with prices then straight up from the bottom [in other words, a bad base to work from]. Volume was also contracting heavily into the move, but didn’t necessarily evaporate.
The October reversal was formed from a much tighter base, with volume breaking out above the downtrend, as shown. On each previous uptick in MTD price distribution from FY21–date, volume had dried up before the breakout, similar to this move.
Moving into November, prices closed back above the 50DMA and are converging back towards the 250DMA line. Both have historically served as strong support zones for MTD. Relative strength vs. the SPX is also lifting as well in support of further upside.
In my estimation, there’s good fundamental momentum backing these technical moves. Earnings and ROIC exhibit strong growth alongside the increase in fund ownership this YTD.
Exhibit 6. October price pivot formed from tight base with prices closing above the 50DMA and converging to the 50-week line
- Volume first dries up before breakout
- Increase in short-term volume leading into trend with 5 weekly bars closing higher = fund accumulation described above.
Data: HB Insights, Updata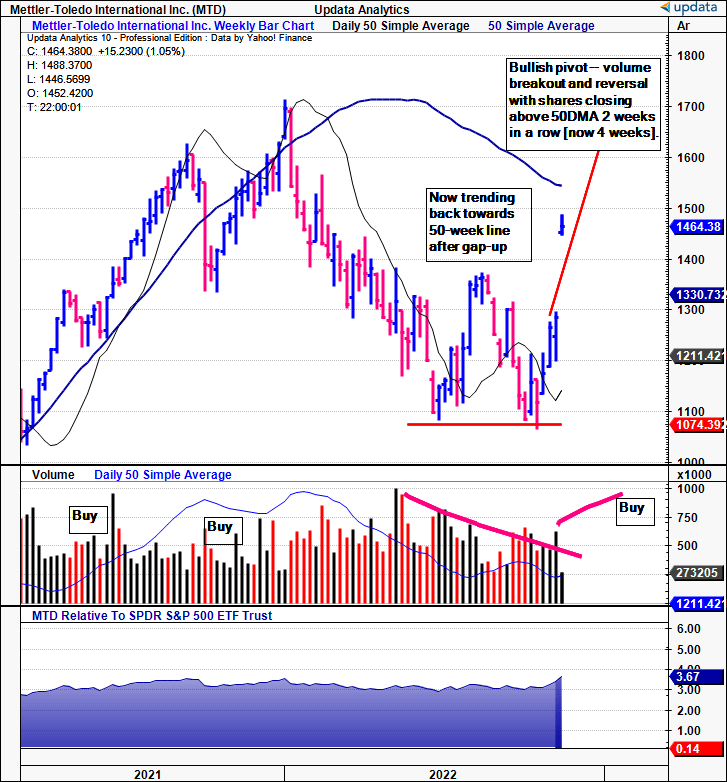
On the assumption MTD completed the bottom of its move in October, then tracing the fibs’ down from the FY21 highs would suggest the stock has already retraced ~62% of the downside. Should prices hold this trend the next target we’d be searching for is $1,570. This aligns particularly well with the valuation derived in the section below.
Exhibit 7. Next objective to $1,570 if trend continues within fibonacci range
Data: Updata.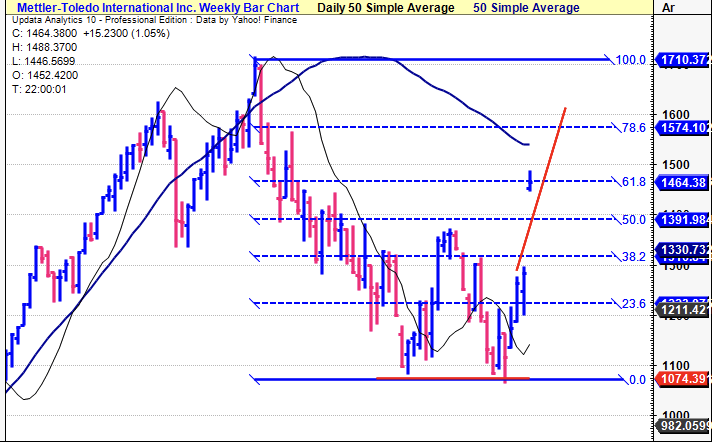
Valuation and conclusion
Consensus has MTD priced at ~37.5x forward earnings at the time of writing, implying a price target of $1,464 using our FY22 estimates.
All things considered, however [as in Exhibit 8], I advocate MTD is fairly priced at ~$1,546, or 39.6211x forward earnings of $39.04:
- 39.6211 x 39.04 = $1,546.81.
The model works to 4 decimal places, so rounding this back to just 39.6x sets a price target of $1,545. This is also the current level of MTD’s 250DMA. It aligns with technical momentum described above with MTD offering investors an equity risk premium of 1.11%.
This is also a small step above the $1,529 price target I assigned to MTD back in June. Despite a 520bps return potential, we are still talking $82 per share in potential upside. These are attractive return characteristics with an implied 7% buyback yield to be folded into the equation.
Exhibit 8. “Fair forward P/E” to FY22 EPS Est. of $39.04 implies a price target of $1,546.
Note: Fair forward price-earnings multiple calculated as 1/fair cost of equity. This is known as the ‘steady state’ P/E. For more and literature see: [M. Mauboussin, D. Callahan, (2014): What Does a Price-Earnings Multiple Mean?; An Analytical Bridge between P/Es and Solid Economics, Credit Suisse Global Financial Strategies, January 29 2014]. The FY22 price target of $1,546.81 is calculated by multiplying the fair forward P/E of 39.6211 by the FY22 EPS estimate of $39.04 [39.6211 x 39.04 = 1,546.81]. (Data: HB Insights Estimates, M. Mauboussin, D Callahan (2014): What Does a Price-Earnings Multiple Mean? An Analytical Bridge between P/Es and Solid Economics.)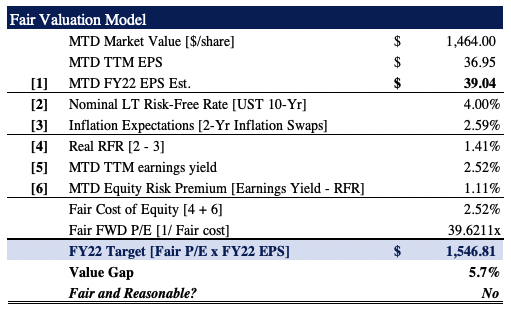
Net-net I continue to rate MTD a buy on fundamental and market factors. Management have locked in an implied 7% forward buyback yield, whereas shares have $82/share upside to run to our fair value of $1,546–$1,570. The company is set to grow earnings at c.12% per quarter into FY24 vs. the SPX’s 6–7% over the same time. Fund ownership has increased from Q2–Q3 to corroborate the data. Rate buy, target $1,546–$1,570.
Be the first to comment