

Fritz Jorgensen
Introduction
Meta Platforms Inc. (NASDAQ:META) (formerly Facebook) reported Q2 2022 results after markets closed last Wednesday (July 27). META shares fell 5.2% the following day, but have since recovered during a wider market rebound.
META stock is roughly flat from when we initiated our Buy rating back in March 2019, having halved in the past year:
|
Meta Share Price (Last 5 Years) 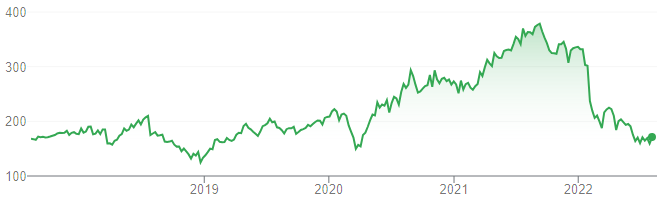 Source: Google Finance (04-Aug-22). |
Q2 2022 results was mixed. Revenues were stable in aggregate, but fell year-on-year in the core U.S. & Canada region. While there were macro headwinds, Meta did much worse than that Alphabet (GOOG). Reels grew significantly from a low base, but it is unclear if it has narrowed the gap with TikTok. More positively, the impact from Apple’s (AAPL) anti-tracking changes has not increased and is being lapped. With costs growth decelerating but still positive, Meta’s earnings have not bottomed but may do so in Q3 or Q4.
Our investment case remains based on qualitative views of Meta’s advantages and not yet supported by hard quantitative data. However, we believe shares are trading at approximately 17x 2022 EPS, making them a good investment even with relatively low earnings growth. Should 10%+ EPS growth resume as we expect, the total return can be as much as 137% (28.7% annualized). Buy.
Revenues: Stable In Total, But Signs Of Stress
For Q2 2022, Meta reported $28.2bn of Ad Revenues. Year-on-year, this represented growth of 2.9% excluding currency but a decline of 1.5% including currency.
The 2.9% year-on-year ex-currency growth was a deceleration from Q1, when Ad Revenues grew 9.6%, though both Q1 and Q2 2022 followed prior-year quarters that saw revenues grew by nearly 70% since 2019:
|
Meta Ad Revenue Growth Year-on-Year (Ex-Currency) – Stacked 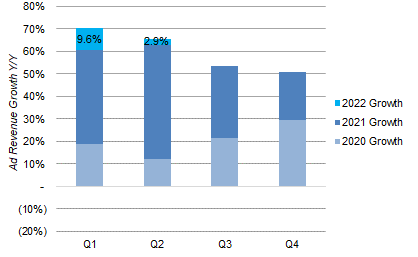 Source: Meta earnings releases. |
Macro headwinds were a factor in the deceleration. As Meta CFO Dave Wehner explained on the call:
Advertising revenue growth slowed throughout the second quarter as advertiser demand softened. The deceleration has been broad-based across verticals, and we believe businesses are lowering their advertising spend in response to the increased economic uncertainty.”
Meta’s Ad Revenue growth was the result of a 15% increase in the number of ad impressions and a 14% decline (including currency) in the average price per ad. Ad impression growth was driven by Asia Pacific and Rest of World. The decline in average price per ad was attributed to “a reduction in advertiser demand, the mix shift in ad impressions towards lower-monetizing surfaces and regions, and foreign currency depreciation”.
Meta did much worse than Alphabet on a year-on-year basis in Q2. While Meta’s Ad Revenues were 1.5% lower year-on-year in Q2 (including currency), Alphabet’s were 11.6% higher:
|
Meta & Alphabet Ad Revenues (2019 to 2022 YTD) 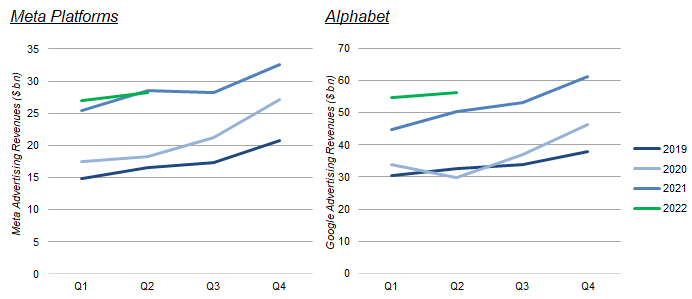 Source: Company filings. |
Compared to Q2 2019, however, both Meta and Alphabet Ad Revenues have grown by a low 70s percentage.
While Meta’s Ad Revenues were stable in aggregate (excluding currency) in Q2, they fell 4.3% year-on-year in the core U.S. & Canada region, offset by growth in Asia-Pacific and Rest of World; Ad Revenues were down 11.7% year-on-year in Europe, but we believe mostly due to currency (the Euro has fallen approximately 10% against the U.S. Dollar):
|
Meta Ad Revenues by User Geography (Since Q2 2020) 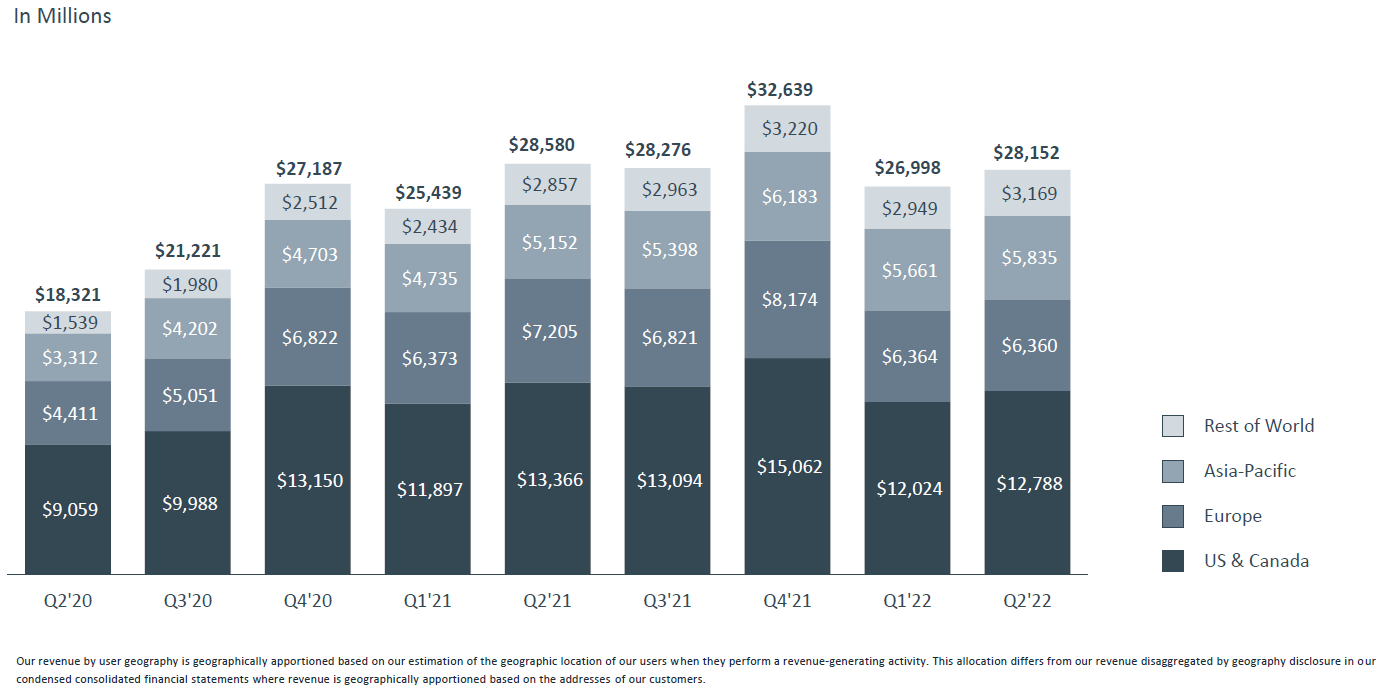 Source: Meta results presentation (Q2 2022). |
By contrast, Alphabet revenues (including non-advertising revenues) grew by double-digits year-on-year in local currencies in all regions in Q2, including by 16% in the U.S.
The comparison with Alphabet shows that Meta’s business was under more stress in Q2.
Of the two structural challenges to Meta’s business, short-form video and Apple (AAPL) anti-targeting changes, it appears to have made some progress on the former but is more obviously successful in coping with the latter.
Reels: Progress From A Low Base
During Q2 2022, Meta grew is Reels short-form video product significantly from a low base, but it is unclear if it has narrowed the gap with TikTok.
Management stated that time spent on Reels across Facebook and Instagram increased by more than 30% sequentially in Q2. (In Q1, Reels made up 20% of the time spent on Instagram in Q1.) They also confirmed that Reels was a net positive on the amount of time users spent on Meta’s Family of Apps, though with some cannibalistic impact. Both Daily Active People (“DAP”) and Monthly Active People (“MAP”) for Meta’s Family of Apps increased sequentially in Q2 (to 2.88bn and 3.65bn respectively), and the DAP/MAP ratio was stable at 79%.
|
Meta User Numbers (Since 2019) 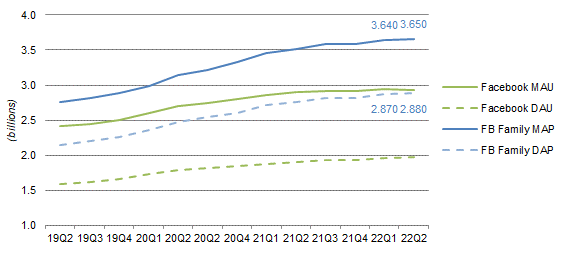 Source: Meta results releases. |
Since being launched last year, Reels ads has “now crossed $1bn annual revenue run-rate”, ahead of Stories at its equivalent stage of development. As mentioned above, Q2 ad impressions growth was driven by Asia Pacific and Rest of World, not U.S. & Canada, which implies Meta has not dramatically increased the Reels ad load in its core market.
However, Meta declined to comment if Reels has narrowed the engagement gap with TikTok, but instead gave a generic answer about Reels “doing well”, “competing very effectively” and being “on a good track”.
John Blackledge (Cowen analyst): “On Reels engagement, do you think Reels is gaining ground in terms of user engagement versus TikTok and other short-form video platforms?”
David Wehner (Meta CFO): “On Reels engagement, we’re pleased with how that is progressing. We think that we’re doing well. Obviously, there’s third-party tracking services that provide data on TikTok and other services, but we feel that we’re competing very effectively in terms of rolling out Reels on Instagram and Facebook and on both it’s growing very quickly. And we saw, as Mark mentioned, 30 percent increase from the time that people spent engaging with Reels across both Facebook and Instagram. Clearly, it’s above 20 percent of the time on Instagram and it’s growing as a percentage of time on Facebook. So we think we’re on a good track with Reels”.
Similarly, Meta declined to confirm if the total amount of time users spend with its Family of Apps has increased or decrease during Q2. It is therefore possible that Reels is not narrowing the engagement gap with TikTok.
Financially, Reels also remained far behind TikTok, which was reported to have $4bn of revenues in 2021 and to be on track to generate $12bn in 2022 (according to eMarketer, see June 23 Bloomberg article, subscription required).
Anti-Tracking Changes: Getting Better
More positively, the impact from Apple’s anti-tracking changes has not increased and is being lapped. As incoming CFO Susan Li commented on the follow-up call:
Apple’s IDFA (Identifier for Advertisers) changes remain a headwind to revenue and to things like measurement and targeting in Q2, but it was not a contributor to the sequential deceleration in year-over-year growth relative to Q1. And, in fact, we started to see a benefit to year-over-year growth throughout Q2 because we were lapping the increased adoption of iOS 14.5 from a year ago, and we’ll get a further tailwind in Q3 as we lap the full first quarter of iOS impact.”
As a reminder, most of Apple’s anti-tracking changes were introduced with iOS 14.5 in April 2021, but the impact became more substantial during Q3 after Apple pushed most of its users to update their devices over the summer. As Meta laps iOS 14.5’s launch and adoption by users, its revenue growth should reaccelerate.
In addition, Meta has continued to develop technological solutions to improve its measurement and targeting, as well as to make it easier for users to engage with businesses in Meta’s own apps, for example Click-to-Messaging, now a “multi-billion-dollar business” where management “continue to see strong double-digit year-over-year growth”.
Expense Growth Drove Earnings Decline
Meta earnings are falling because costs are still growing, albeit at a decelerating pace.
Family of Apps EBIT fell 24.6% year-on-year in Q2, after Costs & Expenses rose 23.1% while revenues fell 1.4%. Costs & Expense growth included a significant increase in employee expenses, with group-wide headcount up 32%. Sequentially, Family of Apps EBIT fell 2.8% from Q1.
Reality Labs EBIT in Q2 was helped by a $472m reduction in loss reserves after management raised prices on Quest 2 devices. Excluding this, EBIT loss was $3.38bn, worsening 34.8% year-on-year and 10.7% sequentially.
|
Meta Revenues & EBIT by Segment (Q2 2022 vs. Prior Periods) 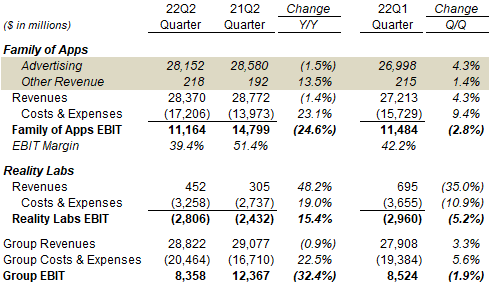 Source: Meta earnings releases. |
Year-on-year, EBIT fell 32.4%, Net Income fell 35.7% while EPS fell 31.8%, the latter mitigated by a 5.7% reduction in the share count after buybacks. CapEx rose $3bn year-on-year as servers were delivered and data center construction milestones were reached as scheduled:
|
Meta P&L (Q2 2022 vs. Prior Periods) 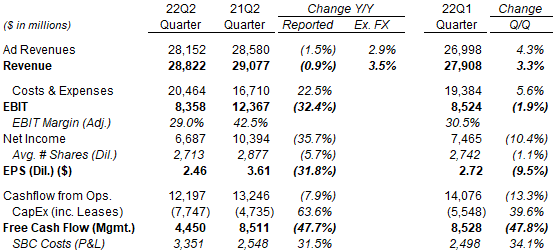 Source: Meta results releases. |
Sequentially, EBIT fell 1.9% but Net Income fell 10.4%, due to mark-to-market losses on equity investments and a higher effective tax rate.
Earnings Have Not Yet Bottomed
Earnings have not yet bottomed because revenues are expected to decline in Q3 but expenses are still increasing.
Meta has guided to Q3 total revenues of $26-28.5bn, after approximately 6 ppt of currency headwind. At mid-point, this implies a year-on-year decline of 6.1%, or roughly zero excluding currency. Compared to Q2 total revenues of $28.8bn, the range implies a sequential decline.
Management expects “headcount growth will slow throughout the year” and talked about “slower hiring”, but headcount is still increasing. Similarly, while the outlook for 2022 full-year expenses has been cut from $87-92bn to $85-88bn, the implied H2 expense figure is still larger than that in H1 ($39.8bn). So expenses are likely to increase again in Q3.
Taking the $27.3bn mid-point of the Q3 revenue outlook, and assuming a similar 6% year-on-year revenue decline in Q4, we arrive at full-year 2022 total revenue of $115.6bn, down 2% year-on-year:
|
FB Quarterly Revenues – Historic & Our Forecasts (2020-22) 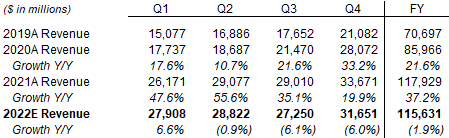 Source: FB company filings, Librarian Capital estimates. |
Using the $86.5bn mid-point of the expenses outlook, this implies EBIT will decline by approx. 38% in 2022:
|
FB Key P&L Items – Historic & Our Forecasts (2018-22) 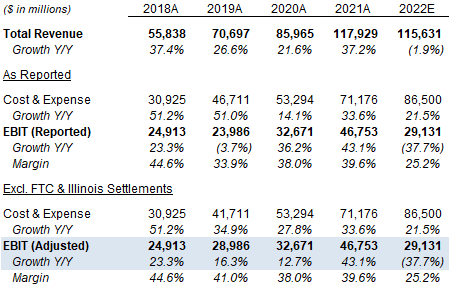 Source: Meta company filings, Librarian Capital estimates. |
At last quarter’s results, CEO Mark Zuckerberg committed to growing Meta’s overall EBIT, though not in 2022. To achieve this, it seems reasonable to assume that expense growth will be less than revenue growth in 2023. (2023 budgets are still being prepared, so there is no expense outlook for next year.)
If we assume revenue growth will resume and expense growth be less than revenue growth in 2023, then Meta earnings will trough in either Q3 or Q4 this year.
Qualitative Strengths, But Not Yet Quantitative Data
Meta’s success ultimately depends on its ability to keep users engaged on its platform, to serve users a good number of ads that fit their attributes, and to be able to demonstrate the ads’ impact to advertisers.
We believe Meta will succeed in these because of its structural advantages, including its scale, its existing ecosystem of users, content creators and advertisers, its targeting and measuring technologies, the network effect, etc.
However, Q2 only provided mixed quantitative data on whether Meta is succeeding, as revenues were merely stable, with signs of stress in some markets. It is likely that Meta has prioritized growing Reels’ reach over revenues, but management has not provided data that Reels is indeed catching up to TikTok.
Our investment case thus remains based on qualitative views of Meta’s advantages, and not yet quantitative data.
However, we believe shares are trading at approximately 17x 2022 EPS, and would be a good investment even with relatively low earnings growth.
Valuation: META Stock Key Metrics
At $170.57, relative to 2021 financials, Meta stock is trading at a 11.8x P/E and a 5.1% Free Cash Flow (“FCF”) Yield:
|
Meta Net Income & Cashflows (2018-21) 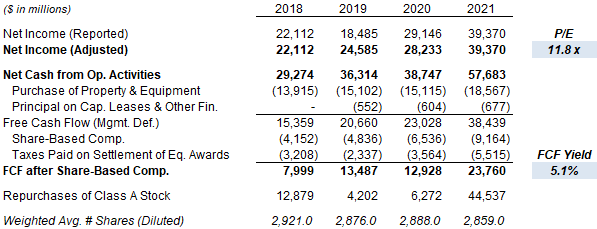 Source: Meta company filings. |
If we assume a 33% decline in both EPS and FCF this year, then Meta stock is at a 16.6x P/E and a 3.4% FCF Yield. This undemanding valuation means Meta would be a good investment even with relatively low earnings growth.
Meta had $40.5bn of cash at the end of Q2, equivalent to 8.7% of its market capitalization.
What Is META Stock’s 2025 Forecast?
We update our 2022 forecasts, but keep other assumptions unchanged:
- 2022 Net Income decline of 38% (was 22%)
- 2022 share count to fall by 6% (was 3%)
- From 2023, Net Income to grow by 10% each year
- From 2023, share count to fall by 3% a year
- P/E at 30.0x at exit
- No dividends
The new 2025 EPS forecast of $13.46 is 19% lower than before ($16.56). EPS is forecasted to be slightly down in 2021-25, despite large buybacks, as our 2025 Net Income is still 16% lower than in 2019:
|
Illustrative Meta Return Forecasts 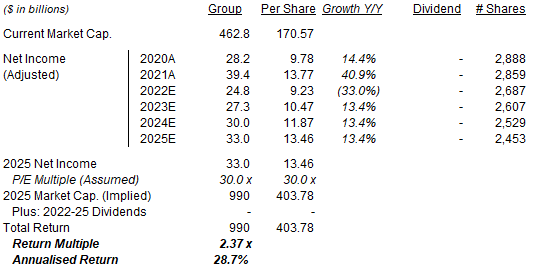 Source: Librarian Capital estimates. |
With Meta stock at $170.57, we expect an exit price of $404 and a total return of 137% (28.9% annualized) by 2025 year-end.
Is META Stock A Buy, Sell, or Hold? Conclusion
We reiterate our Buy rating on Meta Platforms stock.
Be the first to comment