

andresr/E+ via Getty Images
Warren Buffett may have started out as a “cigar-butt” investor, trying to buy $1 for $0.50.
But in 1978 Charlie Munger joined Berkshire (BRK.B) and is credited with teaching Buffett the true secret to life-changing investing success.
It’s better to buy a wonderful company at a fair price, than a fair company at a wonderful price”. – Warren Buffett
That’s because while cigar-butt investing can help you potentially earn 2X or 3X your money, buying the world’s greatest companies at reasonable prices can generate life-changing returns.
Take the example of Mastercard (NYSE:MA), a classic Buffett-style, wide moat, “wonderful company at a fair price”.
Mastercard Total Returns Since 2007
(Source: Portfolio Visualizer Premium)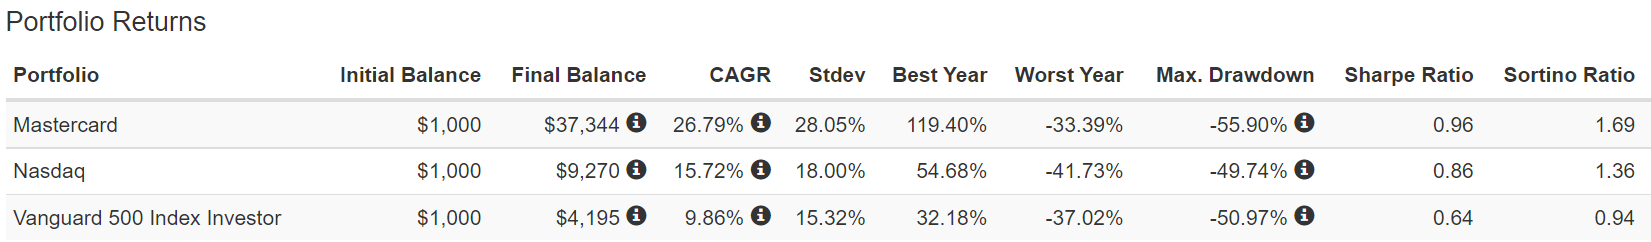
In the last 15 years, Mastercard has delivered Nasdaq smashing 27% annual returns turning $1 into $37 ($27 adjusted for inflation).
These are the kind of returns that cigar-butt investing can’t hope to deliver but the world’s best hyper-growth blue-chips can.
And Mastercard isn’t just ANY hyper-growth blue-chip. It’s a company whose safety, quality, risk-management prowess, balance sheet, and obscene profitability are the stuff of legend.
- I consider it the world’s single greatest company
That’s why it’s my #1 priority company in my correction watchlist and planning tool.
So let me show you the three reasons why NOW is a potentially good time to add Mastercard to your diversified and prudently risk-managed portfolio.
Could the 2022 correction continue? Yes.
Could a potential recession in 2023 or 2024 send the market skidding into a bear market? Absolutely.
Could soaring interest rates continue to hurt growth stocks? You bet.
But no matter what happens with the economy, interest rates, or the stock market in the coming years, there is one thing I can say with high confidence.
Anyone buying Mastercard today is likely to feel like a stock market genius in 5+ years.
That’s because Mastercard is potentially the world’s greatest company, and could triple your money over the next five years.
Mastercard 2027 Consensus Return Potential
FAST Graphs, FactSet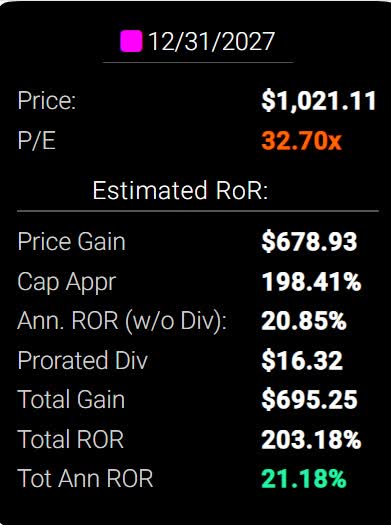
Reason One: One Of The Greatest Companies On Earth
The Dividend King’s overall quality scores are based on a 241 point model that includes:
-
dividend safety
-
balance sheet strength
-
credit ratings
-
credit default swap medium-term bankruptcy risk data
-
short and long-term bankruptcy risk
-
accounting and corporate fraud risk
-
profitability and business model
-
growth consensus estimates
-
management growth guidance
-
historical earnings growth rates
-
historical cash flow growth rates
-
historical dividend growth rates
-
historical sales growth rates
-
cost of capital
-
long-term risk-management scores from MSCI, Morningstar, FactSet, S&P, Reuters’/Refinitiv, and Just Capital
-
management quality
-
dividend friendly corporate culture/income dependability
-
long-term total returns (a Ben Graham sign of quality)
-
analyst consensus long-term return potential
It actually includes over 1,000 metrics if you count everything factored in by 12 rating agencies we use to assess fundamental risk.
How do we know that our safety and quality model works well?
During the two worst recessions in 75 years, our safety model 87% of blue-chip dividend cuts, the ultimate baptism by fire for any dividend safety model.
How does Mastercard score on one of the world’s most comprehensive and accurate safety and quality models?
MA Dividend Safety
| Rating | Dividend Kings Safety Score (151 Point Safety Model) | Approximate Dividend Cut Risk (Average Recession) |
Approximate Dividend Cut Risk In Pandemic Level Recession |
| 1 – unsafe | 0% to 20% | over 4% | 16+% |
| 2- below average | 21% to 40% | over 2% | 8% to 16% |
| 3 – average | 41% to 60% | 2% | 4% to 8% |
| 4 – safe | 61% to 80% | 1% | 2% to 4% |
| 5- very safe | 81% to 100% | 0.5% | 1% to 2% |
| MA | 100% | 0.50% | 1.00% |
| Risk Rating | Low Risk (77th industry percentile consensus) | A+ stable outlook credit rating 0.6% 30-year bankruptcy risk | 20% OR LESS Max Risk Cap Recommendation |
Long-Term Dependability
| Company | DK Long-Term Dependability Score | Interpretation | Points |
| Non-Dependable Companies | 21% or below | Poor Dependability | 1 |
| Low Dependability Companies | 22% to 60% | Below-Average Dependability | 2 |
| S&P 500/Industry Average | 61% (58% to 70% range) | Average Dependability | 3 |
| Above-Average | 71% to 80% | Very Dependable | 4 |
| Very Good | 81% or higher | Exceptional Dependability | 5 |
| MA | 100% | Exceptional Dependability | 5 |
Overall Quality
| MA | Final Score | Rating |
| Safety | 100% | 5/5 Very Safe |
| Business Model | 100% | 3/3 Wide Moat |
| Dependability | 100% | 5/5 Exceptional |
| Total | 100% | 13/13 Ultra SWAN |
| Risk Rating | 3/3 low Risk | |
| 20% OR LESS Max Risk Cap Rec |
20% Margin of Safety For A Potentially Good Buy |
MA: The #1 Highest Quality Master List Company (Out of 509) = 100th Percentile
The DK 500 Master List includes the world’s highest quality companies including:
-
All dividend champions
-
All dividend aristocrats
-
All dividend kings
-
All global aristocrats (such as BTI, ENB, and NVS)
-
All 13/13 Ultra Swans (as close to perfect quality as exists on Wall Street)
- 47 of the world’s best growth stocks (on its way to 100)
MA’s 100% quality score means its similar in quality to such blue-chips as
- Microsoft (MSFT)
- Visa (V)
- ASML Holding (ASML)
- West Pharmaceutical Services (WST) – dividend champion
- W.W. Grainger (GWW) – dividend king
- S&P Global (SPGI)
- Nike (NKE)
- NVIDIA (NVDA)
- Adobe (ADBE)
- Stanley Black & Decker (SWK) – dividend king
- Dover (DOV) – dividend king
- Amazon (AMZN)
Even among the most elite companies on earth, MA is higher quality than all of them.
Why You Should Trust Mastercard With Your Hard-Earned Savings
Founded in 1966 in Purchase NY, MA is the world’s 2nd oldest and largest payment processor behind Visa.
MA had $7.7 trillion in purchases over its network in 2021 and by 2024 that’s expected to grow to $10.6 billion.
- 11.2% CAGR volume growth
- driving double-digit revenue growth
MA’s network is accepted by about 10 million global merchants and linked to 5,500 global financial institutions.
- 650 billion transactions per year
- generating 16 billion valuable data points for partners
MA’s revenue is 32% from the US and 68% international.
Investment Thesis Summary
Mastercard has multiple characteristics that should draw investors’ attention.
First, despite the evolution in the payment space, we think a wide moat surrounds the business and view Mastercard’s position in the current global electronic payment infrastructure as essentially unassailable.
Second, Mastercard benefits from the ongoing shift toward electronic payments, which provides plenty of opportunities to utilize its wide moat to create value over the long term.” – Morningstar
Mastercard is one of the best companies to own if you believe in the “war on cash” with a moat that Morningstar describes as “virtually unassailable”.
Mastercard has reached essentially universal acceptance in most developed markets. While the network effect is the initial and primary driver of economic moats in the space, the highly scalable nature of payment processing leads to sizable cost advantages for large payment networks, which further cements their competitive positions.” – Morningstar
A lot of investors understandably worry that MA’s dominance is fading and it could be disrupted by new technology like blockchain and other forms of fintech.
No less than Chamath Palihapitiya, the king of SPACs, has said to short Mastercard and Visa (V).
YCharts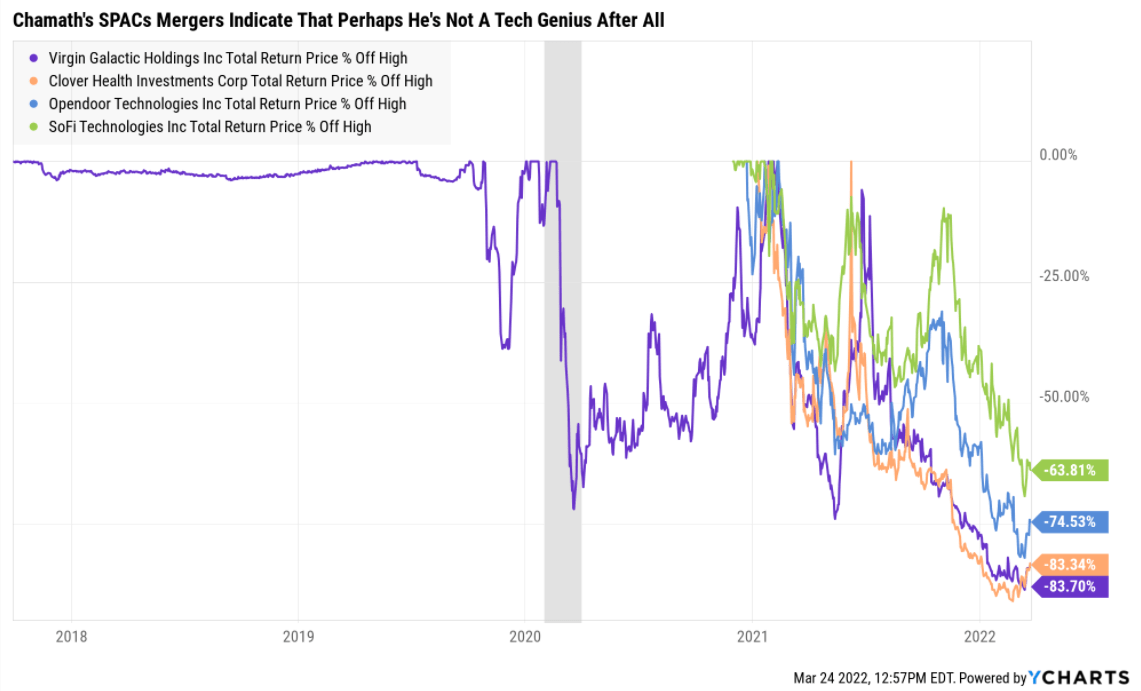
Given that Chamath’s SPAC mergers are down 64% to 84% from their record highs, I’m not losing sleep over his predictions that Mastercard is a dinosaur with one foot in the grave.
We’re also expanding in payments by capturing new payment flows including commercial, B2B accounts payable, bill pay, and cross-border remittances…
We’re making great progress in expanding contactless acceptance by turning the world’s billions of active smartphones into potential acceptance devices, enabling people to buy and sell whenever wherever they want. We now have 100 deployments of Tap on Phone in over 50 markets with leading partners globally…
We’re also bringing capabilities, experience and reach to help enable the crypto ecosystem. Our new collaboration with Coinbase will allow consumers to use their Mastercard to purchase NFTs, tried that myself… ” – CEO Q4 conference call
Mastercard is aware that blockchain could make its business obsolete, and so is investing with and partnering with the crypto industry to ensure that it has a vital role in the future of digital payments.
Our work with ConsenSys will make it easier for software developers to increase the scale, efficiency and speed of transactions on Ethereum and permissioned blockchains. And our CBDC [ph] Sandbox Test Platform, which we launched in 2020 continues to gain traction. We’re helping central banks, financial institutions and fintechs simulate the issuance and distribution of CBDC along with the integration of CBDDs with our card network, our real-time payment modules and native blockchain wallets.
” – CEO Q4 conference call
When digital versions of global currencies launch, MA is prepared to process transactions on the Digital Dollar and Digital Euro.
- also building out payment rails for stablecoins like GUSD, USDC, BUSD, and Tether
MA is doubling down on AI and deep learning to improve its value proposition to customers.
In December, we announced an agreement to acquire Dynamic Yield from McDonald’s. Dynamic Yield uses enhanced AI to deliver customized product recommendations, offers, and content to consumers. Their customer set includes over 400 global brands ranging from financial services companies like Synchrony to retailers like Lens End. When combined with SessionM’s loyalty platform and our Test & Learn experimentation software, we will be able to offer a unified consumer engagement and loyalty hub to our customers.” – CEO Q4 conference call
MA’s $7.7 trillion in processing volume is about 3% global market share in all digital transactions.
- a long potential growth runway left for MA and V
Of that $255 trillion MA is currently targeting $115 trillion (6.6% market share)
Its acquisitions are designed to let it effectively compete in the remaining $130 trillion digital payments market.
- a market that’s growing at a rapid pace
- MA is involved with blockchain, buy-now-pay-later, and DeFi (web 3.0 and digital identity)
MA is working with the world’s leading Fintechs, including AfterPay and Gemini, who are using its developer tools and APIs.
Mastercard’s business model is a natural fit for buy-now-pay-later and its launching its own version of this popular service in the US, UK, and Australia in 2022.
It’s partnering with leading financial institutions and Fintechs such as Synchrony, Barclay’s, and SoFi, to avoid being disrupted.
Remittances are a $32 trillion global market and the original killer app for crypto.
Mastercard is working with over 650 global distribution partners like MoneyGram (MGI), Western Union (WU), PayPal (PYPL), Citi (C), and SoFi (SOFI) to get its piece of this market.
- 45% volume growth in the last year
- 2% of all MA revenue
Commercial point of sales, for things like small business and corporate cards, is a $14 trillion market that brings in 7% of MA’s revenue and is growing at 13% annually.
Business-2-Business transactions are 2% of MA’s sales and growing at 20% annually.
Consumer bill pay is an $8 trillion global market that currently makes up 2% of MA’s sales.
In 2021 35% of MA’s revenue came from new services it launched since 2012.
MA’s service revenue has been growing at 21% annually since 2018 including 24% in 2021.
Most of MA’s service revenue is monthly recurring revenue.
- the fastest part of the business is generating the most stable revenue and cash flow
- justifying a higher multiple over time (which MA investors have enjoyed since 2012)
MA is not a dinosaur that’s letting itself be disrupted (neither is Visa).
80% of America’s top 20 retailers use at least one of MA’s newer services, and the company has over 600 patents and more than 2,000 data scientists working for it.
- 8% of MA’s workforce is data scientists
People care about their money… a lot.
Unless financial transactions are secure, mass adoption of DeFi will never happen.
MA is working hard to enable that adoption and has made numerous investments to ensure it will profit from web 3.0 and the future of finance, data, and the internet.
- Mastercard started out as a financial transaction company
- it’s now become a financial data company
MA isn’t just partnering with crypt and fintech companies, but the world’s most trusted cloud computing giants, Microsoft and Amazon.
MA is disrupting traditional banking, in over 60 countries.
Bottom Line: Mastercard is pivoting well to avoid being disrupted.
Through 2024 MA management thinks it can generate 17% to 19% annual sales growth and 20% to 22% EPS growth.
MA Credit Ratings
| Rating Agency | Credit Rating | 30-Year Default/Bankruptcy Risk | Chance of Losing 100% Of Your Investment 1 In |
| S&P | A+ stable | 0.60% | 166.7 |
| Moody’s | A1 (A+ equivalent) stable | 0.60% | 166.7 |
| Consensus | A+ stable | 0.60% | 166.7 |
(Sources: S&P, Moody’s)
Mastercard’s balance sheet is a fortress with rating agencies estimating its fundamental risk at 0.6%.
That means if you buy MA today the risk of losing all your money over the long-term is approximately 1 in 167.
MA Leverage Consensus Forecast
| Year | Debt/EBITDA | Net Debt/EBITDA (3.0 Or Less Safe According To Credit Rating Agencies) |
Interest Coverage (8+ Safe) |
| 2020 | 1.41 | 0.23 | 21.46 |
| 2021 | 1.27 | 0.49 | 23.80 |
| 2022 | 1.00 | 0.15 | 28.88 |
| 2023 | 0.83 | -0.16 | 34.45 |
| 2024 | 0.72 | -0.17 | 42.09 |
| 2025 | NA | 0.02 | NA |
| Annualized Change | -15.55% | -41.19% | 18.34% |
(Source: FactSet Research Terminal)
That’s balance sheet is expected to get stronger over time.
MA Balance Sheet Consensus Forecast
| Year | Total Debt (Millions) | Cash | Net Debt (Millions) | Interest Cost (Millions) | EBITDA (Millions) | Operating Income (Millions) | Average Interest Rate |
| 2020 | $12,348 | $10,113 | $1,973 | $380 | $8,734 | $8,154 | 3.08% |
| 2021 | $13,901 | $7,421 | $5,421 | $431 | $10,984 | $10,258 | 3.10% |
| 2022 | $13,589 | $10,215 | $2,067 | $440 | $13,556 | $12,706 | 3.24% |
| 2023 | $13,589 | $13,056 | -$2,574 | $448 | $16,334 | $15,433 | 3.30% |
| 2024 | $13,901 | $15,887 | -$3,315 | $437 | $19,336 | $18,392 | 3.14% |
| 2025 | NA | NA | $377 | NA | $23,732 | $22,956 | NA |
| Annualized Growth | 3.01% | 11.95% | -28.18% | 3.56% | 22.13% | 23.00% | 0.53% |
(Source: FactSet Research Terminal)
MA’s cash position is growing at 12%, its cash flows at over 20%, and its net debt is expected to remain near zero.
Long-term interest costs are expected to remain stable at around 3% despite rising global rates.
MA Bond Profile
- $14.5 billion in liquidity
- well staggered debt maturities (little problem refinancing maturing bonds)
- 100% unsecured bonds (maximum financial flexibility)
- bond investors are so confident in MA’s long-term energy transition plan they are willing to lend to it for 29 years at 3.6%
- does this sound like a company the bond market is worried could be disrupted into oblivion?
- 3.11% average borrowing cost
- 0.9% inflation-adjusted borrowing costs vs 43% cash returns on invested capital
MA Profitability: Wall Street’s Favorite Quality Proxy
(Source: Gurufocus Premium)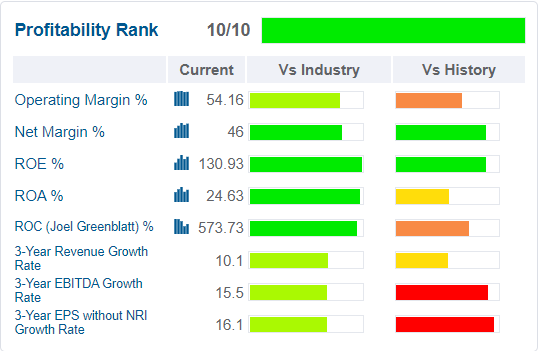
MA’s historical profitability is right at the top of its industry.
MA Trailing 12-Month Profitability Vs Peers
| Metric | Industry Percentile | Major Credit Services Companies More Profitable Than MA (Out Of 535) |
| Operating Margin | 79.62 | 109 |
| Net Margin | 81.47 | 99 |
| Return On Equity | 99.02 | 5 |
| Return On Assets | 97.20 | 15 |
| Return On Capital | 94.92 | 27 |
| Average | 90.45 | 51 |
(Source: Gurufocus Premium)
In the last year, profitability was in the top 9% of peers.
MA’s industry-leading profitability has been stable or improving for over 15 years, confirming a wide and stable moat.
- 46% free cash flow margins are in the top 1% of all global companies
MA Profit Margin Consensus Forecast
| Year | FCF Margin | EBITDA Margin | EBIT (Operating) Margin | Net Margin | Return On Capital Expansion |
Return On Capital Forecast |
| 2020 | 44.9% | 57.1% | 53.3% | 42.5% | 1.17 | |
| 2021 | 47.8% | 58.2% | 54.3% | 44.0% | TTM ROC | 573.73% |
| 2022 | 45.9% | 60.3% | 56.6% | 44.9% | Latest ROC | 622.46% |
| 2023 | 47.7% | 61.9% | 58.5% | 46.6% | 2025 ROC | 672.32% |
| 2024 | 46.0% | 63.1% | 60.1% | 47.9% | 2025 ROC | 729.42% |
| 2025 | 47.9% | 65.8% | 63.7% | 51.9% | Average | 700.87% |
| 2026 | NA | NA | NA | NA | Industry Median | 4.78% |
| Annualized Growth | 1.32% | 2.89% | 3.62% | 4.10% | MA/Peers | 146.62 |
| Vs S&P | 48.00 |
(Source: FactSet Research Terminal)
MA’s incredible profitability is expected to keep improving through at least 2025.
- free cash flow margins approaching 50%
Return on capital is annual pre-tax profit/operating capital (the money it takes to run the business). ROC is Greenblatt’s gold standard proxy for quality and moatiness.
- S&P 500 ROC is 14.6%
- for each $1 it takes to run the average S&P company they generate $14.6 in annual pre-tax profit
- it takes about 6.5 years for new investments to pay for themselves
For MA ROC is currently over 500% and is expected to rise to about 700%.
- for every $1 it takes to run MA, MA is currently generating $6.22 in annual pre-tax profit
- investments take 2 months to pay for themselves
By the definition of one of the greatest investors in history, MA is about 147X higher quality than its peers and 48X higher quality than the S&P 500.
MA Dividend Consensus Forecast
| Year | Dividend Consensus | EPS/Share Consensus | Payout Ratio | Retained (Post-Dividend) Earnings | Buyback Potential | Debt Repayment Potential |
| 2021 | $1.76 | $8.40 | 21.0% | $6,507 | 2.05% | 46.8% |
| 2022 | $1.82 | $10.41 | 17.5% | $8,418 | 2.65% | 60.6% |
| 2023 | $1.98 | $12.89 | 15.4% | $10,692 | 3.37% | 78.7% |
| 2024 | $2.29 | $15.68 | 14.6% | $13,122 | 4.13% | 96.6% |
| 2025 | $5.25 | $20.98 | 25.0% | $15,415 | 4.86% | 110.9% |
| Total 2021 Through 2025 | $13.10 | $68.36 | 19.2% | $54,154.80 | 17.06% | 389.57% |
| Annualized Rate | 31.42% | 25.71% | 4.54% | 24.06% | 24.06% | 24.06% |
(Source: FactSet Research Terminal)
Rating agencies consider 60% a safe payout ratio for this industry and MA is expected to average 19% through 2025.
- a 130% dividend hike forecast from at least 1 analyst in 2025 would raise the payout ratio from 15% to 25%
- $54 billion in post-dividend retained earnings
- enough to pay off existing debt almost 4X
- or buy back 17% of shares at current valuations
| Year | Consensus Buybacks ($ Millions) | % Of Shares (At Current Valuations) | Market Cap |
| 2022 | $7,330.0 | 2.3% | $317,475 |
| 2023 | $5,683.0 | 1.8% | $317,475 |
| 2024 | $10,907.0 | 3.4% | $317,475 |
| Total 2022 Through 2024 | $23,920.00 | 7.5% | $317,475 |
| Annualized Rate | 2.57% | Average Annual Buybacks | $7,973.33 |
(Source: FactSet Research Terminal)
MA’s historical net buyback rate is 3.3% CAGR and analysts expect about 2.6% in the future. How impressive is that buy-back rate?
| Time Frame (Years) | Net Buyback Rate | Shares Remaining | Net Shares Repurchased |
| 5 | 2.6% | 87.66% | 12.34% |
| 10 | 2.6% | 76.84% | 23.16% |
| 15 | 2.6% | 67.36% | 32.64% |
| 20 | 2.6% | 59.04% | 40.96% |
| 25 | 2.6% | 51.76% | 48.24% |
| 30 | 2.6% | 45.37% | 54.63% |
| 35 | 2.6% | 39.77% | 60.23% |
| 40 | 2.6% | 34.86% | 65.14% |
| 45 | 2.6% | 30.56% | 69.44% |
| 50 | 2.6% | 26.79% | 73.21% |
| 55 | 2.6% | 23.48% | 76.52% |
| 60 | 2.6% | 20.58% | 79.42% |
| 65 | 2.6% | 18.04% | 81.96% |
| 70 | 2.6% | 15.82% | 84.18% |
| 75 | 2.6% | 13.87% | 86.13% |
| 80 | 2.6% | 12.15% | 87.85% |
| 85 | 2.6% | 10.65% | 89.35% |
| 90 | 2.6% | 9.34% | 90.66% |
| 95 | 2.6% | 8.19% | 91.81% |
| 100 | 2.6% | 7.18% | 92.82% |
(Source: DK Research Terminal, FactSet Research)
If MA repurchases the shares analysts expect the share count would fall by 23% in a decade, and by 55% over the next 30 years.
Bottom line, Mastercard isn’t just a great company, it’s arguably the 2nd best company on earth.
Reason Two: Strong Growth Prospects For Decades To Come
We’ve already seen how Mastercard has a very long growth runway in its traditional business but is also partnering with crypto companies, Buy-Now-Pay later, and other fintechs to expand its addressable market even more.
What kind of growth could that lead to in the next few years?
MA Medium-Term Consensus Forecast
| Year | Sales | Free Cash Flow | EBITDA | EBIT (Operating Income) | Net Income |
| 2020 | $15,301 | $6,872 | $8,734 | $8,154 | $6,500 |
| 2021 | $18,884 | $9,022 | $10,984 | $10,258 | $8,300 |
| 2022 | $22,468 | $10,320 | $13,556 | $12,706 | $10,092 |
| 2023 | $26,403 | $12,584 | $16,334 | $15,433 | $12,314 |
| 2024 | $30,623 | $14,091 | $19,336 | $18,392 | $14,675 |
| 2025 | $36,063 | $17,292 | $23,732 | $22,956 | $18,730 |
| Annualized Growth | 18.70% | 20.27% | 22.13% | 23.00% | 23.57% |
(Source: FactSet Research Terminal)
Mastercard isn’t just a giant and very safe blue-chip, it’s a giant and very safe blue-chip that’s growing like a weed.
| Metric | 2021 Growth Consensus | 2022 Growth Consensus | 2023 Growth Consensus | 2024 Growth Consensus (Bond Market Recession Forecast) |
2025 Growth Consensus |
| Sales | 25% | 20% | 17% | 16% | 18% |
| Dividend | 10% | 11% (Official) | 9% | 16% | 129% (payout ratio rising to about 25%) |
| EPS | 37% | 17% | 22% | 18% | 34% |
| Operating Cash Flow | 37% | 17% | 18% | 22% | 59% |
| Free Cash Flow | 33% | 16% | 20% | 13% | NA |
| EBITDA | 27% | 23% | 20% | 19% | NA |
| EBIT (operating income) | 27% | 25% | 22% | 18% | NA |
(Source: FAST Graphs, FactSet Research Terminal)
One that some analysts expect to grow the dividend at double digits until 2025 when it more than doubles the dividend.
MA Long-Term Growth Outlook
- 22.0% to 25.4% CAGR growth consensus range
- 2% to 27% growth consensus range among the individual analysts (one at 2% and the rest between 20% to 27%)
- 22.0% CAGR median among all 37 analysts
How accurate are analysts at forecasting MA’s earnings growth?
- smoothing for outliers historical margins of error are 10% to the downside and 15% to the upside
- 19% to 30% CAGR margin-of-error adjusted growth consensus range
MA’s historical growth rates range from 4% to 31% depending on the time frame.
Currently, analysts expect 22% growth, similar to the last 14 years, and that’s also what management is guiding for.
Ok, so we have exceptional quality, and growth potential to make grown men weep with joy. And all this can be had for a very reasonable valuation.
Reason Three: A Wonderful Company At A Fair Price
Over the last 15 years, outside of bear markets and bubbles, billions of global investors have determined that 28.5 to 34.5X earnings is fair value for MA.
- 91% statistical probability that this is the fair value range for MA
| Metric | Historical Fair Value Multiples (13-year) | 2021 | 2022 | 2023 | 2024 |
12-Month Forward Fair Value |
| 5-Year Average Yield | 0.52% | $338.46 | $376.92 | $376.92 | $440.38 | |
| 13-Year Median Yield | 0.47% | $374.47 | NA | NA | $487.23 | |
| 25-Year Average Yield% | 0.46% | $382.61 | NA | NA | $497.83 | |
| Earnings | 31.24 | $262.42 | $323.65 | $400.50 | $489.84 | |
| Average | $331.97 | $348.26 | $388.35 | $477.71 | $357.51 | |
| Current Price | $345.41 | |||||
|
Discount To Fair Value |
-4.05% | 0.82% | 11.06% | 27.69% | 3.38% | |
|
Upside To Fair Value (NOT Including Dividends) |
-3.89% | 0.82% | 12.43% | 38.30% | 3.50% | |
| 2022 EPS | 2023 EPS | 2022 Weighted EPS | 2023 Weighted EPS | 12-Month Forward EPS | 12-Month Average Fair Value Forward PE |
Current Forward PE |
| $10.36 | $12.82 | $7.97 | $2.96 | $10.93 | 32.7 | 31.6 |
(Source: DK Research Terminal, FactSet)
MA is worth about 33X earnings and today trades at under 32.
- cash adjusted PE (EV/EBITDA) is 26.0
Is paying 26X EV/EBITDA for the world’s 2nd best company growing at 22% reasonable?
- Peter Lynch would say so, EV/EBITDA PEG ratio 1.18 vs S&P 500’s 1.56
|
Analyst Median 12-Month Price Target |
Morningstar Fair Value Estimate |
| $433.26 (33.8 PE) | $369.00 (33.8 PE) |
|
Discount To Price Target (Not A Fair Value Estimate) |
Discount To Fair Value |
| 20.31% | 6.44% |
|
Upside To Price Target (Not Including Dividend) |
Upside To Fair Value (Not Including Dividend) |
| 25.49% | 6.88% |
|
12-Month Median Total Return Price (Including Dividend) |
Fair Value + 12-Month Dividend |
| $435.22 | $370.96 |
|
Discount To Total Price Target (Not A Fair Value Estimate) |
Discount To Fair Value + 12-Month Dividend |
| 20.67% | 6.93% |
|
Upside To Price Target ( Including Dividend) |
Upside To Fair Value + Dividend |
| 26.06% | 7.45% |
(Source: DK Research Terminal, FactSet, Morningstar)
Morningstar and analysts think MA is worth slightly more than I do and that it could deliver 26% total returns in the next year alone.
I don’t care about 12-month forecasts, I do care about margin of safety.
| Rating | Margin Of Safety For Low-Risk 13/13 Ultra Quality Companies | 2022 Price | 2023 Price |
12-Month Forward Fair Value |
| Potentially Reasonable Buy | 0% | $348.26 | $388.35 | $357.51 |
| Potentially Good Buy | 5% | $330.85 | $368.93 | $25.53 |
| Potentially Strong Buy | 15% | $296.02 | $330.10 | $22.85 |
| Potentially Very Strong Buy | 25% | $248.13 | $291.26 | $20.16 |
| Potentially Ultra-Value Buy | 35% | $226.37 | $252.43 | $17.47 |
| Currently | $345.41 | 0.82% | 11.06% | 3.38% |
| Upside To Fair Value (Not Including Dividends) | 0.82% | 12.43% | 3.50% |
(Source: DK Research Terminal, FactSet)
For anyone comfortable with its risk profile, MA is a potentially reasonable buy, and here’s why.
Consensus Return Potential That’s Far Superior To The S&P
For context, here’s the return potential of the 18% overvalued S&P 500.
| Year | EPS Consensus | YOY Growth | Forward PE | Blended PE | Overvaluation (Forward PE) |
Overvaluation (Blended PE) |
| 2021 | $206.32 | 50.39% | 20.7 | 21.4 | 20% | 22% |
| 2022 | $225.15 | 9.13% | 20.0 | 20.4 | 16% | 16% |
| 2023 | $247.63 | 9.98% | 18.2 | 19.1 | 6% | 9% |
| 2024 | $274.54 | 10.87% | 16.4 | 17.3 | -4% | -2% |
| 12-Month forward EPS | 12-Month Forward PE | Historical Overvaluation | PEG | 25-Year Average PEG | S&P 500 Dividend Yield |
25-Year Average Dividend Yield |
| $227.41 | 19.839 | 17.88% | 2.33 | 3.62 | 1.44% | 2.01% |
(Source: DK S&P 500 Valuation And Total Return Tool)
Stocks have already priced in 96% EPS growth from 2020 through 2024 and are trading at 18.5X forward earnings.
- 16.84 is the 25-year average
- 14% correction needed to get back to historical market fair value
S&P 500 2027 Consensus Return Potential
| Year | Upside Potential By End of That Year | Consensus CAGR Return Potential By End of That Year | Probability-Weighted Return (Annualized) |
Inflation And Risk-Adjusted Expected Returns |
| 2027 | 34.75% | 6.15% | 4.61% | 1.27% |
(Source: DK S&P 500 Valuation And Total Return Tool)
Adjusted for inflation, the risk-expected returns of the S&P 500 are about 1.3% for the next five years.
- S&P’s historical inflation-adjusted returns are 6% to 7% CAGR
| S&P Earnings Yield | 10-Year US Treasury Yield | Earning Yield Risk-Premium (3.7% 10 and 20-year average) |
| 5.04% | 2.37% | 2.67% |
| Theoretical Interest Rate Justified Market Fair Value Forward PE | Current PE |
Theoretically Interest Rate Justified Market Decline |
| 16.47 | 19.84 | 17.00% |
(Source: DK S&P 500 Valuation And Total Return Tool) updated weekly
Even adjusting for low (and rising) interest rates, stocks still require an even larger 17% correction before they become theoretically fairly valued.
But here’s what investors buying MA today can reasonably expect
- 5-year consensus return potential range: 18% to 26% CAGR
Mastercard 2027 Management Guidance Return Potential
(Source: FAST Graphs, FactSet Research)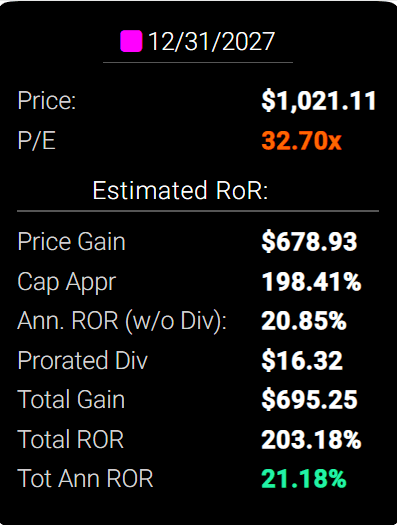
If MA grows as analysts expect and returns to historical fair value by 2027 that’s a 203% total return potential or 21% annually.
- potentially triple your money in 5 years
- Buffett-like return potential from a Buffett-style “wonderful company at a fair price”
- almost 6X the S&P 500’s consensus
Dividend King’s Automated Investment Decision Tool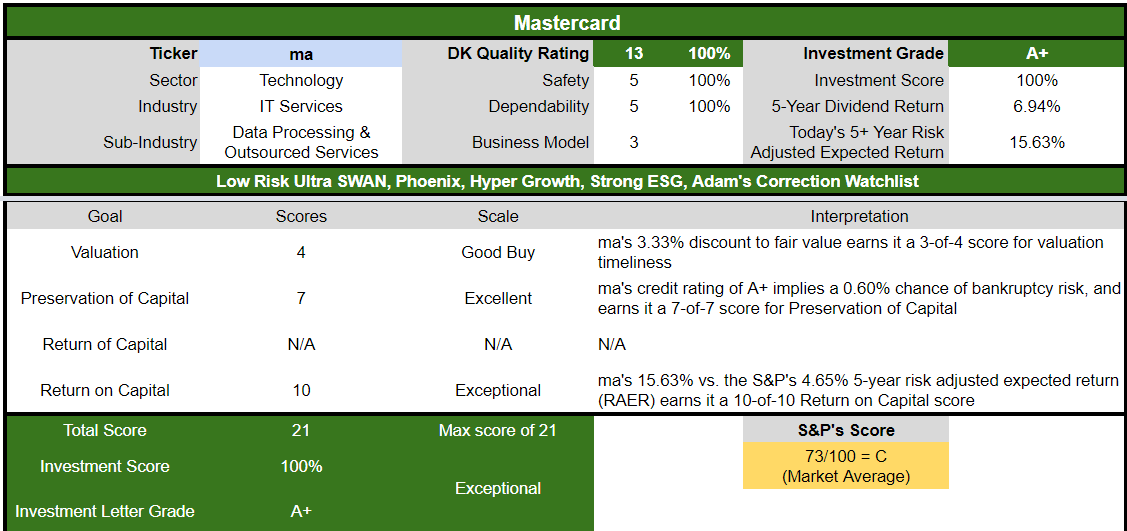
How reasonable is MA as a hyper-growth blue-chip investment today?
It’s as close to a perfect hyper-growth investment as exists on Wall Street.
- a valuation that’s 21% better than the market’s
- 5-year risk-adjusted expected returns that are 3X that of the market
- far higher quality than the market
Risk Profile: Why Mastercard Isn’t Right For Everyone
There are no risk-free companies and no company is right for everyone. You have to be comfortable with the fundamental risk profile.
MA’s Risk Profile Summary
- economic cyclicality risk: bond market expects a recession in 2024
- regulatory risk (domestic and international anti-trust lawsuits)
- M&A risk: including regulatory approvals
- margin compression risk: EU is working on its own network, Russia is now using China’s Unipay, all businesses hate V and MA, though they have to use their networks
- disruption risk from blockchain and Defi: MA and V are both investing in block
- labor retention risk (tightest job market in over 50 years and finance is a high paying industry) – rising wage pressures
- currency risk (growing over time due to faster growth overseas)
- cybersecurity risk: ransomware, hackers, Russian hacker attacks
Mastercard is not without issues in the near term. Cross-border transactions, which are particularly lucrative for the networks, came under heavy pressure due to the fallout from the pandemic and a reduction in global travel. We expect a full recovery, and this should drive relatively strong growth in the near term. From a longer-term point of view, we think it is likely that smaller and more regional networks are building out capacity for cross-border transactions, which could eat into growth a bit in the coming years, but we haven’t seen a material effect yet. While this situation bears watching, Visa and Mastercard’s global networks remain unparalleled, and we think this will remain the case for many years to come.” – Morningstar
Ethereum 2.0 and sharding has the potential to
- achieve 100,000 transactions per second (compared to Visa’s 65,000 and MA’s 5,000)
- and execute transfers at 1/20th the cost of V and MA
Recession Watch
| Bonds | Yield |
| 3-Month Treasury Yield | 0.52% |
| 2-Year Treasury Yield | 2.14% |
| 10-Year Treasury Yield | 2.37% |
| 10-3M Curve (Most Accurate Recession Forecasting Tool) | 1.85% |
| 10-2 Curve (Most Popular Yield Curve Followed By Wall Street) | 0.23% |
| Bond Futures Pricing In Inversion | June 2022 |
| Bond Futures Pricing In Recession Start | January 2024 |
(Source: DK S&P 500 Valuation & Total Return Tool)
The bond futures market expects the 10-2 yield curve to invert in July and a mild recession to begin around February 2024.
- which could impact MA’s short-term growth prospects
How do we quantify, monitor, and track such a complex risk profile? By doing what big institutions do.
Material Financial ESG Risk Analysis: How Large Institutions Measure Total Risk
Here is a special report that outlines the most important aspects of understanding long-term ESG financial risks for your investments.
- ESG is NOT “political or personal ethics based investing”
- it’s total long-term risk management analysis
ESG is just normal risk by another name.” Simon MacMahon, head of ESG and corporate governance research, Sustainalytics” – Morningstar
ESG factors are taken into consideration, alongside all other credit factors, when we consider they are relevant to and have or may have a material influence on creditworthiness.” – S&P
ESG is a measure of risk, not of ethics, political correctness, or personal opinion.
S&P, Fitch, Moody’s, DBRS (Canadian rating agency), AMBest (insurance rating agency), R&I Credit Rating (Japanese rating agency), and the Japan Credit Rating Agency have been using ESG models in their credit ratings for decades.
- credit and risk management ratings make up 41% of the DK safety and quality model
- dividend/balance sheet/risk ratings make up 82% of the DK safety and quality model
MA Long-Term Risk Management Consensus
| Rating Agency | Industry Percentile |
Rating Agency Classification |
| Morningstar/Sustainalytics 20 Metric Model | 88.8% |
17.2/100 Low-Risk |
| Reuters’/Refinitiv 500+ Metric Model | 95.5% | Good |
| S&P 1,000+ Metric Model | 59.0% |
Average- Positive Trend |
| Just Capital 19 Metric Model | 95.3% |
#1 Industry Leader |
| FactSet | 50.0% |
Average, Stable Trend |
| Morningstar Global Percentile | 85.3% | Excellent |
| Just Capital Global Percentile | 98.6% | Exceptional |
| Consensus | 82% | Very Good |
(Sources: Morningstar, Reuters’, S&P, JustCapital, FactSet Research)
MA’s Long-Term Risk Management Is The 70th Best In The Master List (86th Percentile)
- master list average: 62nd percentile
- dividend kings: 63rd percentile
- aristocrats: 67th percentile
- Ultra SWANs: 71st percentile
MA’s risk-management consensus is in the top 14% of the world’s highest quality companies and similar to that of such other companies as
- Apple (AAPL)
- Visa
- Automatic Data Processing (ADP) – dividend aristocrat
- Target (TGT) – dividend king
- Taiwan Semiconductor (TSM)
- Merck (MRK)
- Cummins (CMI)
The bottom line is that all companies have risks, but MA is good at managing theirs.
How We Monitor MA’s Risk Profile
- 37 analysts
- 2 credit rating agencies
- 6 total risk rating agencies
- 43 experts who collectively know this business better than anyone other than management
- the bond market: real-time fundamental risk-analysis on breaking news
When the facts change, I change my mind. What do you do sir?” – John Maynard Keynes
There are no sacred cows at iREIT or Dividend Kings. Wherever the fundamentals lead we always follow. That’s the essence of disciplined financial science, the math retiring rich and staying rich in retirement.
Bottom Line: Mastercard Is The World’s Greatest Company And A Buffett-Style “Wonderful Company At A Fair Price”
I can’t tell you what the stock market, economy, or any particular company will do in the short-term, no one can.
But here’s what I can tell you about Mastercard.
- MA is one of the world’s safest, most dependable, and highest quality companies
- the highest quality company on the Master List
- a very safe and fast-growing 0.6% yield
- expected to grow 3X faster than the S&P 500
- a massive and rapidly growing addressable market and just 7% market share
- heavy investments into crypto, buy-now-pay-later, and DeFi
- 3% discount to fair value = potentially good buy
- classic Buffett-style “wonderful company at a fair price”
- 203% consensus total return upside over the next five years = 6x the S&P consensus
- 15% CAGR 5-year risk-adjusted expected return is 3X that of the S&P 500
If your goal is to achieve the kind of long-term returns and income that rich retirements are made of, then buying the world’s best companies at reasonable prices and holding for the long-term is the #1 strategy you can choose.
Fortunes are made by buying right and holding on.” – Tom Phelps, author or 100 To 1 In The Stock Market
Be the first to comment