


Bond strategy.
Andrii Yalanskyi/iStock via Getty Images
The global bond market suffered significantly from the start of 2021. In my opinion, the bond bubble is over, mainly in the US, and currently, the market reveals a great opportunity for the mid-to-long term. (NASDAQ:TLT)’s total drawdown (a decline from the top) is -39%, historically the most significant drawdown for the ETF. Yes, we are talking about long-duration bonds, which are bleeding dramatically.
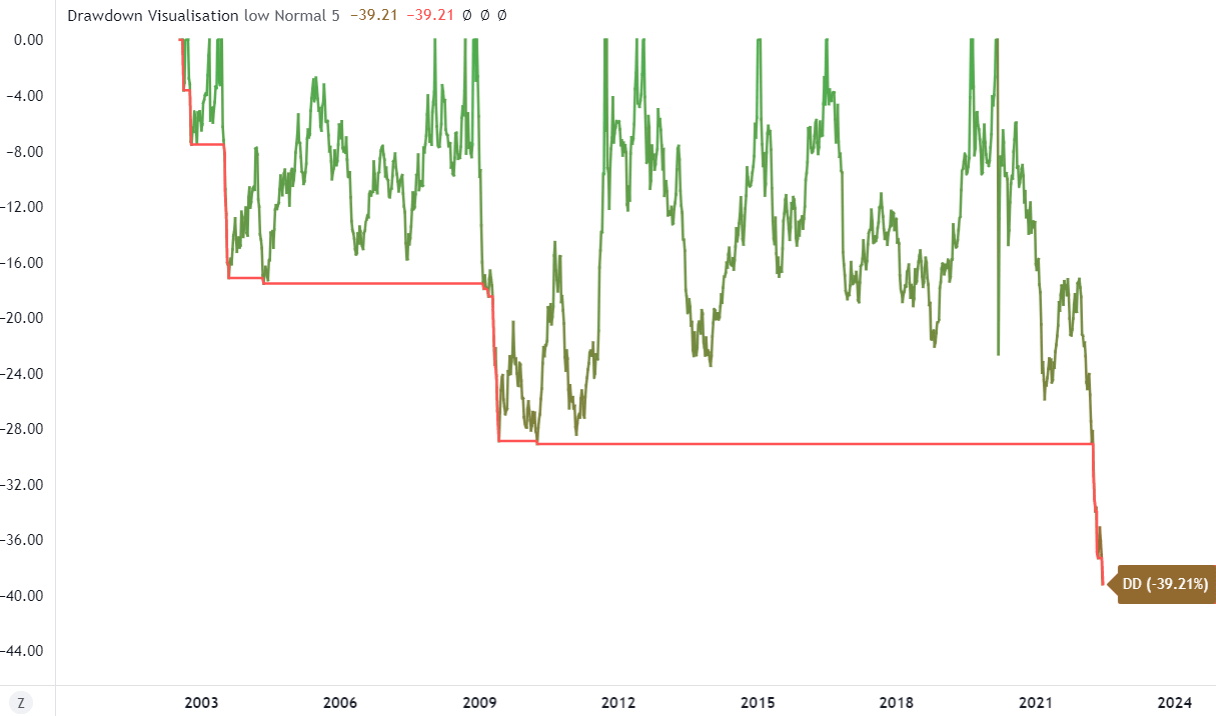
TLT´s Drawdown (Author via Tradingview)
Harmful Backset and Inflation Drivers
What caused such a hard backset? Let’s explain the situation behind the curve to understand the future potential of the bond market. When COVID-19 brutal hit (in 2020) the supply side, as you know the mantra “supply-side disruptions,” the whole world would think the demand side or consumption would be hard hit as well, thus weakening GDP very significantly. The government (fiscal) and central banks flood the system with money via the biggest fiscal and monetary stimulus ever. The US public debt increased hugely.
On the other hand, via Quantitative Easing (QE), the central bank has been the prominent holder of public debt. The bond rally was very great, as was the stock market rally. However, I believe these stimuli have been the most significant contributors, which caused gradual inflation rise. The problem was that money ended in “people’s hands” and thus supported the already strong demand side. After a few months, we discovered that the demand side had not been as weak as first anticipated.
On the contrary, the consumption was strong, but it was even stronger via massive stimulus. The problem was the supply side – many companies needed to shut down production due to strong lockdowns. With so much money in the system and a lack of components, commodities, and products, the prices of these assets rose dramatically, which was the first main sign that inflation wouldn’t be over.
Current Situation
The problem was the policy makers only and sustainably talked about “transitory inflation.” Yes, inflation can be “transitory” as it is calculated as a YoY change in the consumer basket (CPI). Due to the base effect. However, the MoM inflation has been strong due to supply and demand-driven drivers. There were and are many drivers which influenced inflation and consumer behavior, but in my opinion, mentioned shocks were large enough to be considered the main drivers. However, the next driver is the Ukraine-Russia conflict, significantly pulling the inflation upwards via the supply side (commodities). It is such a big catastrophe for people living in Ukraine as well as for the whole world. We can feel the impact via significant inflation, which had been levered up from March due to a substantial rise in commodities (mainly oil). The oil is a different chapter, and it would be a very long article to cover all the main details from this point of view as it is the main supply-side inflation contributor.
At the end of 2021, the bond market started to realize that the fed, sooner or later, needs to be more definite in its Forward Guidance policy to prepare the market from the fast shocks. The tightening did not start with the hikes. The tightening already began when the fed pulled forward guidance in that way. The market realized tightening sooner than the fed acted because at the end of the year, we learned that inflation wouldn’t be transitory until the fed started to do its job – get it under control through tapering, rate hikes, and QT.
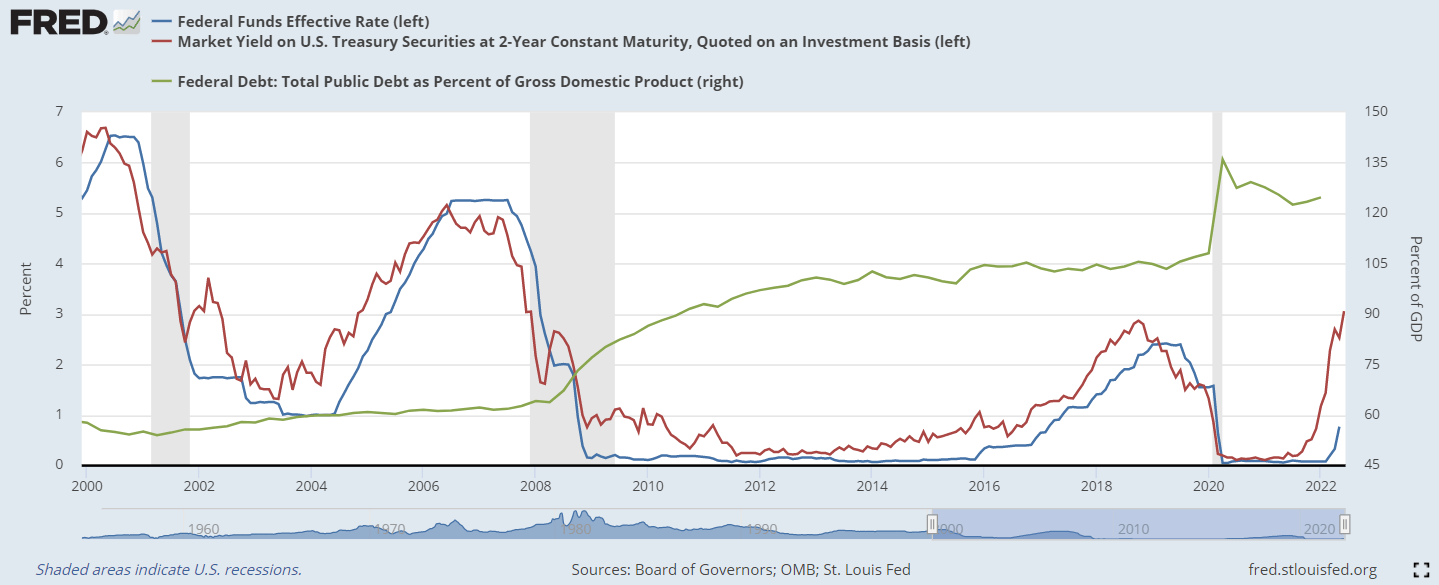
FRED
Currently, the yield of US02 Treasury Securities is above the end of 2018, when the fed “flip-flopped” monetary policy as the stock market has slowed down and was aware of recession due to monetary policy error. Now, look at the Debt to GDP results, and with a more leveraged economy than in 2018, do you think the economy will handle such “high” rates, which led in 2018 to “flip-flop”? Now, when the inflation spiral rotates, I’m aware that this madness of a strong tightening cycle needs to be done. The only option is to shock markets with hikes so that all consumption (demand) channels (rates, mortgages, stocks, bonds, crypto, prices) will be reduced, and thus, the supply problems will be solved. Fed is walking on very thin ice between what an economy can handle or throwing it into a recession. It’s not an easy task for fed as well.
From 4Q2021, the change in the MoM Inflation rate trend started to be hotter. Fed just started to be more and more aggressive. The Committee will focus on MoM Inflation rather than YoY, where the base effect is relatively strong. June’s Core Inflation results were unsatisfactory and caused the market meltdown due to increased expectations of rate hikes, which led to a yield surge.
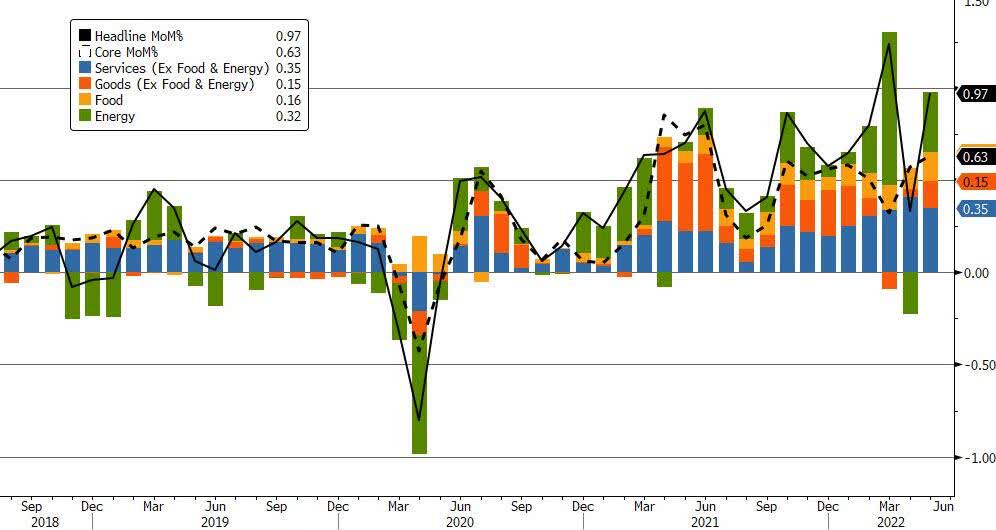
MoM % Change in Inflation (Bloomberg via Zerohedge)
The supply side of inflation can be already seen in demand-driven inflation because of secondary inflation pressures. The reason is that inflation has changed its structure during these turbulent times. And needs to be aggressively stopped.
The inflation peak is near – the central bank will kill the demand side
However, fed with the combination of other great central banks can, with a tightening cycle, indirectly impact oil prices (and other commodity prices) – via lowered demand. When people meet higher payments for their loans due to rate hikes, their consumption habits will be impacted negatively, and they will spend less. Firstly, they will also create lower demand for oil as it is very expensive (and try to find cheaper solutions). Secondly, due to significant inflation, they will spend less in general. Lastly, they will have less money outstanding due to increased payments for loans and mortgages as rates go significantly up. While standard inflation numbers lead to solid consumer confidence or sentiment, huge inflation numbers tend to the destruction of consumer sentiment, thus killing the demand side of inflation. In my opinion, it will be the case.
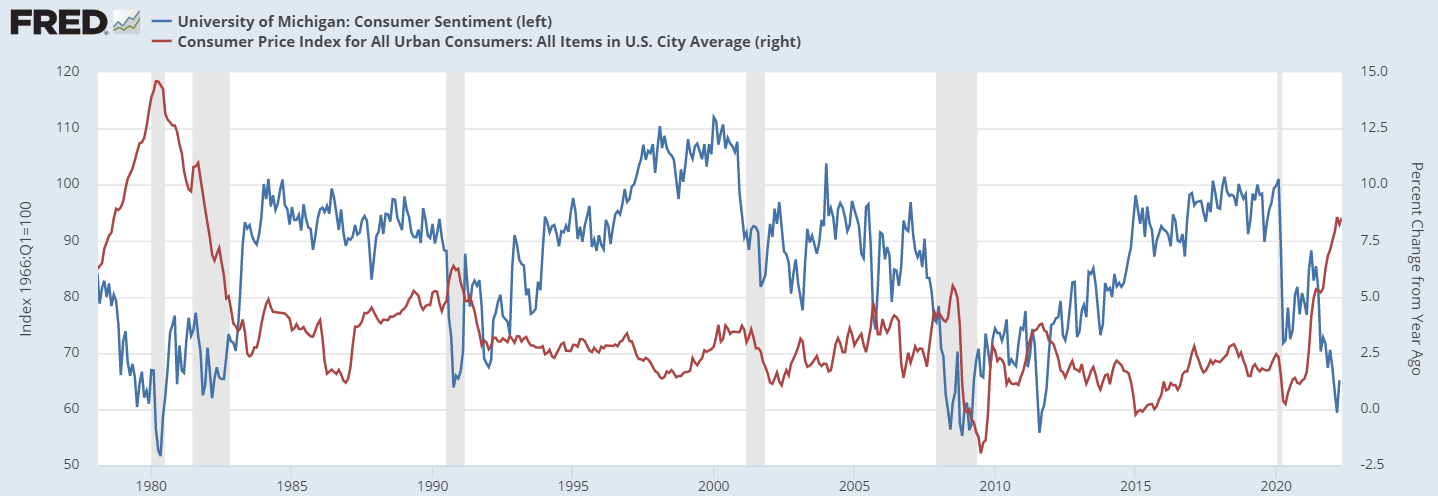
Consumer Sentiment and CPI YoY % (FRED)
As I said previously, fed can impact the supply side only partially through a decrease in people’s spending, which could lead to excess supply. Then, the market would cover these imbalances through price decline.
J. Powell in interview:
What we need to see is clear and convincing evidence that inflation pressures are abating and inflation is coming down. And if we don’t see that, then we’ll have to consider moving more aggressively.
According to the latest (June) meeting:
The Committee decided to raise the target range for the federal funds rate to 1-1/2 to 1-3/4 percent and anticipates that ongoing increases in the target range will be appropriate. In addition, the Committee will continue reducing its holdings of Treasury securities and agency debt and agency mortgage-backed securities, as described in the Plans for Reducing the Size of the Federal Reserve’s Balance Sheet that were issued in May.
The updated reduction plan (Quantitative Tightening) as follows:
Roll over at auction the amount of principal payments from the Federal Reserve’s holdings of Treasury securities maturing in the calendar months of June and July that exceeds a cap of $30 billion per month. Reinvest into agency mortgage-backed securities (MBS) the amount of principal payments from the Federal Reserve’s holdings of agency debt and agency MBS received in the calendar months of June and July that exceeds a cap of $17.5 billion per month.
Maybe you are asking, why am I bullish mainly on TLT or other long-maturity bonds when fed just started QT? Partially I outlined it, but I found more reason and will discuss it in-depth, but first of all, I want to share the distribution of Fed’s securities:
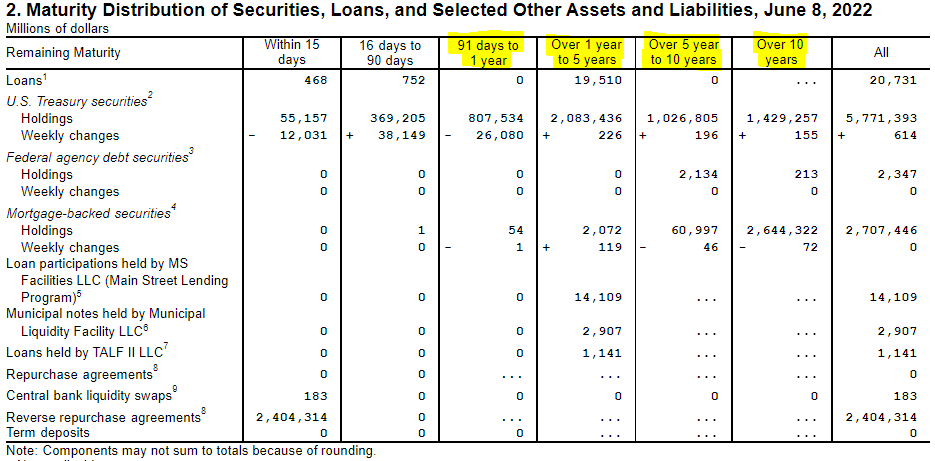
Maturity Distribution of Securities (FRED)
Look at the U.S. Treasury securities, where the biggest allocations are split into securities highlighted in yellow. Despite knowing that long-term bonds have the biggest duration (and TLT is in that section), I guess the biggest impact will feel:
- the short-term assets with maturity to 91 days to 1 year,
- assets with maturity over 1 year to 5 years,
- and maybe assets with maturity over 5 years to 10 years.
The last one is doubtful for me. It’s because the fed wants to get under control of current inflation expectations, I mean short to mid-term, and cool it down. Long-duration bonds can be impacted indirectly. Fed wants to avoid the transformation of rising from short-term inflation expectations to long-term ones.
However, on Wednesday, the Committee meeting revealed an updated dot plot (fed member´s rates projection):
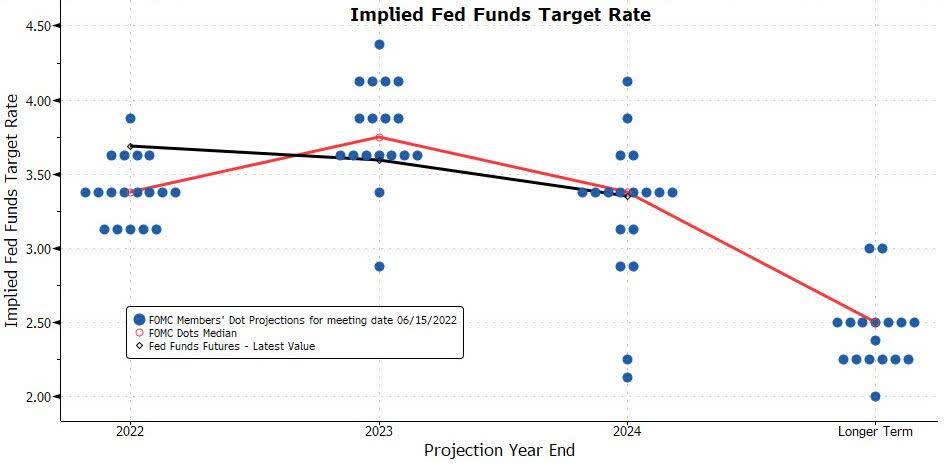
Dot plot (FOMC Projection)
Fed members expect the short-term rates to remain elevated (2022 – 2023) and above the neutral rate. It’s because it differs significantly in the “Longer Term” period, where rates should be pulled down. This is the next reason why long-term yields should not jump significantly, as there are no expectations about lifting the neutral rate (the same as Long Term Fed Funds Rate) higher. The dot plot is indirectly saying that an inverted yield curve can be present for some time (short-term yields near the long-term ones). However, this effect could fade out as inflation will get under control, and yields will automatically react.
The Neutral Fed Funds Rate
The power to change short-term rates is the central bank’s key policy instrument influencing the economy. When establishing where the federal funds rate should be set, the fed considers the “neutral” rate.
Although the neutral interest rate is uncertain, it may be determined using a number of economic variables. The short-term interest rate would prevail when the economy is at full employment and inflation is stable in its basic form. The neutral interest rate may help the Central Bank make monetary policy choices by indicating whether its interest rate policy is boosting or contracting the economy.
Many estimates of neutral rates can slightly differ as there is no uniform calculation. However, it is impacted by many demographic, social, political, and economic factors in the long-term. Alternatively, a neutral rate can be considered a possible long-term rate if CB’s targets are fulfilled. However, inflation shocks can cause the overcoming by short-term rates (yields or FFR), but not for long. Because when it happens, something in the economy can break easily.
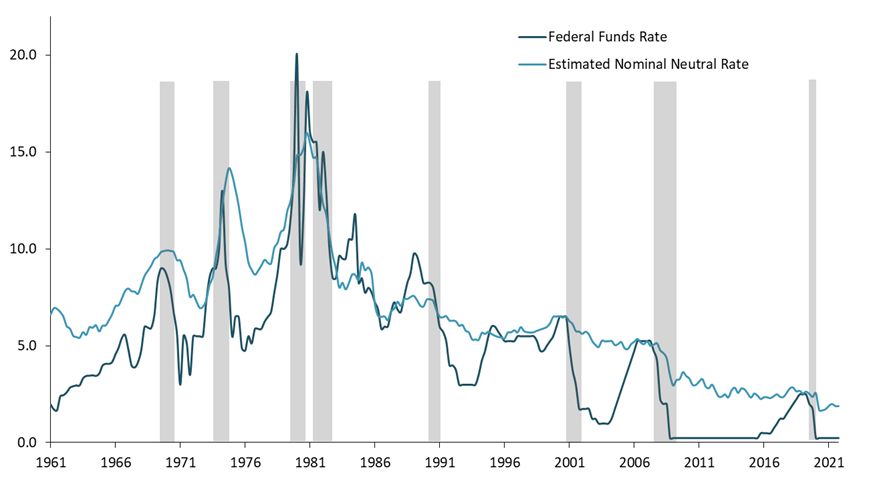
Neutral Rate (Roberto Perli via Bloomberg)
In the previous decades, there was only minor use of a monetary policy tool called forward guidance. Central banks tended to make shocks to all market participants. A monetary policy has changed and tries to prepare markets for future decisions (to avoid shocks) via forward guidance. From this point of view, it’s better to compare the neutral rate with short-term yields. The principle is simple. From a historical perspective, when yields (or rates) are above the neutral rate longer than the economy can take, the issues occur, and monetary conditions need to be eased. If not, the potential of recession is increasing as there are warning signs: the stock market as a leading indicator is crashing, companies have trouble with refinancing (surge in yields), ordinary people have problems with mortgage payments, etc. Currently, we face higher short-term yields above the neutral rate.
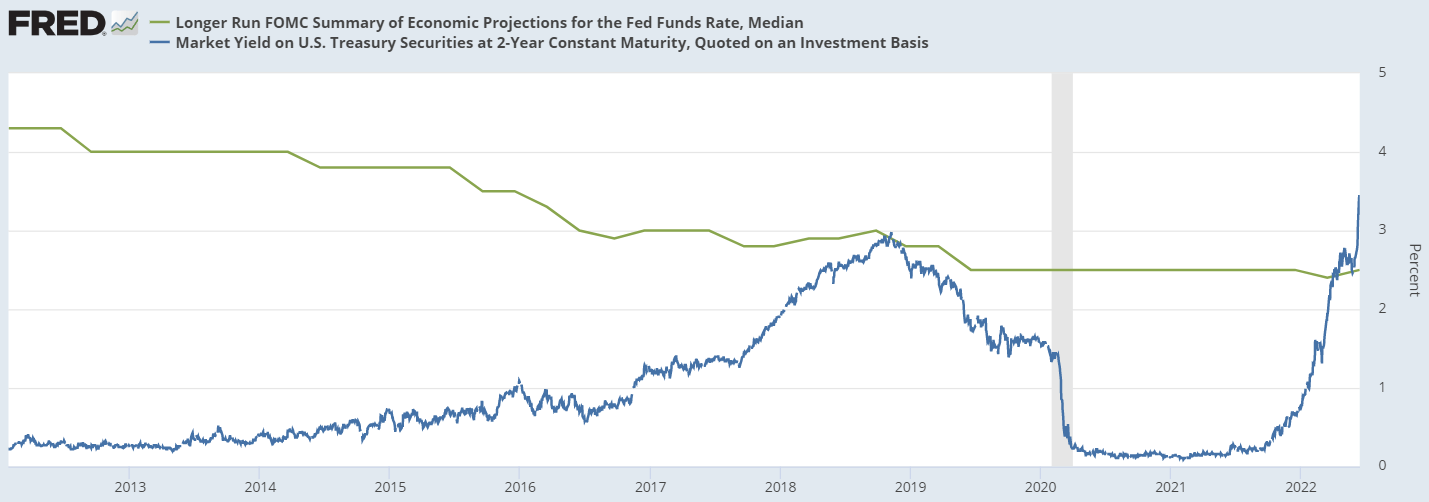
FOMC rates for Longer Run (FRED)
In the FOMC projection, the Committee expects rates for Longer Run at 2.5% (in March at 2.4%). Alternatively, it can be understood as a neutral rate calculated from fed. Due to a lack of history dataset, we use these historical rates for Longer Run (published by the FOMC) with US2Y Treasury securities. However, I still believe fed can calm the inflation but is on very thin ice between what the economy can handle or causing the recession. Both ways are bullish for (TLT).
Next fundamentals supporting the investment thesis
Firstly, I would like to post the chart, which is very important for my belief in the inflation peak and market stabilization. Monetary Base YoY % is negative, and it will continue to move in negative territory for some time. As a result, many times, the inflation reaction was a slowdown or deceleration, but with some lag. I guess it will be the same this time. However, the base effect also plays its role here.
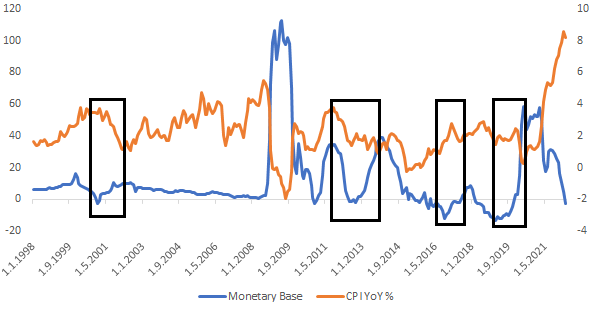
Monetary Base YoY % vs. CPI YoY % (Author´s calculation. FRED Dataset)
One of the strongest narratives for this bullish investment thesis is market pricing. The market expects rates at 3.4% till December 2022 and at 3.75% in December 2023. This is a very aggressive stance, one of the fastest tightening cycles in US history. That’s what TLT and the bond market in general actually price in. Similar results released the latest fed projection (in 2022 to 3.4 and in 2023 to 3.8). I guess headline MoM inflation will start to decelerate significantly in further months 2-3 (till July – September), and thus bond market could significantly ease and turn the trend. It doesn’t matter if it would be the market reaction on rates or due to recession and thus stop in aggressive tightening.
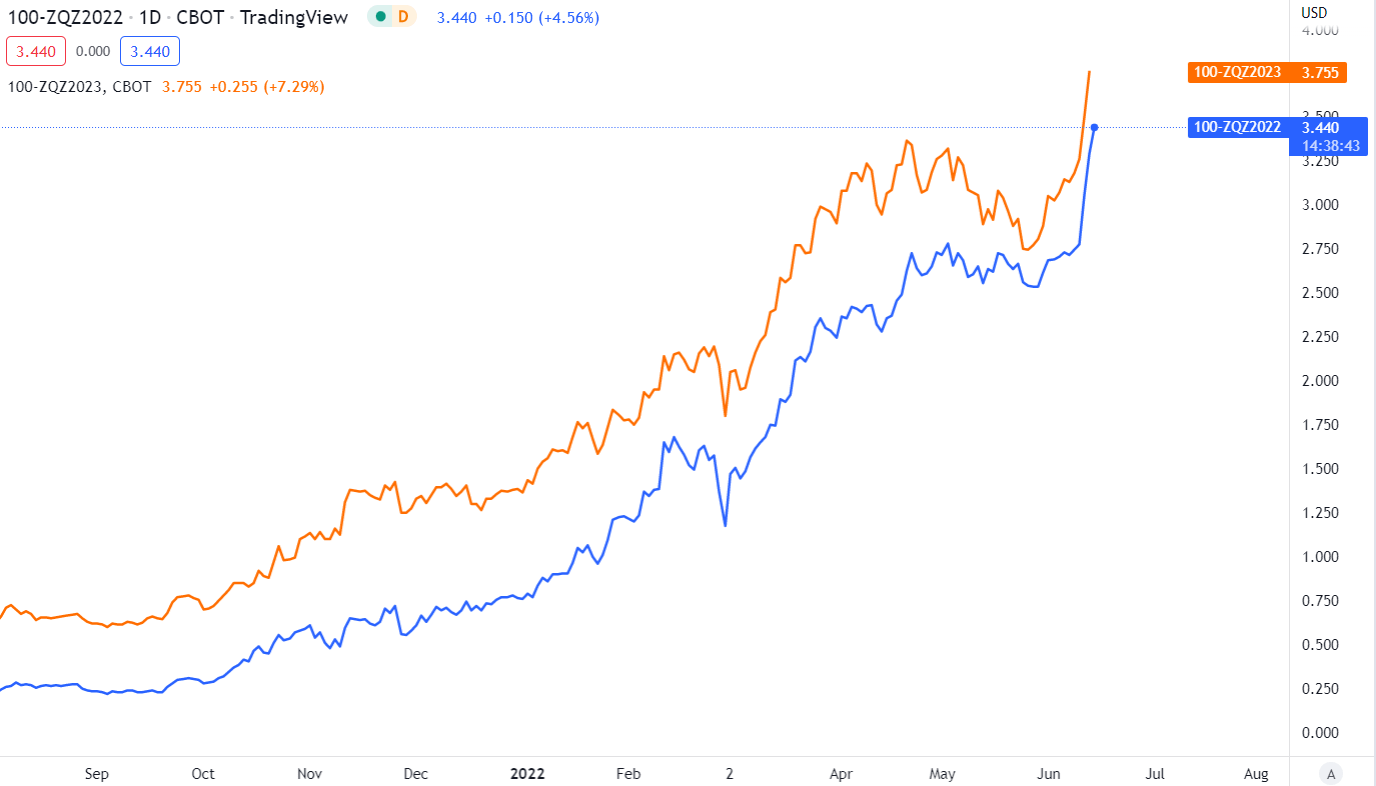
Fed Funds Rate – Futures (Tradingview)
After such drawdown (-39%), I expect the bottom in (TLT) is near. Of course, the risks are here, mainly a more aggressive monetary stance as currently expected or the thought fed will continue to tighten during the recession.
Financial Market Erosion
The next reason why I believe we are near the Inflation peak (considering MoM Inflation without base effect) is market erosion. The stock market is down quite significantly, mainly in the technology sector and biotechnology as well as startups or companies after IPO or the crypto. Valuations in the previous months were unjustified and absurdly high due to fiscal and monetary stimulus. It’s over already, and many young companies are down 70-80%, and now may seem attractive. However, retail is being wiped out.
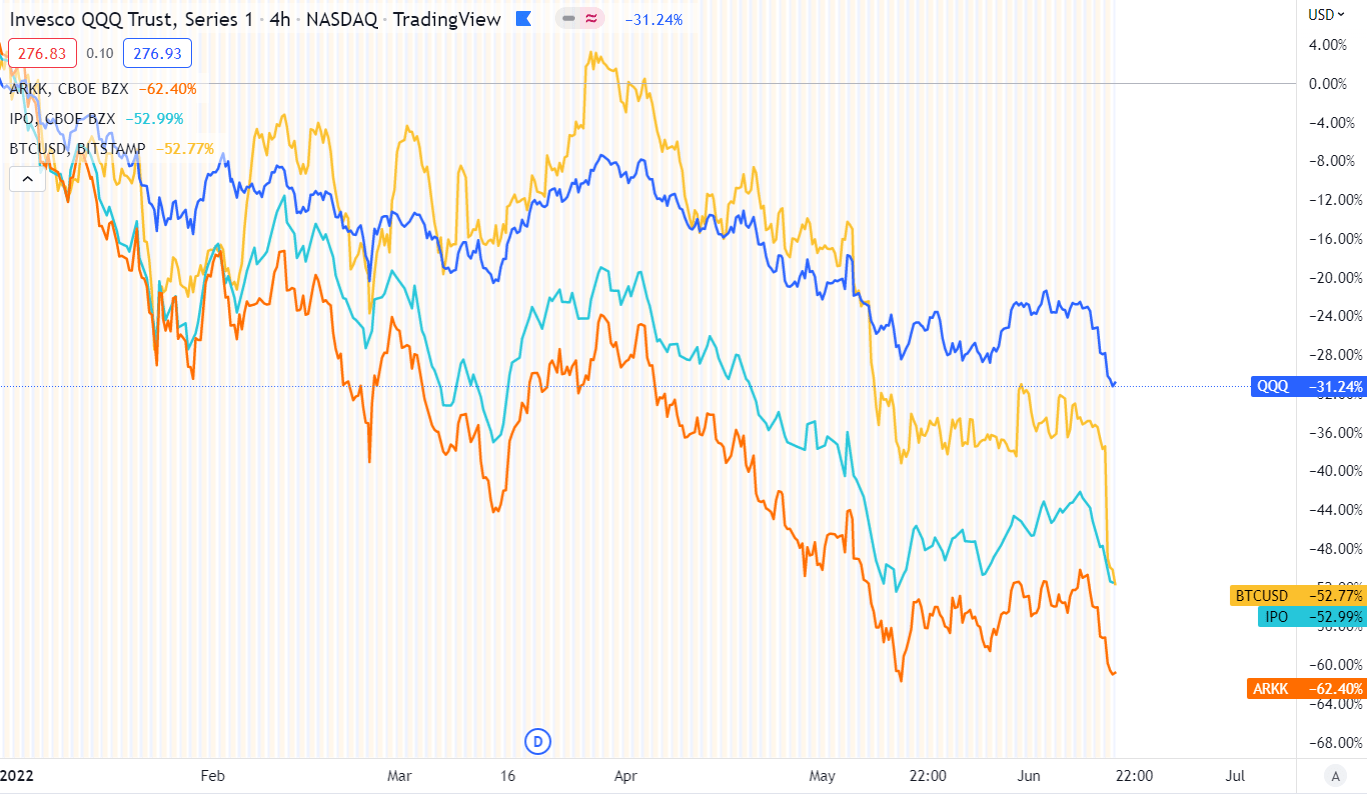
Assets erosion (Tradingview)
A very similar trend can be seen in the bond market too. However, I don’t believe the fed will fulfill the market expectation of hiking rates at 3.8% till the end of the following year. Until 2023, there can happen many unexpected events, such as a recession, a calm-down in the geopolitical situation, and many unknown factors. In the next chart, you can see the YTD results of many bonds ETF, TLT, (HYG), (LQD), (IBND). These numbers are much worse if you would scope from the end of 2021.
If this meltdown continued significantly, many people in 401k would lose so much many before their retirement. From this point of view, do not underestimate the potential of the “Fed Put” if the bond market continues in a freefall (as we saw a similar reaction from the ECB this week). The “Fed Put” is the market’s assumption that the Federal Reserve would intervene and enact policies to keep the stock market from falling below a given level. I believe that if the market decline via various assets continued dramatically, the fed would step in and ease the financial conditions to calm down the markets as a robust tool of the transmission mechanism and would sacrifice the inflation targeting.
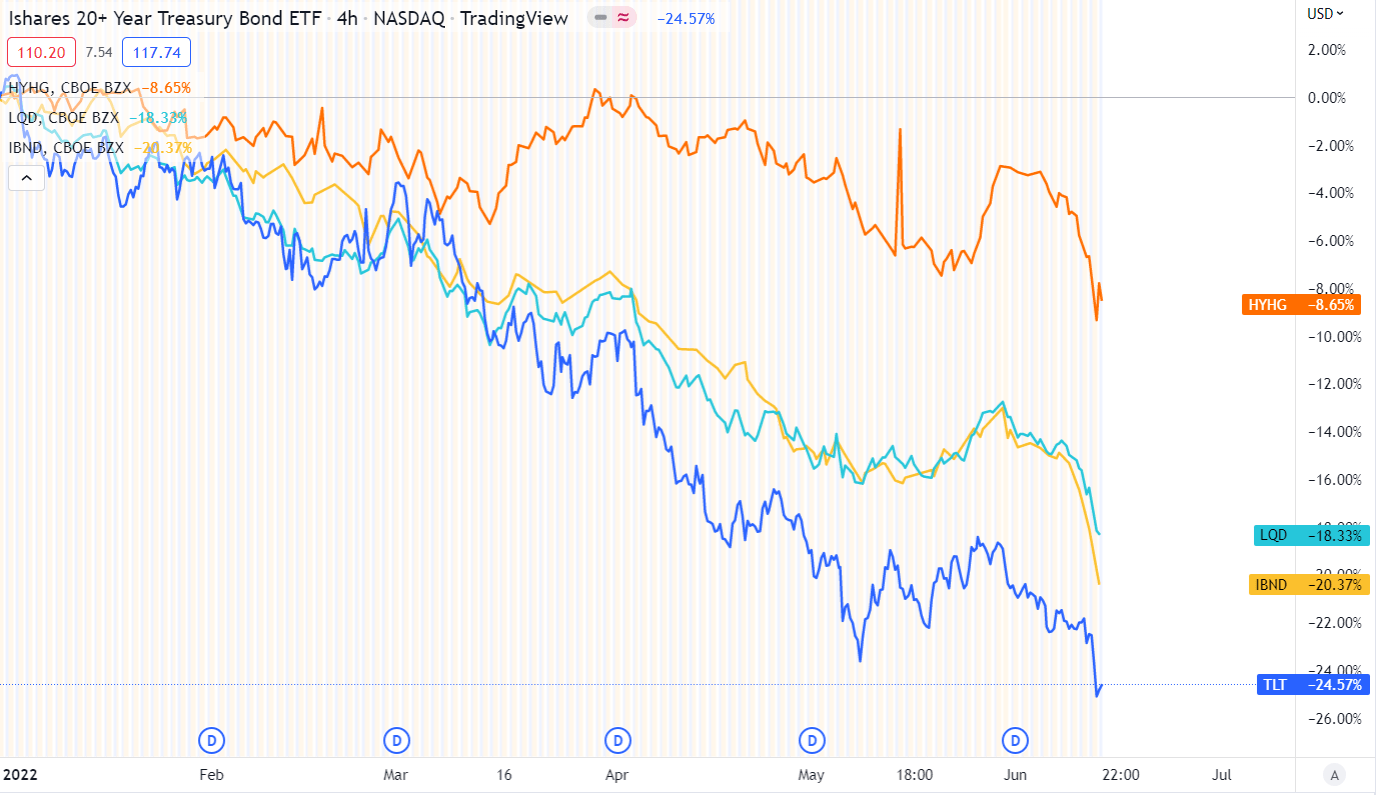
Bond ETF (Tradingview)
The real estate market lags behind developments in the financial market. Mortgage rates rose significantly, which will undoubtedly impact house prices as many potential buyers will think twice before taking a mortgage with such conditions. House prices could slightly decelerate. The following chart describes the tiny relationship between mortgage rates and house prices (with the lag) and confirms a strong negative correlation. Mortgage rates are a leading indicator of house prices. According to the following chart and mentioned fundamentals, we can await a slight attenuation of house prices.
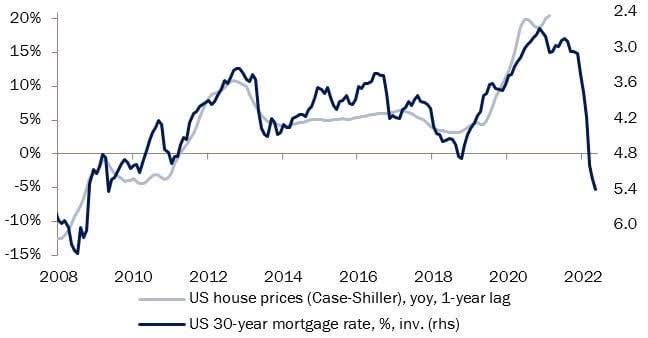
US 30Y Mortgage Rate vs. House Prices (Unknown author at Twitter)
After all the stimulus finished, and the tightening cycle started, mortgage payments for a median new home rose rapidly. We are at levels very similar to 2006, just before the financial crisis. Helicopter money is over, and a further increase in yields could cause a rise in rates, thus massively endangering households and their disposable income. After paying all the necessary costs (adding high gas & oil prices), I believe there won´t be so much money left in the pocket for additional consumer spending. As a result, consumer sentiment will cool the demand side of inflation.
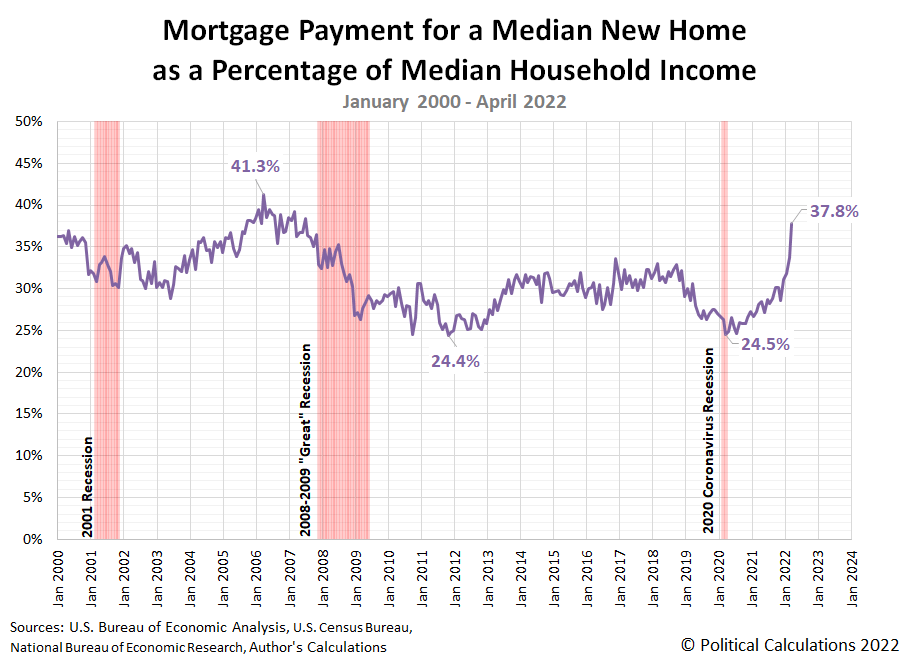
Mortgage Payment for a Median New Home as a Percentage of Median Household Income (U.S. Bureau of Economic Analysis. Political Calculations 2022 via Zerohedge)
Risks
In my opinion, we are near the inflation peak (MoM %) as there are many stressful situations in the US economy. I expect we will find the peak in the inflation cycle till July / September and then should decelerate on a monthly basis. Honestly, the inflation surge is also the most considerable risk this investment thesis faces. Strong and continuing growth in core inflation without a sign of deceleration could lead the fed to hike more aggressively, thus deeply harm the bond and stock market. This risk is also mitigated because the scenario would cause a recession, the consumer sentiment would be even weaker, and the demand side of inflation would be dramatically hit. The problem would occur if the supply side of inflation did not weaken and still was very high. I´m talking about double-digit inflation, which should be cooled only via much more aggressive tools. However, in my opinion, this risk is highly mitigated as the fed does not want to destroy the economy and cause unemployment, which is one of the two most important targets for fed. I believe the risks are limited with current yield pricing.
Summary
Due to the higher mentioned factors, like 401k, higher mortgage payments, enormously high commodity prices, and monetary policy reasons, I firmly believe it’s a great time to load some bonds, mainly with long maturities. In my thesis, the fed won’t meet the market expectations for rates (3.8% till the December 2023 measured via futures) in the mid-term as the neutral rate has been dropping historically thorough the period. As I stated, the short-term rates are currently above the neutral rate. It will be okay if yields (short-term rates) persist above the neutral rate for a short period. However, I’m not convinced about persisting above for a long-time as there are indications that not everything in the economy works properly (slower growth, stock, and bond market decreasing, etc.).
In my opinion, the economy can not handle such an increase in yields, which led in 2018/2019 to fed flip-flop. Such a long-term surge in bond´s yields (treasury, corporate, or junk) would cause the problem with refinancing, high amount of payment (due to rise in interest) with a current increased amount of public and private debt to GDP. Next long-term trends and issues with demography support the thesis that a significant rise in rates won’t be sustainable. Finally, it creates an excellent opportunity for TLT. On the one hand, I’m convinced fed will get inflation under control via monetary policy tools (as it’s a very aggressive cycle), and if not, fed will hike and cause the recession so that inflation will go automatically down as all the other macro indicatiors will worsen. Both approaches are mutually beneficial for TLT, with the exception of continued inflation growth.
Be the first to comment