

South_agency/E+ via Getty Images
The Masco Corporation (NYSE:MAS) is a leader in branded home improvement and building products. One well-known brand within the company’s portfolio is BEHR paint, which is the most trusted paint brand among millions of consumers in North America. The company has benefited from the strong housing market over the past several years but is currently trading near the lows due to economic uncertainties and a challenging business environment.
Despite recent headwinds, the home improvement industry has favorable long-term fundamentals, and the company will continue to benefit from home price appreciation and turnover, both of which have a high correlation with repair and remodel activity. Demand for the company’s products will be further supported by continued demand from the millennial generation and the increasing amount of homes that will reach the prime remodeling ages of 20-40 years old.
In 2021, MAS increased their dividend by 68% and another 20% in 2022. In addition, the company is repurchasing a large quantity of their outstanding shares. This is all occurring as the company maintains its strong balance sheet that includes over +$900M in cash on hand. In addition, sufficient cash flows are being generated to cover their investments in growth and their dividend payouts. For investors who remain bullish on the home improvement industry, shares in MAS offer upside potential of approximately 20%.
Business
MAS is a global leader in branded home improvement and building products. The company’s notable brands include BEHR paint and Delta bathroom fixtures, among others. Their two operating segments are Plumbing Products and Decorative Architectural Products. Sales derived in these segments are reported in two geographic areas, North America and International, which is principally Europe.
In 2021, the company reported +$8.4B in net sales. A disaggregation of net sales by product and geographical segment, available within the annual 10-K filing, is provided below. Historically, over 50% of net sales are attributable to Plumbing Products. In 2021, sales were over 60% in this segment, but slightly under that in the prior two years. The Decorative Architectural Products segment is impacted by seasonality and typically experiences stronger sales during the second and third calendar quarters. From a geographical perspective, nearly 80% of total sales are generated within North America.
Sales Disaggregation – Form 10-K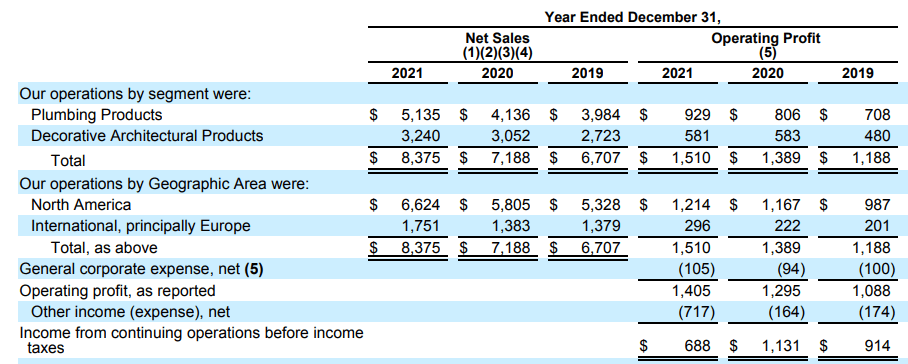
The raw materials used in the company’s plumbing products include brass, which contains copper and zinc as its major components. MAS has multiple sources for the materials used in this segment, but they have encountered price volatility for brass and many components containing copper and zinc. Acrylic resins and titanium oxide are the principal raw materials used in architectural coatings. The price of these materials fluctuates based on the price of its components, which include several petroleum by-products. To mitigate the risk of shortages, the company at times enters long-term arrangements with certain significant suppliers. Additionally, the company also has agreements with certain significant suppliers that are intended to help assure continued supply of their materials and components.
The largest overall customer of MAS is the Home Depot. This retailer is also the single largest customer of the Decorative Architectural Products segment. Furthermore, the BEHR brand is sold to the Home Depot under an exclusivity agreement. The granting of this exclusivity affects the company’s ability to sell these products to other customers.
Competitors
MAS’ plumbing products are among the leaders in sales in North America and Europe. Despite this, the company does face significant competition in both of their reportable segments. Competition is based largely on brand reputation and product features, quality, and price, among other factors. In addition to competing with products offered by foreign manufacturers and other publicly traded companies, such as Fortune Brands Home & Security, Inc’s Moen, the company also faces significant competition from private label products. Additionally, many of the faucet and showering products manufactured by their competitors are low-cost and sourced from foreign sources, which further contributes to price competition.
Other competitors to MAS include Benjamin Moore & Co, PPG Industries, and The Sherwin-Williams Company’s Minwax. Below are the market caps of MAS and other publicly traded companies in the industrials sector, available from Seeking Alpha’s Peer Comparison Tool. Besides SHW, who is more integrated, all peers have a market cap of less than +$15B and fewer than 30K employees.
Seeking Alpha Peer Comparison Tool – Market Cap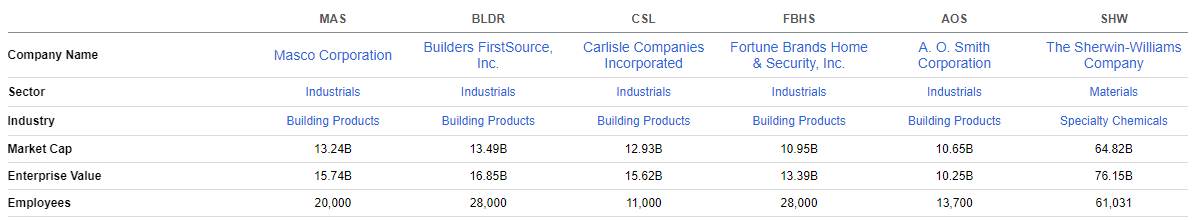
The overall industry is down significantly over the past year. MAS, for example, is down nearly 25%. The S&P 500, on the other hand, is up 14% over the same time frame. Additionally, over the past month, MAS is also down 2.6%. This is better than Fortune, AOS, or Sherwin, but is much worse than the 10% and 7% gains reported for FirstSource and Carlisle.
Seeking Alpha Peer Comparison Tool – Total Returns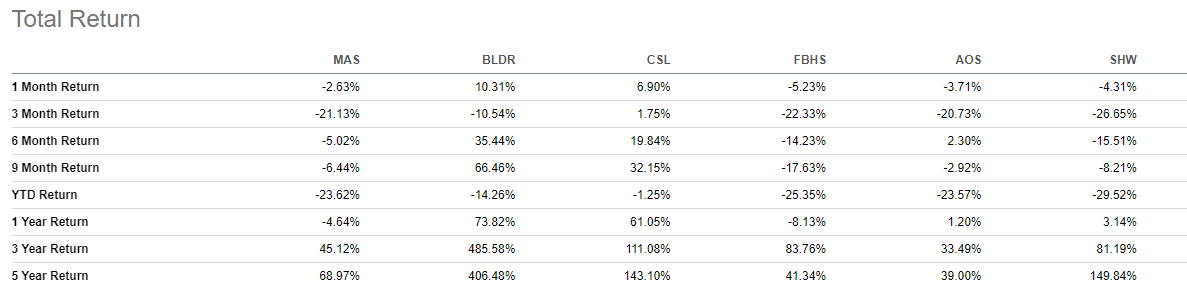
On valuation, MAS appears undervalued against the peers in the industry. Their forward pricing multiple is 12.7X versus a multiple greater than 15x for three of their peers. In addition, this multiple is also lower than their five-year average of 16.6x. Furthermore, from an EV/EBTIDA perspective, the company’s TTM multiple of 13.4x is lower than most of their peers as well. While the TTM is higher than their five-year average of 12.8x, their FWD multiple of 9.3x indicates value potential.
Seeking Alpha Peer Comparison Tool – Valuation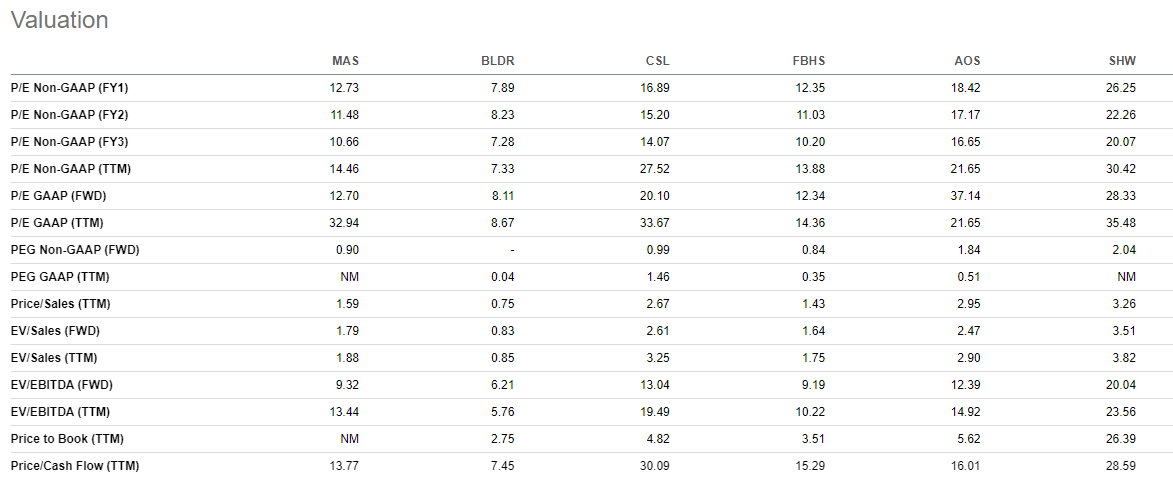
MAS is a mid-sized industrial that is trading on negative sentiment, along with many of their peers. The stock is also down significantly when compared against the broader S&P. Despite this, the company’s current multiples indicate the shares are undervalued. To obtain a more complete picture, however, deeper analysis must be performed on the company’s fundamentals and earnings prospects.
Earnings & Outlook
For the year ended December 31, 2021, reported net sales were up 17% from 2020 and gross profit was up 11%. Margins were down, however, by 180 basis points from 36% in 2020 to 34.2% in 2021. In the fourth quarter, sales were up 8.7% and gross profit was down 6.2%. Additionally, margins were down by 490 basis points from 35.4% in 2020 to 30.6% in 2021. Quarterly declines in profit and margins were related to higher commodity and freight costs.
Q4FY21 Earnings Release – Net Sales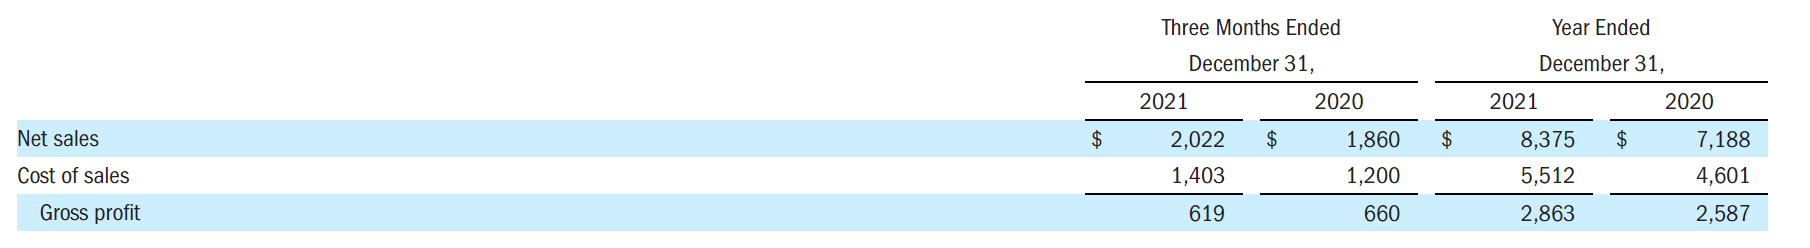
For the year, the company’s Plumbing segment grew 22%, led by strong growth in Delta, Hansgrove, and Watkins. In the Decorative Architectural segment, full year growth was 6%, driven by their paint business, which was anchored by strong sales of BEHR.
Sales growth during the quarter was led by the paint business, which delivered strong results and continued to gain market share in the PRO and DIY markets. BEHR’s growth in DIY paint was in the mid-single digits, while growth in the PRO segment was over 50%.
During the year, the company repurchased 7% of their outstanding shares and paid +$211M in dividends. In 2021, the company increased their dividend by 68% and that was followed by another 20% increase in the first quarter of 2022. MAS ended the year with over +$900M in cash and net leverage of 1.3x.
Looking ahead to 2022, the North American repair and remodel market is expected to remain steady with growth projected to be in the mid-single digits. The paint market is also expected to grow in the mid-single digits. The repair and remodel market remained strong all through 2021 and the market is expected to continue being a tailwind moving forward. Home appreciation was 18% in December, and existing home sales increased over 8% from 2020. Both these metrics display a strong correlation of the companies sales on a lagged basis.
Overall sales in 2022 are expected to increase 4-8%, with margins of approximately 17.5%. Margins will be lower in the first half of the year due to more normalized levels of growth compared to the first half of 2021. CAPEX is expected to be higher than in 2021, which came in at about 1.5% of net sales. 2022 CAPEX, on the other hand, is expected to be 2-2.5% of sales. Lastly, the company expects to deploy at least +$600M on share repurchases or acquisitions.
Liquidity Analysis
Author’s Assessment of Short-Term Liquidity Strength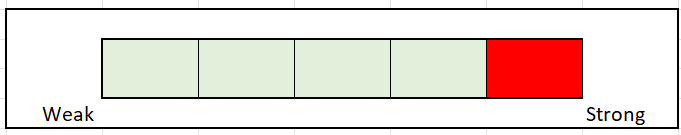
At the end of December 31, 2021, MAS reported +$3.4B in total current assets and +$1.9B in total current liabilities. Total current assets were comprised principally of A/R and inventories, which together accounted for 70% of the total. The remaining 30% was essentially all attributable to cash on hand of +$926M. Inventories increased +$750M from 2020 to 2021, primarily related to higher purchases and input costs.
Balance Sheet – Form 10-K Balance Sheet – Form 10-K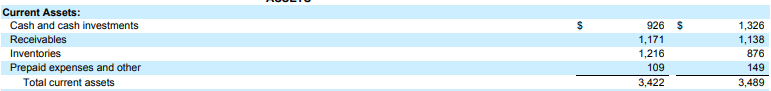

The results of the seven liquidity ratios below provide further insight into the short-term financial position of the company. The current ratio and the quick ratio both measure the ability of the company to meet its current obligations with their current liabilities. A reading of 1x for both ratios is desirable. MAS’ current ratio is 1.76. This indicates strong coverage. Additionally, the result is also consistent with the prior four years.
While the current ratio includes all current assets, the quick ratio only liquids the most liquid assets, such as cash and A/R. Even when excluding inventory from the calculation, the ratio is still above 1x.
Author’s Calculations of Liquidity Ratios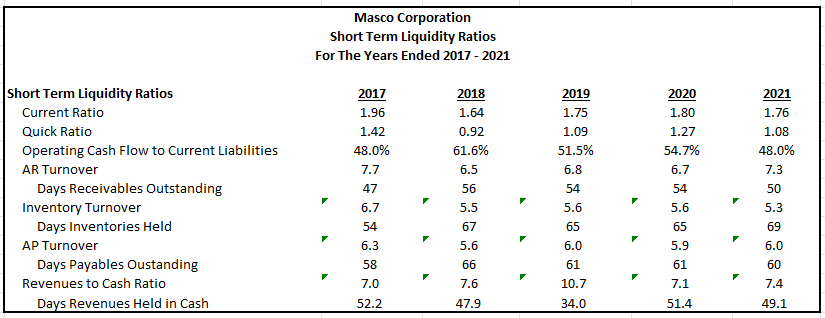
Since inventory and A/R are such a large portion of current assets, what is more important than either the current or quick ratio is the ability of the company to convert these two assets into cash. For example, if A/R is very high, one can assume that both the current and quick ratio will also be high. But suppose A/R is high because the company is unable to collect their balances due from customers. In this case, while the results of the ratios are positive, the health of the company is ultimately a net negative because of the risk of an asset write-off. Similarly, if the company is unable to sell their inventory, the inventory balance will be higher, and the ratios will look strong at first glance. But, again, the health would be a net negative because of the risk of an obsolescence-related write-off.
As seen further below, the number of days to sell inventory and collect on A/R are consistent from year-to-year. There does not appear to be any indication that the company is having difficulties in the turnover of these assets. Additionally, within the notes to the annual financial statements, it’s disclosed that customers’ payment terms are generally between 30-65 days. Collections appear to be within that range.
Days to sell inventory has increased slightly in 2021, but that is likely due to supply-related constraints. In GAAP accounting, reductions in inventory are reported when the goods are loaded onto the carrier or when the customer receives the goods, depending on the contract. If it’s taking longer for customers to receive their products, this would result in the company carrying more inventory for financial reporting purposes. Since there were logistical challenges all through 2021, these issues were likely the driver of the increase in inventory days.
Another insight provided in the summary below is the number of other days of financing required by the company after accounting for the number of days it took to sell inventory, collect on A/R, and pay suppliers. For example, in 2021, it took 69 days to sell inventory. After the sale, it then took 50 days to collect on that sale. Thus, there were a total of 119 days in which cash conversion was pending. Within this timespan, MAS held off payment to their suppliers for 60 days. Therefore, there were a total of 59 days in which the company required funds other than short-term supplier provided financing in order to fund their working capital. It should also be noted that the company had 49 days of sales of cash on hand, as was summarized earlier. So, there were only 10 days in which the company had to tap into other funding sources, such as operating cash flows or longer-term financing arrangements.
Author’s Calculations of Other Days of Required Financing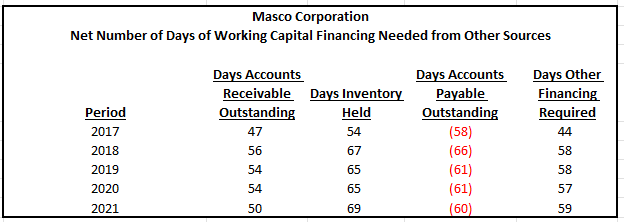
The liquidity position of MAS is strong. They have ample cash on hand to fund their working capital needs, and they are turning over their A/R and inventory in a timely manner that is consistent with prior years. There are no indications that the liquidity position of the company will be compromised in future periods. Therefore, a strong rating is suitable for this metric.
Long-Term Solvency Analysis
Author’s Assessment of Long-Term Solvency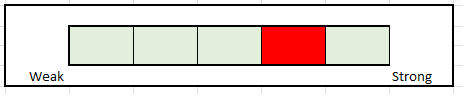
MAS reported +$5.5B in total liabilities at the end of 2021. This was effectively 100% of the company’s total assets, as shown below. Historically, it has been the norm of the company to operate on a high amount debt to assets and equity. Of the total liabilities, 35% were current. Earlier, it was assessed that the company had a strong ability to satisfy their short-term obligations. Analysis of the ratios below will provide an indication of MAS’ ability to cover the remaining 65% of the total liabilities.
Compared to prior years, the current interest coverage ratio of 3x is lower but still sufficient since it is over the 2.5x that is required within their debt covenants. Nevertheless, a higher degree of coverage is certainly desired. A more positive indicator, on the other hand, is the Z-Score of 4.42, which indicates nearly 0% chance of bankruptcy.
Author’s Calculations of Long-Term Solvency Ratios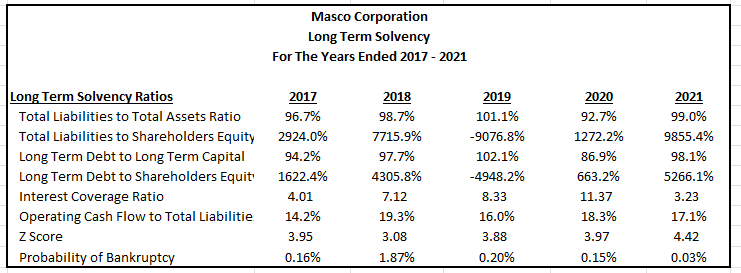
The summary below provides the balances due by year of all the company’s contractual obligations. As can be seen, approximately three quarters of the total obligations are due beyond 2026, and the amounts due prior to then are low and less than the company’s current cash on hand. Therefore, repayment risk is low.
Summary of Contractual Obligations – Form 10-K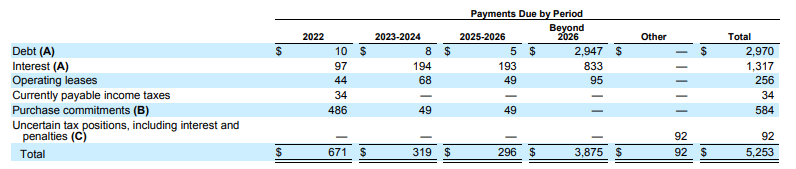
MAS’ long-term viability is stable. While their overall liability balance is high compared to their asset and equity balances, there does not appear to be any indication that the company will be unable to meet their obligations. At the end of 2021, the company had a net debt/EBITDA ratio of 1.3x, which is not high. Additionally, most of the company’s contractual obligations are due in later years, so there are no immediate repayment risks. Further, an adequate interest coverage ratio indicates the company will be able to continue meeting their interest obligations in the interim. Therefore, an above average rating is warranted for long-term solvency.
Profitability Analysis
Author’s Assessment of Profitability Strength
MAS reported gross profit margins of 34.2% in 2021, which was 180 basis points lower than in 2020. Within the income statement, one can see what is driving the declines. While net sales were up 16.5% from 2020 and 25% from 2019, cost of sales were up 20% from 2020 and nearly 30% from 2019. This increase was attributable to increased freight costs and input cost inflation.
Gross Profit and Net Income – Form 10-K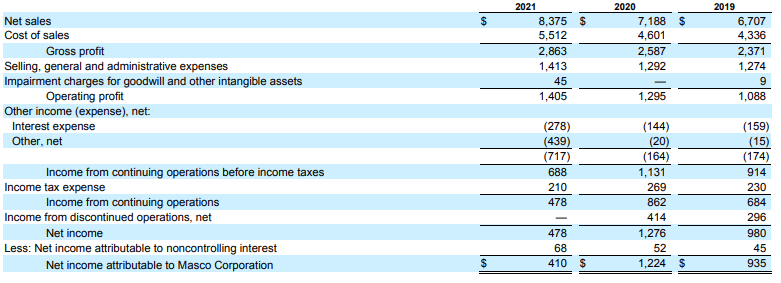
On a positive note, the company did realize savings within SG&A during the year. While overall SG&A was up 10% from the prior year, total SG&A as a percentage of sales was 16.9% versus 18%-19% in the prior two years.
The summary further below provides insight into the historical averages for various profitability measures. Net income margins of 4.9% appear anemic compared to prior years. It is worth noting that MAS was generating income from discontinued operations in the prior two years. Additionally, they recorded large gains on the disposition of businesses, which favorably impacted net income in the prior two years.
In 2020, they generated +$414M in income from discontinued operations and in 2019, they generated +$292M. In 2020, by factoring out income from discontinued operations, the net income margin would have been 12%, not 17%. In 2019, it would have been 10%. Margins of 5% are still low, regardless. Even with gross profit margins of 36%, margins on net income would have been 6.7%. The company did incur other expenses of +$439M and higher interest expense in 2021. The increase in other expenses was attributable to transportation, labor, and marketing related costs. If these expenses were at more normalized levels, income margins would have been around 13%, which would have been higher than the prior two years.
Author’s Summary of Historical Margins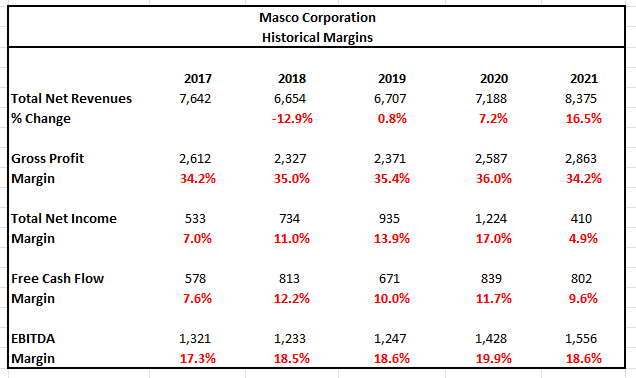
Below are profitability comparisons to other peers within the industry. Margins are down, but they are still generally in-line with the industry. The company is underperforming on several measures, but they are displaying strength in return on total capital. Additionally, they are generating significant cash from operations that is approaching +$1B.
Seeking Alpha Peer Comparison Tool – Profitability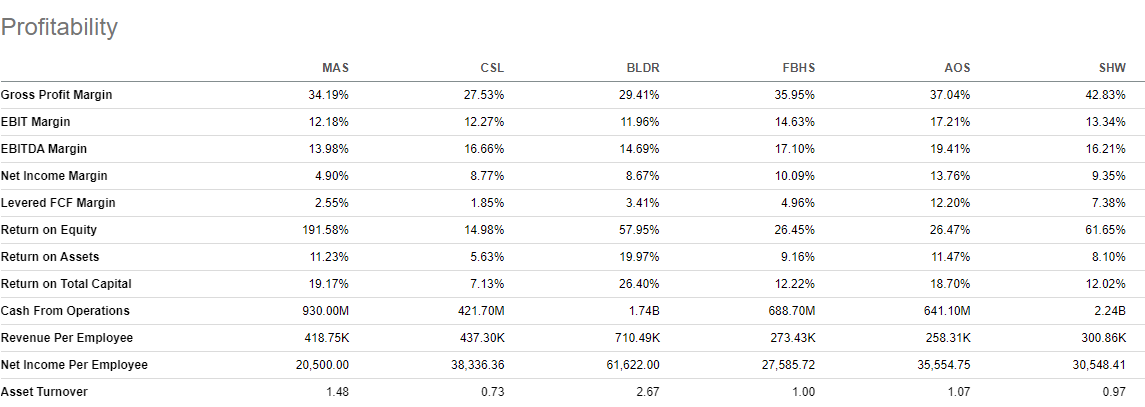
The inflationary environment negatively impacted MAS during the year. While the company realized savings in SG&A, they incurred significant costs on freight and raw materials. Additionally, interest expense was up for the year, and the company recognized +$439M in other expenses. This resulted in a large decrease in margins on net income. Moving forward, the company expects costs to moderate in the second half of the year and margins to return to more normalized levels. Until that happens, it is best to remain neutral on profitability.
Cash Flow Analysis
Author’s Assessment of Cash Flow Strength
MAS reported +$930M in cash from operations in 2021. This was lower than 2020, but nearly +$100M higher than in 2019. The company did realize a positive pension benefit of +$312M in the current year. Additionally, net inventory was up +$350M. Other than these two net adjustments, there weren’t any other major adjustments to net income during the year.
As seen, in the prior two years, net income was up on gains from the disposition of businesses. Without these gains, net income would have been significantly lower in both years. With that in mind, current year cash flows appear strong given the operating environment.
Cash Flow Statement – Form 10-K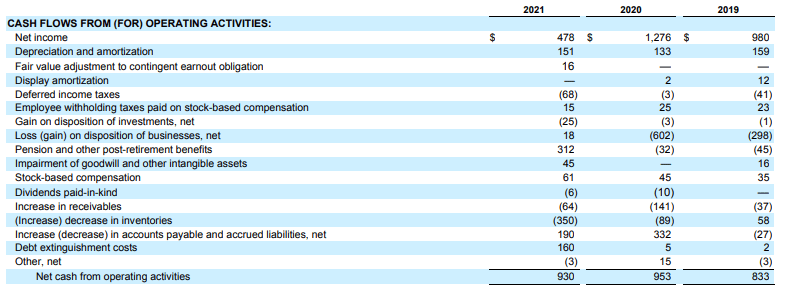
The summary below was prepared using the data within the cash flow statement. At the end of 2020, the company had +$1.3B in cash. They ended the current year with +$926M. As can be seen, the +$400M net change during the year was driven by cash received from operations of +$930M and +$1.3B spent on financing activities, which was primarily related to dividend payouts and share repurchases.
Various metrics were utilized to assess the safety of the shareholder payouts. When considering just the dividend payments, the coverage is strong. For example, both operating and free cash flows exceed total dividend payments by more than 3.5x. Additionally, while dividends as a percentage of net income increased in 2021, the payouts are still less than 60%, which indicates strong coverage.
When combining repurchases to the dividend payments, the coverage falls significantly. This should be expected since the vast sum of payouts are in the form of repurchases. This can signal confidence in the stock, or it could be EPS management. A higher degree of coverage is desired, but the company is generating ample cash flows and is maintaining a sizeable cash balance. So, this is not as great of a concern.
Author’s Summary of Cash Flow Statement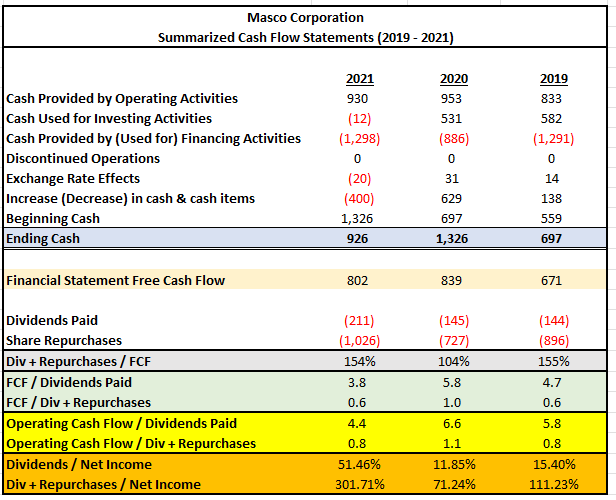
MAS is consistently generating strong cash flows, despite a challenging operating environment that continues to negatively impact margins. In addition, the company is repurchasing a significant quantity of their stock, while also providing a steady dividend payment to their shareholders that is well-covered by net income and both operating and free cash flows. As such, it is appropriate to assess cash flow strength as above average.
Intrinsic Share Price
Various methodologies were utilized to obtain an indication of the intrinsic share price of MAS. The results are provided in the chart below. The quickest methods involved simply applying the historical multiples to current pricing. Doing so yielded target prices with a low of $62 to a high of $69. The $33 price point indicated by the price/book multiple was an outlier, so that is being eliminated from consideration.
When applying models involving future cash flows, results came in at a low of $54 and a high of $69. With these models, the rate on the 10-YR U.S. Treasury is a critical variable in the computations. Since rates are projected to increase, the model incorporated the current rate, which was 2.5% at the time of analysis, as reported in The Wall Street Journal. For hypothetical purposes, the analysis also utilized a rate of 3%.
When considering the results of all methods, the average target price is approximately $65, rounded up.
Author’s Summary of Various Intrinsic Share Price Calculations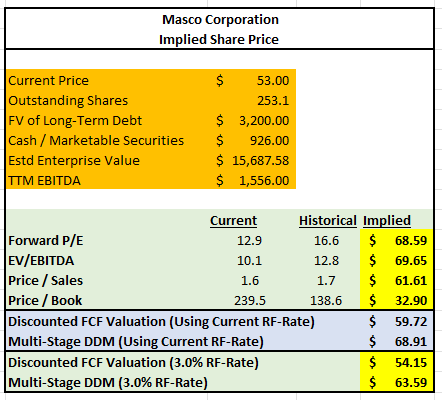
For illustrative purposes, what follows is an expansion of the results of the FCF valuation method.
The first step in the model was to input the historical data from the past five years. For simplicity, a fixed tax rate of 24% was used for all periods in arriving at NOPAT. This tax rate is consistent with current period rates. Furthermore, total operating capital was defined as the combination of total current assets and net PP&E, less total current liabilities. The net new operating capital was simply the year-over-year change. FCF, then, was the difference between NOPAT and net new operating capital.
Author’s Calculations of Historical FCFs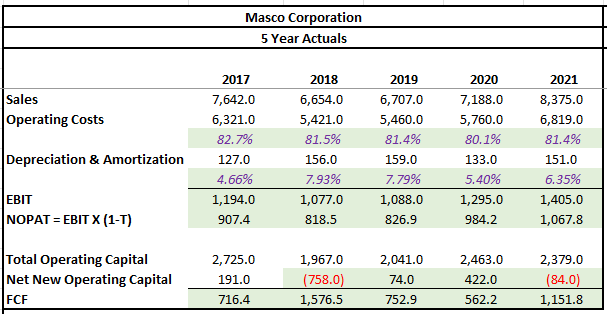
The next step in the model was to input the various assumptions required to calculate the future cash flows to the company. The growth rate of sales for this model was expected to be in the mid-single digits with long run FCF growth settling in at 4%. The sales figures are generally in-line with management’s outlook. The long-run FCF growth, on the other hand, was meant to track long-run GDP growth, which is projected to be in the low-single digits.
Operating costs as a percentage of sales have historically been in the low 80s, while depreciation and amortization as a percentage of operating capital has been around 6% over the past two years. For this model, higher percentages for operating costs were used for near-term periods before returning to more normal levels in the later years. Depreciation was kept at 6.5% for all periods.
Finally, the discount rate was obtained by applying the CAPM formula. This formula incorporates the stock beta, the risk-free rate, and an expected risk premium. The beta of MAS is 1.38, as reported in Morningstar. The risk-free rate was 2.50%, as stated earlier. The historical risk premium is 5.5%. Thus, the expected return on market is 8.0%. The result of the CAPM upon inputting these variables is 10.09%
Author’s Model Assumptions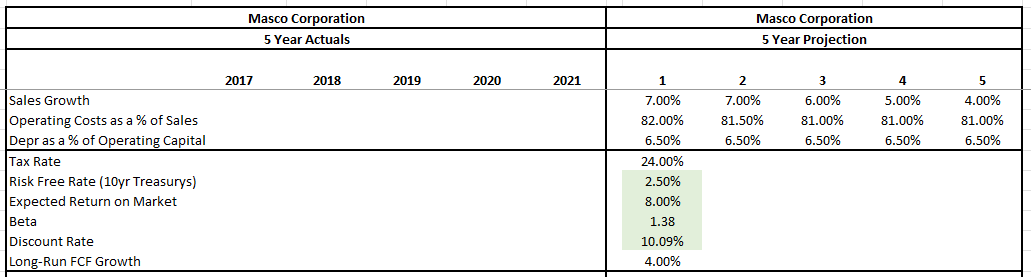
The summary below provides the projected FCFs over the next five years. The results of this model are on the conservative side to account for the risk of deviations and setbacks from management’s outlook.
Author’s Full Projections of Expected Future Cash Flows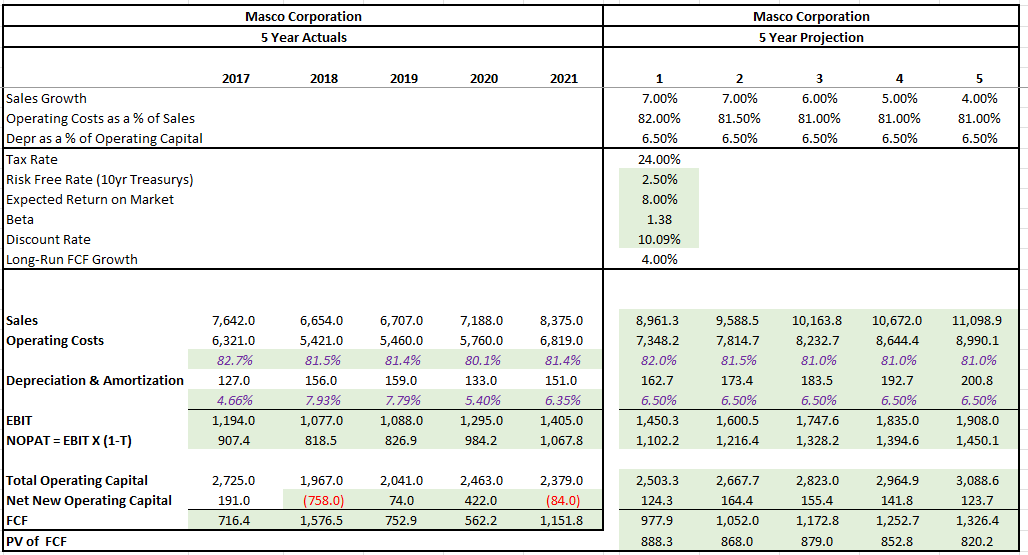
The final step in the model was to calculate the terminal value using the long-run FCF growth rate and combine that result with the sum of the present value of the future FCFs above. Additionally, the market value of debt needed to be deducted from the totals to arrive at the intrinsic value to common shareholders. In the notes to the financial statements, it was disclosed that the market value of debt was +$3.2B. Therefore, that is what was used in the calculation.
Author’s Final Intrinsic Share Price Calculation Using DCF Method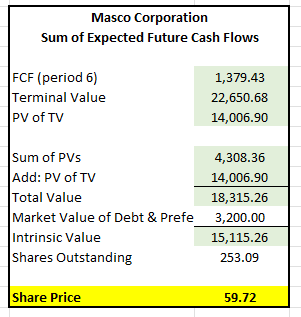
As seen above, the intrinsic share price using this model is $59.72. Taken together with the other methods, this further supports a target price of $65.
Primary Risks
MAS business strategy is focused on residential repair, remodeling activity, and new home construction, all of which are affected by various economic factors such as, consumer confidence, existing home sales, consumer income and debt levels, and household formation, among other factors. Declines in the housing market or the consumer’s overall financial position would negatively affect the results of operations of the company.
The company’s products are manufactured using significant amounts of raw materials, component parts, and finished goods that are obtained from outside sources, including international markets. Continued increases in the costs of these materials and/or disruptions in supply will further negatively impact the company’s margins. In addition, water is a significant component of the company’s architectural coating products. Shortages and restrictions in certain regions on the use of water may hinder the ability of the company to produce these architectural products.
In 2021, approximately 20% of the company’s net sales were originated outside of North America. In addition to the company’s European operations, MAS manufacturers products in Asia and sources their components from third parties globally. Exposure to international markets subjects the company to the risk of potential economic/political instability in the host country. Additionally, the company may be negatively impacted by geopolitical conflicts that may arise between the U.S or their allies and any of the countries that the company operates in. Tariffs and counter-tariffs, increased regulation, boycotts, and long-winded lawsuits are potential complexities that could raise the cost of doing business for the company.
In addition to oversees exposure, the company faces concentration risk. In 2021, net sales were concentrated to three significant customers, The Home Depot, Ferguson, and Lowe’s. Sales to The Home Depot alone accounted for 36% of consolidated sales, while sales to Ferguson and Lowe’s were each less than 10% of consolidated sales. A loss of any of these customers or a significant decline in the economic condition of any of the three would have a material impact to the company’s operations.
Conclusion
MAS is a leading provider of home improvement and building products that has benefitted from the strong housing market over the past several years. Input cost inflation and logistical challenges, however, have negatively impacted margins and rising interest rates and declines in consumer confidence are further headwinds moving forward. Despite this, the financial position of the consumer is strong and housing demand remains robust. The declining value of MAS is at odds with these underlying strengths.
In addition to supportive economic factors, the company also has solid fundamentals. At the end of 2021, the company had over +$900M in cash on hand, and there are no apparent indications that the company’s short-term financial position or long-term viability are at risk. In addition, the company is generating strong cash flows and returning a large portion of it to shareholders in the form of buybacks and dividends.
At present, the share price of MAS appears undervalued. Their current pricing multiples are lower than historical averages, and the intrinsic value of the shares indicate modest upside. At a target price of $65, the shares are approximately 20% undervalued and a good fit for any portfolio that remains bullish on the housing market.
Be the first to comment