

I will go to my grave… believing that really loose monetary policy greatly contributed to the Financial Crisis. There were obviously problems with regulation, but when we had a 1% Fed Funds rate in 2003 after, to me, it was pretty obvious that the economy had turned (up) and I think the economy was growing at 7% to 9% nominal in the fourth quarter of 2003 and that wasn’t enough for the Fed. They had this little thing called “considerable period” on top of the 1% rate just so we would make sure that their meaning was clear. And it was all wrapped around this concept of an insurance cut… I’ve made some money predicting boom-bust cycles. It’s what I do. Sometimes I am right. Sometimes I am wrong, but every bust I had ever seen was proceeded by an asset bubble generally set up by too loose policy…”
– Stanley Druckenmiller
“Try to buy assets at a discount rather than earnings. Earnings can change dramatically in a short time. Usually, assets change slowly. One has to know how much more about a company if one buys earnings.”
– Walter Schloss
“A 60:40 allocation to passive long-only equities and bonds has been a great proposition for the last 35 years… We are profoundly worried that this could be a risky allocation over the next 10.”– Sanford C. Bernstein & Company Analysts (January 2017)
“Bull markets are born on pessimism, grow on skepticism, mature on optimism, and die on euphoria.”– Sir John Templeton
“Life and investing are long ballgames.”
– Julian Robertson
Introduction
I have been writing about the flawed current structure of the stock market for some time, highlighting how crowded trades were poised to unwind with a series of public articles, including these selected entries:
Be Prepared For A Crash – Published On October 26th, 2017
Be Prepared For A Crash – Part II – Published On February 6th, 2018
Crowded Trades Are Unwinding, With One Big One Left To Go – Published On November 14th, 2018
Parallels Of Index Funds To Subprime CDOs – Published September 5th, 2019
The SPY Shows The Current Market Structure Has Not Reversed Yet – Published March 2nd, 2020
Financial markets continue to exhibit extraordinary volatility, including the single worst day for oil since 1991, a day that saw the United States Oil Fund (USO) lose more than 25% of its value as shown below.
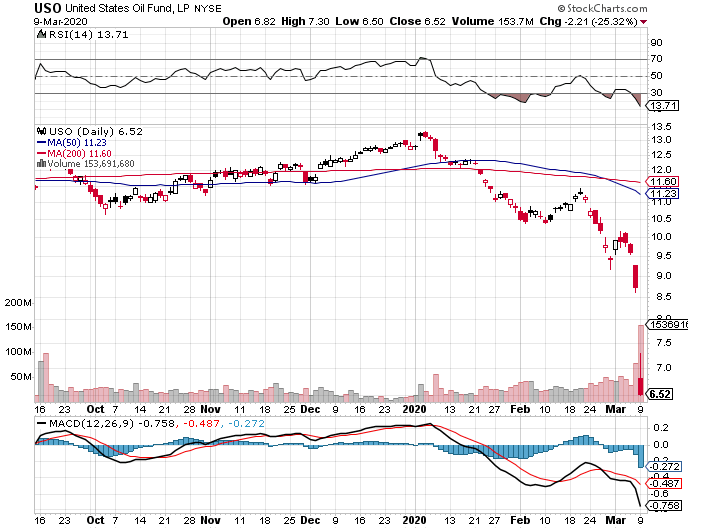 (Source: Author, StockCharts.com)
This extraordinary price action has continued throughout the week, with the Dow Jones Industrial Average, as measured by the SPDR S&P Dow Jones Industrial Average ETF (DIA), regularly swinging more than 1,000 points during market trading sessions, and that level of volatility is set to continue this morning, with futures indicating the Dow Jones Industrial Average opening down more than a 1000 points.
Throughout the extreme levels of volatility, the market structure has largely held intact, until yesterday, which saw both the iShrares 20+ Year Treasury ETF (TLT), which finished down 3.7%, and the SPDR S&P 500 ETF (SPY), which finished down 4.9%, decline together, striking a blow to the risk parity trade, which was made popular by Ray Dalio and Bridgewater.
Adding to the narrative, traditional safe-havens like Utilities Select Sector SPDR Fund (XLU) and the VanEck Vectors Gold Miners ETF (GDX) declined 5.0%, and 8.4%, respectively. Bitcoin (BTC-USD), a relatively newer safe-haven, even finished down 7%, as measured by the Grayscale Bitcoin Trust (GBTC).
REITs, which had been benefiting from lower interest rates, also sold off sharply, with the iShares U.S. Real Estate ETF (IYR), down 5.8%, and bellwether REITs Realty Income (O) and Simon Property Group (SPG) down 4.0%, and 8.9%, respectively.
Thus, it was truly a risk-off day, however, the biggest takeaway is that long duration bonds did not serve as a safety net for declining U.S. equities. The importance of this cannot be understated, as stocks and bonds have both generally risen together, and when stocks did suffer abrupt declines, like in the fourth quarter of 2018, or more recently, bonds cushioned the blow, reinforcing the merits of a risk parity strategy. However, that all could be changing right now, as bonds and stocks decline together.
Investment Thesis
The current market structure has not been challenged yet, however, if stocks and bonds continue to sell off together, that will usher in a new era, which might be the catalyst needed to spark a historic capital rotation.
TLT and SPY Decline Together
The short-term charts of the iShares 20+Year Treasury ETF, and the SPDR S&P 500 ETF, both shown below, illustrate yesterday’s declines, which were 3.7% and 4.9%, respectively, and highlight the recent levels of extreme volatility.

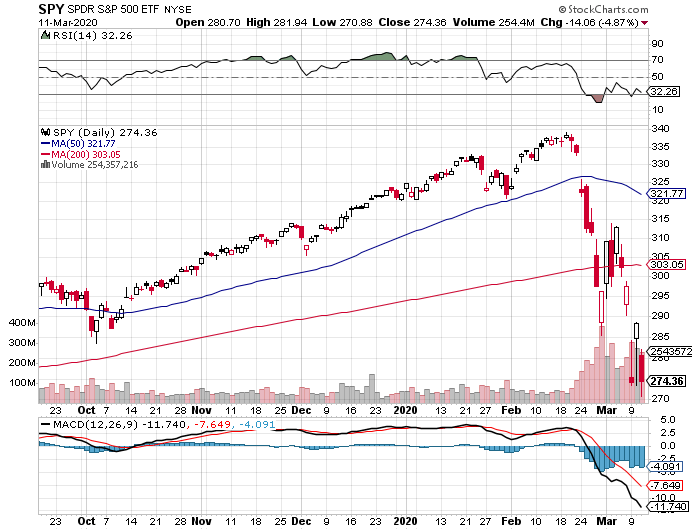 (Source: Author, StockCharts.com)
The magnitude of the daily moves are eye opening, and from looking at the chart above, you can see that TLT served as an initial safe haven in the broader equity market sell-off, however, it fumbled the ball in a big way yesterday.
Bigger picture, bonds and stocks have risen together, as the following long-term charts illustrate.
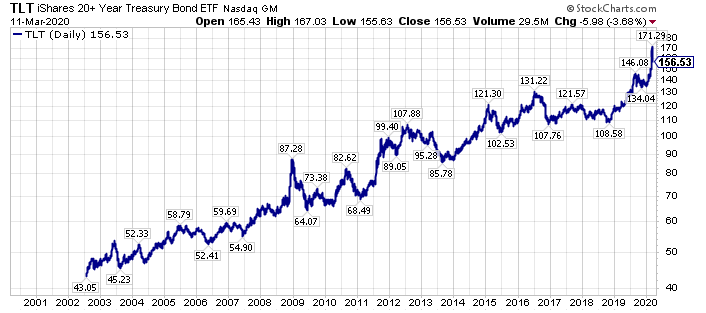
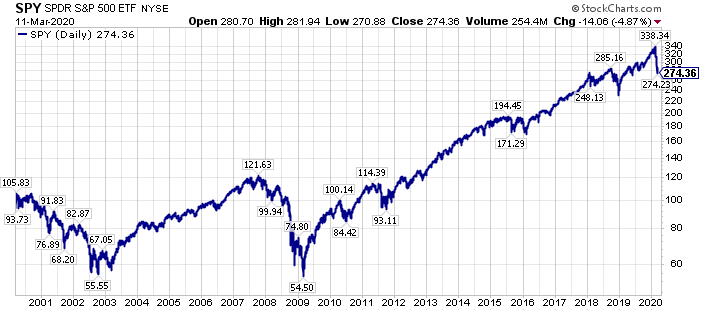 (Source: Author, StockCharts.com)
Could we be at an inflection point, where both bonds and stocks start to decline together?
This is an incredibly important development to watch going forward.
Traditional Safe Havens Also Declined Yesterday
In normal sell-offs, utilities and gold mining shares normally serve as safe harbors.
When market declines really gather steam, though, which we last really witnessed in 2008, even traditional safe havens are challenged, and that was certainly the case yesterday, with the Utilities Select Sector SPDR Fund, and the VanEck Vectors Gold Miners ETF declining 5.0%, and 8.4%, respectively.
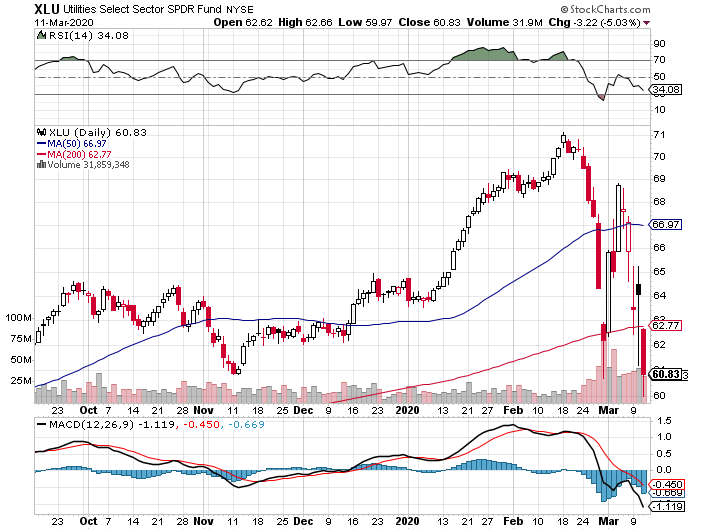
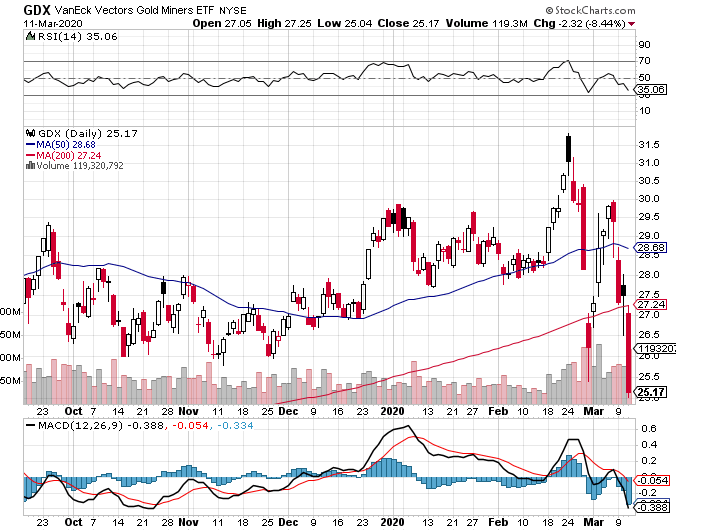 (Source: Author, StockCharts.com)
From a bigger picture perspective, utilities, which have benefited from lower interest rates, and falling energy input prices, could have a steep relative decline ahead if these favorable tailwinds turn into headwinds.
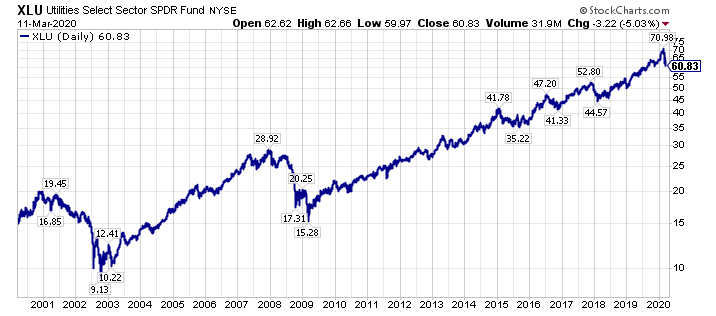 (Source: Author, StockCharts.com)
A few days ago, rising interest rates, and rising natural gas prices, seemed like a distant dream, however, the United States Natural Gas Fund (UNG), is up 9.2% this week, as I detailed here, as TLT is down 6.1%, and SPY down 7.8%, as I write this piece Thursday before the market’s opening bell.
Rising energy prices, rising interest rates, and falling stock prices have combined to weigh on utility shares, as measured by the XLU, which are down 9.4% this week, in a rare show of underperformance from this steady as she goes sector.
More Recent Safe Havens Are Challenged Too
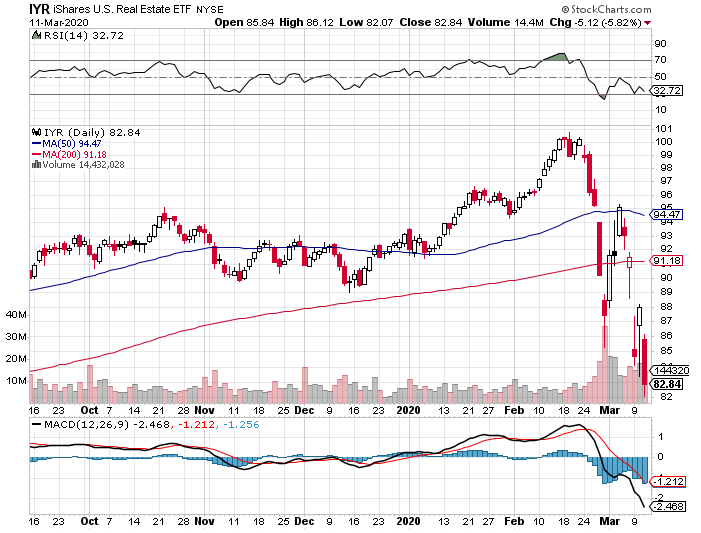
Yesterday’s sell-off also dinged more recent safe-havens, including Bitcoin, as measured by the Grayscale Bitcoin Trust, and REITs, as measured by the iShares U.S. Real Estate ETF, which declined 7.0%, and 5.8%, as shown below.
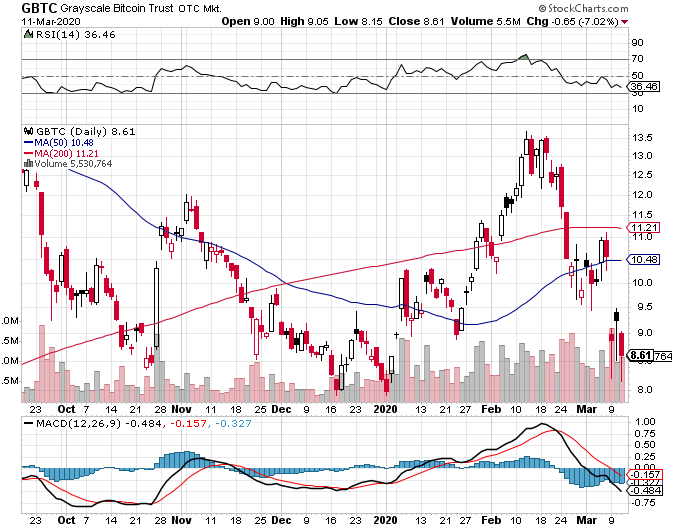
 (Source: Author, StockCharts.com)
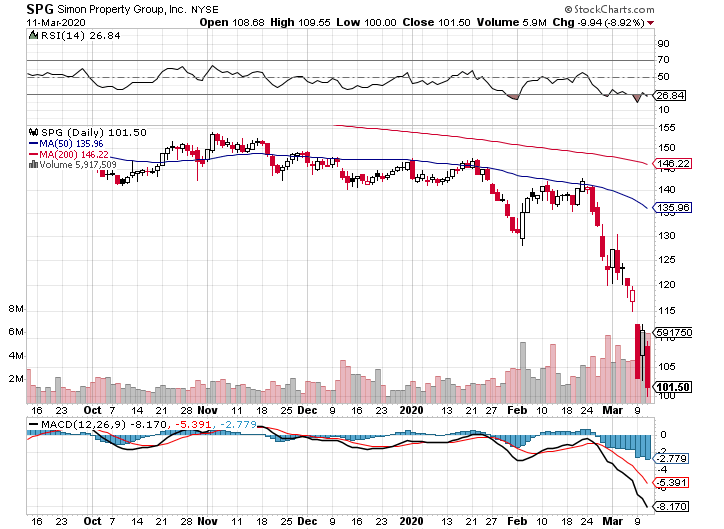
Within the REIT sector, even bellwether stocks like Realty Income and Simon Property Group, which declined 4.0% and 8.9%, respectively, yesterday, have faced forced selling, with the former holding up much better, thus far, than the latter.

 (Source: Author, StockCharts.com)
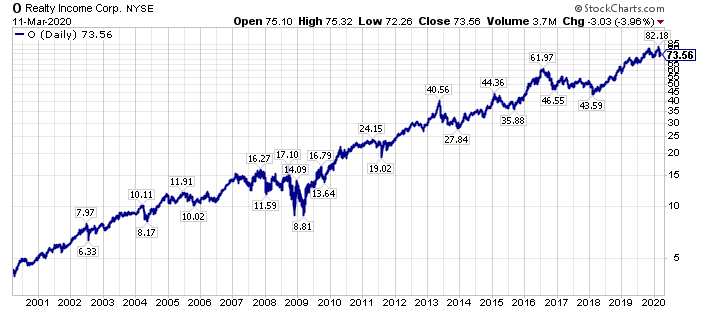
Personally, I’m watching Realty Income very closely as its long-term performance has been out of this world, and it’s perceived to have a rock-solid balance sheet, so it’s viewed as perhaps the ultimate safe haven in REITs.
 (Source: Author, StockCharts.com)
If this proverbial strong moat is breached, and the castle is assaulted by higher long-term interest rates, and a challenged economic outlook, amplified by the negative wealth effect of lower stock prices, then the market structure could really be changing as investors abandon winners of the last decade, and search for the new outperforming asset classes in a changing investment landscape.
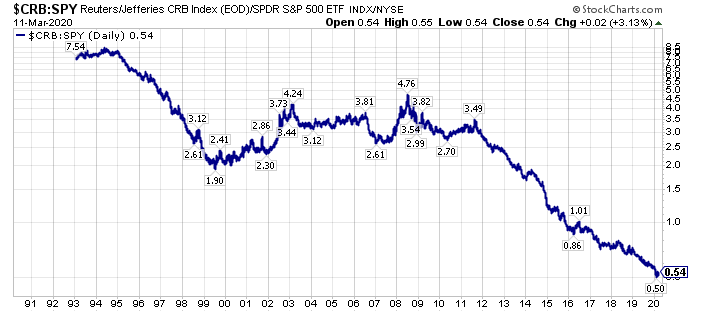
Ironically, much like very few investors wanted to own Realty Income, or REITs, in the late 1990s, very few investors want to own what I think are the cheapest securities today, which are downtrodden commodity equities, as commodities are trading near 100-year lows to equities.
 (Source: Author, StockCharts.com)
Wrapping up, it will be interesting to see if the commodity sector, the out-of-favor major asset class among its peers, which are bonds and stocks, can begin to outperform.
Closing Thoughts – Risk Parity Has Suffered A Blow
For all of the volatility we have seen the last several weeks, the current market structure has stayed largely intact. When stocks have declined, bonds have served as a safe haven, and commodities, led by energy, have underperformed massively, as I illustrated in a private write-up on Monday. This market structure has begun to unwind, though, as yesterday’s price action, where long duration bonds, and U.S. stocks, declined together, could be a watershed moment.
Building on this narrative, even the bluest of the perceived blue chips, including Procter & Gamble (PG), which I believe is historically overpriced, as I illustrated in public SA deep-dive on PG last September, are starting to be impacted by the changing market structure, with PG shares declining 7.4% yesterday.
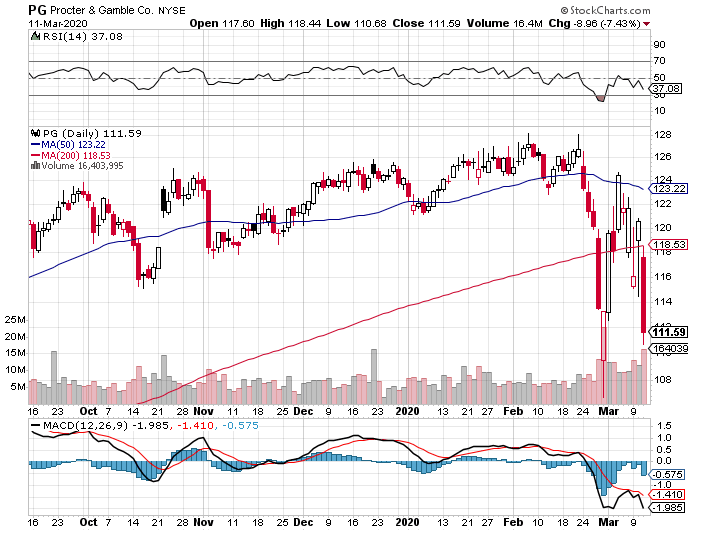 (Source: Author, StockCharts.com)
If risk parity has truly ended, the massive tailwind that has been behind perceived quality equities could turn into a massive tailwind, particularly as long-term interest rates rise.
Bigger picture, I think it’s only a matter of time until a historic capital rotation from growth-to-value takes place, led by a rotation from the most loved and in-favor sector today, technology, to the least loved, and most out-of-favor sector today, which is of course, the energy sector.
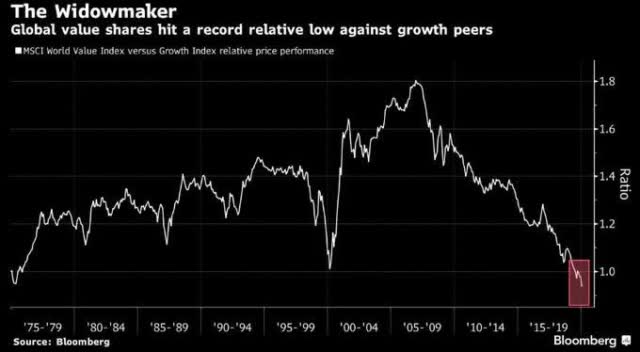
(Source: Bloomberg)
With this investment backdrop, the hidden historic opportunity, the proverbial forthcoming golden age of active investing, lies in cast-aside, out-of-favor, non-correlated equities – including energy equities, which are historically loathed. More specifically, from my vantage point there’s a generational opportunity in the downtrodden leading U.S. natural gas producers. Several of these were S&P 500 Index stalwarts 10 years ago, yet they have been summarily kicked to the curb even though their reserves and cost of production are materially better – sometimes by a factor of three times or more. These producers have collectively lowered their breakeven profitability levels dramatically vs. their peer group from a decade ago. As a result net income and, more important, free cash flows, should surge at higher natural gas prices – particularly above $3, which I believe is a mathematical inevitably.
There is historic opportunity in the investment markets today. I have spent thousands of hours analyzing the markets, looking for the best opportunities, looking to replicate what I have been able to accomplish in the past. From my perspective, the opportunities in targeted out-of-favor equities today are every bit as big as the best opportunities in early 2016, and late 2008/early 2009. For further perspective on these opportunities, consider a membership to The Contrarian, sign up here to join.
Disclosure: I am/we are long UNG, AND SHORT PG AND SPY IN A LONG/SHORT PORTFOLIO. I wrote this article myself, and it expresses my own opinions. I am not receiving compensation for it (other than from Seeking Alpha). I have no business relationship with any company whose stock is mentioned in this article.
Additional disclosure: Every investor’s situation is different. Positions can change at any time without warning. Please do your own due diligence and consult with your financial advisor, if you have one, before making any investment decisions. The author is not acting in an investment adviser capacity. The author’s opinions expressed herein address only select aspects of potential investment in securities of the companies mentioned and cannot be a substitute for comprehensive investment analysis. The author recommends that potential and existing investors conduct thorough investment research of their own, including detailed review of the companies’ SEC filings. Any opinions or estimates constitute the author’s best judgment as of the date of publication, and are subject to change without notice.
Be the first to comment