

trait2lumiere
There are multiple approaches to assessing overall market psychology at crucial turning points.
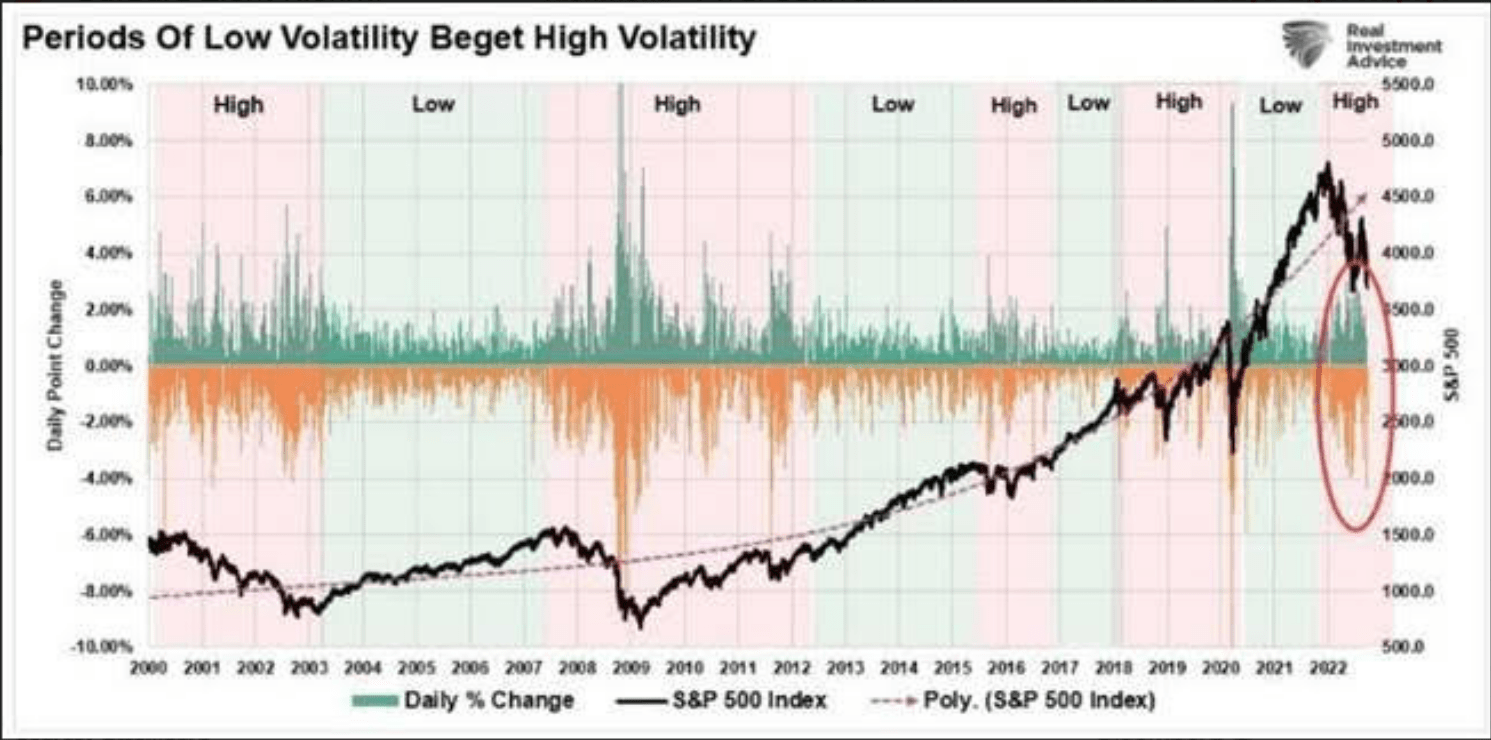
Two relevant correlations, the S&P500 Net Non-Commercial Futures and the S&P 500 Daily Point Change (volatility) have an extensive history and have been reported on multiple sites. These histories from 2008 and 2000 respectively make identical points despite having different perspectives.
The first, futures net positions, and the second, daily volatility, indicate high levels of pessimism and uncertainty, i.e., investor confusion on what to do, and have a history of identifying important market lows. Prices are determined by consensus market psychology but also provide feedback as a self-promoting mechanism. Those who rely only on price direction to invest amplify that direction as others join the trend believing the same.
This investment activity occurs with near zero attention to any fundamental consideration. There is no off-ramp for many but a change in price trend that forces reconsidering prior assumptions. When headlines are filled with pessimism, the market reflects bearish positioning and high daily volatility. The opposite is true when headlines are optimistic.
The current pessimism is so intense that future positions and volatility equal or exceed past periods. History is long enough with this data that it becomes a valuable market contrarian signal. Investor sentiment is so bearish that it becomes a bullish signal.

Equities remain favored in the current climate of fear with fixed income to be avoided by my analysis.
Editor’s Note: The summary bullets for this article were chosen by Seeking Alpha editors.
Be the first to comment