

Last month, I published a list of Magic Formula stocks that all had $2.5bn or greater market cap. In this update, I intend to look into how certain companies or segments of that selection have performed and how the Magic Formula selection has changed.
For those unfamiliar with the Magic Formula: its mechanics and merits were well explained in The Little Book That Beats the Market by Joel Greenblatt. The basis is ranking stocks according to earnings yield (EBIT/EV) and return on capital. Greenblatt has a website that does this for us for free and provides a list of up to 50 (statistically) undervalued companies. This method of stock picking has been highly successful according to Greenblatt who claims it achieved annual returns of 30% up to 2008.
Review of the March Magic Formula selection
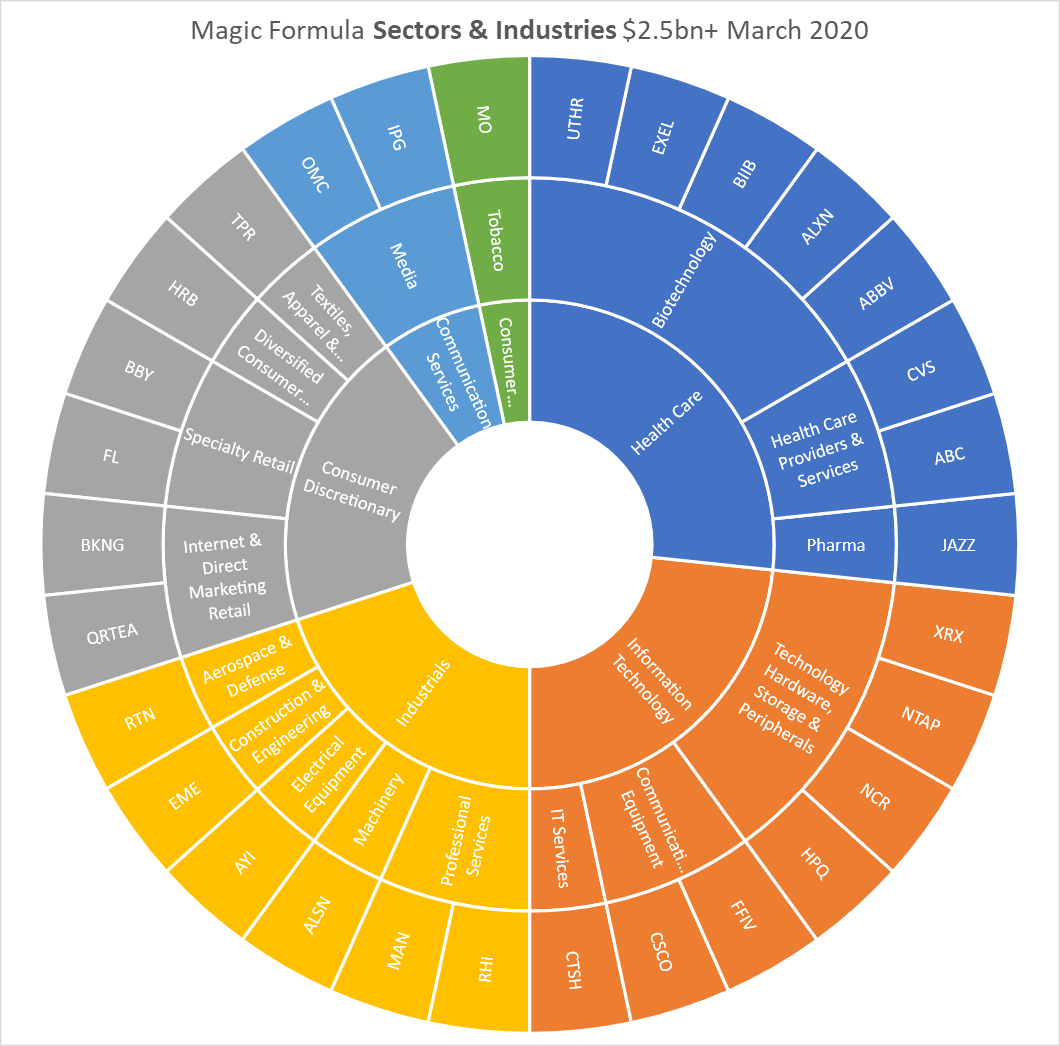
The chart below shows the 30 Magic Formula stocks that I identified last month according to their GICS sector and industry classification.
Source: compiled by author using GICS sector methodology.
The list of last month was filled with IT and Health Care. With the benefit of hindsight, one would guess that these stocks have done well with the COVID-19 themes of social distancing and increased health care consumption.
The actual result is shown below. The list is sorted according to the one month return since the publication of my last article. The other data in the table is from March.
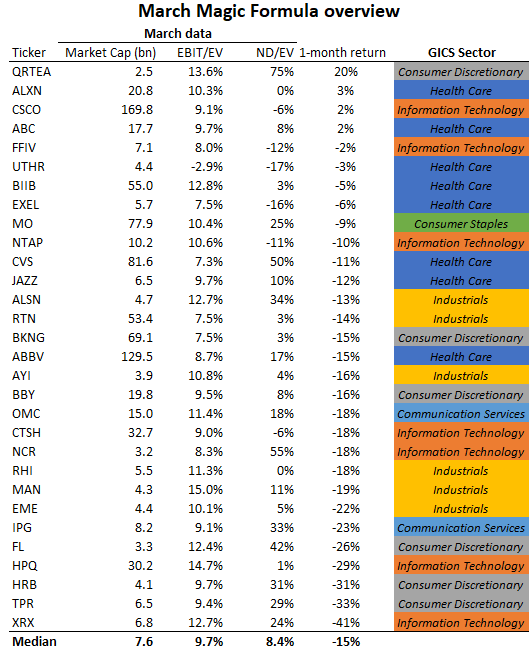
All used figures are USD. Source: Market Cap, EBIT, EV were directly sourced from Seeking Alpha and as of March 3. 1-month return was the return of the last month up to April 7, sourced from Seeking Alpha (1 month after the publication date of the original article). The one month return of RTN was calculated manually to account for the stock split into 2.3348 RTX units.
There is a big sector effect on performance. Health Care is a clear winner, while Consumer Discretionary has performed poorly mostly with one notable exception. Interestingly, IT is all over the place. Another correlation that I found was an obvious one: companies with a higher ND/EV at the start of the month did worse than companies that had a low or negative net debt.
We can take Foot Locker (FL) and Best Buy (BBY) as an example of the impact of leverage. Both are retail chains and one would think that Best Buy could be hit hard by social distancing because electronics are maybe easier bought online at Amazon (AMZN) for example than shoes and apparel (which people want to fit first). However, Foot Locker underperformed Best Buy by 10%-points. The reason is probably the large debt load of FL compared to its EV (42%), while BBY is at only 8%. If we look at the decline in enterprise value instead of market cap, FL and BY performed similarly.
The top performer was Qurate Retail (QRTEA). It helped that the stock was beaten-down after its earnings just a week before I compiled the list for my March article. I suspect that its online marketing and retailing theme is doing well with investors in the stay-at-home economy.
The worst performer was Xerox (XRX), which is a cyclical company that carries along a fair amount of debt and therefore had to terminate its takeover bid of HP (HPQ) that was to be mostly debt-funded.
Among the best performers were Health Care stocks Alexion Pharmaceuticals (ALXN) and AmerisourceBergen (ABC), both of which had a positive return over the month. ALXN is a BioTech company and the medicine angle is an obvious advantage. ABC is a pharmacy supplier, however. For that reason, I am a bit surprised that a pharmacy stock like CVS Healthcare (CVS) performed poorly compared to its peers and was down 11%, outperforming other MF stocks by just 4%. But a somewhat negative update by Walgreens Boots (WBA) clarifies why the industry performed poorly. ABC, on the other hand, could be profiting from specific COVID-19 related trading opportunities.
One disappointing performer is Booking Holdings (BKNG), the only stock on the list that I held prior to my article. As events unfolded, I decided to sell the stock as it seemed to me that many were underestimating the duration of limited travel. The reason why such a travel-exposed stock hasn’t performed even more poorly is its relatively low fixed cost base and strong cash position. Of BKNG’s revenue, about a third converts to EBIT and another third is spent on marketing. Performance marketing is easily scaled back, so I can see how Booking could remain cash flow positive in 2020 if its revenues are ‘just’ cut in half. I fear that it will be worse than that, however.
The new list
As market prices change, so does the Magic Formula list. The formula spits out the following list of names with the prices of April 8.
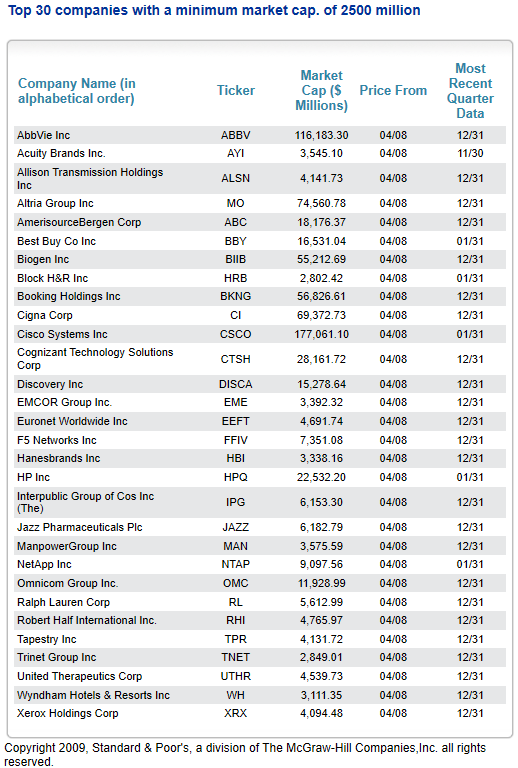
Source: magicformulainvesting.com.
Six names dropped from the list. An overview of the dropouts is shown below.

Source: compiled by author using GICS sector methodology. Tickers in black no longer appear in the MF screen of April.
For Foot Locker and NCR Corporation (NCR), it is straight forward why they are no longer included: their market cap fell below the $2.5bn threshold. Raytheon (RTN) merged with United Technologies to form Raytheon Technologies (RTX) and is off the list for that reason but I did like it in my previous MF note and have written an article about the merger as well. At the time, I thought that the exposure of the combined company RTX to commercial aviation was overestimated by the market.
Qurate Retail (QRTEA) and three of the Health Care stocks performed well enough to lose their spot on the Magic Formula list. Their spots were claimed by several new names, which are shown below.

Source: compiled by author using GICS sector methodology. Tickers in black are new additions in April.
I find it striking how little the sector composition has changed. The net result is that Health Care lost two names while Communication Services and Consumer Discretionary added one each.
At the industry level (as opposed to the sector level) there were quite some changes. Given the obvious pressure on retailers, it should be no surprise that Textiles, Apparel & Luxury Goods added two names with Ralph Lauren (RL) and Hanesbrands (HBI). Both companies own well-known brands and earn a high return on equity. Hanesbrands trades at a ttm EV/EBIT of 7.35 (as of April 8), and Ralph Lauren at an EV/EBIT of 8.95.
Apart from the industry they are in, they have different reasons to be relatively cheap. Ralph Lauren has lost revenue over the past 5 years, which is a structural problem. Hanesbrands has a lot of leverage – $3.6bn according to data compiled by Seeking Alpha. The leverage is apparently seen as a threat to the company, as the trailing P/E is just 5.6.
Wyndham Hotels & Resorts (WH) introduces a new industry in the chart that I expected to appear. The hospitality industry has been hit particularly hard in March by travel restrictions and social distancing, sending their stocks down, but that hasn’t shown up in last year’s earnings of course. Given the bleak prospects that I also observed with Booking, I’m not sold on this industry. Its trailing P/E is over 20 and the net debt/EBITDA ratio is 3.7. With ND making up roughly 40% of its EV, you can expect ample volatility with this stock.
Another quite predictable entrant is TV network Discovery (DISCA). Like ViacomCBS (VIAC), which is down over 60% YTD, Discovery is highly levered, and perceived to be in secular decline (so value already). To add insult to injury, the networks now have the added challenge of plummeting advertising revenues due to the current economic environment. This could be partly compensated for by higher viewership as well as stable affiliate revenues (i.e. payments by subscribers at cable companies). The point is that, on the revenue side, Discovery is probably not as cyclically challenged as certain hospitality businesses.
Cigna Corporation (CI) is a new entrant and is in the Health Care Providers & Services industry. The company provides insurance and related products and services. A big part of the reason that it appears on the list is because its balance sheet has been filled with goodwill last year, which is excluded in the return on capital calculation used by the Magic Formula.
Euronet Worldwide (EEFT) replaced NCR Corporation on the Magic Formula list and coincidentally both have ATM exposure in their core business. While Euronet is weighted towards software, NCR was the hardware play. The reason why EEFT is so cheap right now probably has to do with the fact that most of its revenue and earnings come from its segment that operates over 40 thousand ATMs. In the COVID-19 world, cash is seen as a possible carrier of viruses and bacteria, so ATM use is clearly under pressure. The stock has lost heavily this year, so investors have to weigh its other business units and the cheap valuation against the possibility that people will not make a lasting habit out of shunning cash.
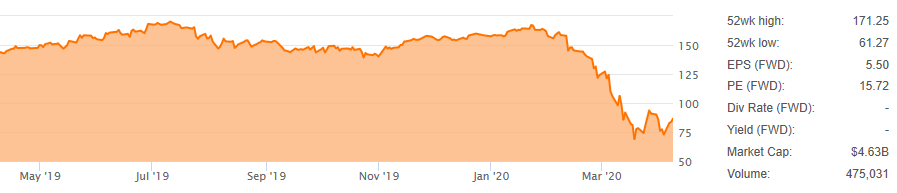
EEFT stock quote 04/09/2020. Source: Seeking Alpha.
The last addition to the list is Trinet Group (TNET), a company that provides HR solutions for small and midsize businesses. A large part of the business is providing employee benefit services. From what I have read, the company is exposed to health insurance claims and this could play a part in why there is so much pressure on the stock lately. At a trailing EV/EBIT of 11.25, it is not the cheapest Magic Formula stock out there, however.
Conclusion
After one month full of movements, several well performing Health Care stocks have made room for Consumer Discretionary stocks and other cyclicals that are particularly hurt by macro economic developments of the past month.
I’ll be curious to see if the new names will add alpha over the next couple of months as I expect more market volatility ahead. As before, I will keep analyzing names on the list in-depth from time to time.
Disclosure: I am/we are long VIAC (via calls). I wrote this article myself, and it expresses my own opinions. I am not receiving compensation for it (other than from Seeking Alpha). I have no business relationship with any company whose stock is mentioned in this article.
Editor’s Note: This article discusses one or more securities that do not trade on a major U.S. exchange. Please be aware of the risks associated with these stocks.
Be the first to comment