

AmnajKhetsamtip/iStock via Getty Images
Dear Friends & Partners,
Our investment returns are summarized in the table below:
|
Strategy |
Month |
YTD |
12 Months |
24 Months |
Inception |
|
LRT Economic Moat |
+13.58% |
-19.98% |
-19.49% |
+6.99% |
+22.50% |
Results as of 7/31/2022. Periods longer than one year are annualized. All results are net of all fees and expenses. Past returns are no guarantee of future results. Please contact us if you would like to receive a full performance tear sheet. Please see the end of this letter for additional disclosures.
|
Investment Terms and Service Providers |
|
|
Investment Structures: |
Delaware LP |
|
BVI Professional Company |
|
|
Management Fee: |
1% |
|
Performance Fee: |
20% |
|
High Water Mark: |
Yes |
|
Lockup: |
None |
|
Minimum Investment: |
$1,000,000 |
|
Redemption: |
Monthly, 30-day notice |
|
Auditor: |
EisnerAmper LLP |
|
Prime Brokers: |
IBKR |
|
Custodian: |
IBKR |
|
Fund Administrator: |
NAV Consulting |
|
Legal Counsel: |
Winston & Strawn LLP |
|
O’Neal Webster (BVI) |
|
|
Compliance: |
IQ-EQ (Blue River Partners) |
July’s results were excellent, with strong positive returns overall outperforming broad market indexes which themselves had a very strong month. We continue to expect strong returns in the months ahead and believe we can achieve a positive overall return for 2022.
As of August 1st, 2022, our net exposure was approximately 67.37%, and our beta-adjusted exposure was 45.31%. We currently have 55 long positions with the top 10 accounting for approximately 40.11% of our total long exposure.
During the month, broad market indexes rallied sharply as expectations of future interest rate increases declined. Market expectations are now for interest rate cuts to begin in the next few months – something that appears premature to me. The stocks that performed the best during July were generally companies with poor economic models and sub-par (if any) profitability.
This makes sense, because such companies would benefit most for a lower cost of capital and lower discount rates. For example: Carvana (CVNA), the purveyor of used cars which has continued to incinerate investor’s cash, rose more than 29% during the month, while Beyond Meat, Inc. (BYND), the maker of “fake meat burgers”, whose losses seem to only grow with each quarter, rose more than 30%.
The expectations of a “Fed Pivot”, a move towards cutting interest rates, appear premature to us, despite many market indicators suggesting that inflation will decline in the months ahead. Because so much of how the Federal Reserve controls inflation is through its communication and setting market expectations, when markets move to price in lower future interest rates, the Federal Reserve is forced to raise interest rates higher than it otherwise would in order to affect the real economy.
As a result, because the expectations for future interest rates have declined, the Federal Reserve will now have to take more aggressive actions to tackle inflation.
We believe that the Fed’s fight against inflation is far from over, and that market participants may be underestimating how high interest rates will need to be increased to bring inflation under control. Recent comments from Minneapolis Federal Reserve President Neel Kashkari, who said that he is “[…] surprised by markets’ interpretation,” suggest that the Fed is trying to correct these market perceptions.1 If inflation continues be high, expect the Federal Reserve to continue raising interest rates aggressively.
We also expect more hawkish rhetoric from other Federal Reserve branch Presidents. July’s sharp market rally goes to show just how quickly short-term shifts in market expectations can result in big changes in short-term stock prices. The same can happen on the downside. As a result, we are very cautious in the short term, a fact that is reflected in our declining net exposure.
Target Corp. (TGT)
We currently hold a small, approximately 1.3% position in Target Corp. (TGT). This section was written by our summer intern Cristian Martinez, who is a rising sophomore at Rice University in Houston, with light edits by me.
Company Overview
The Target Corporation (TGT) operates retail stores that sell a variety of merchandise ranging from necessities such as food and hygiene products to discretionary products like children’s toys and electronics. The sale of this merchandise is done primarily through physical retail locations in all 50 US states. However, Target also sells its merchandise digitally through its online website which delivers merchandise to its customers in three ways: order pickup, drive up, and “Shipt”. The Target Corporation operates a single segment through 1,926 physical stores.2
Target is one of the largest US brick-and-mortar retailers and has successfully adapted to the competitive environment in the age of Amazon. As of 7/15/2022, TGT shares are down 36% for the year and down 44% since their all-time-high last year. The business is experiencing issues that are temporary in nature and we believe that the shares present an attractive opportunity at current prices. Target performed exceptionally well during the Covid-19 pandemic and its aftermath.
Unfortunately, the company was recently caught flat footed, as consumer preferences shifted towards more spending on services (such as travel), at the expense of physical goods. As a result, the company found itself with an excess of inventory which will likely pressure margins in the next few quarters. Target is not alone in this predicament as many retailers such as Walmart and Best Buy have experienced similar issues over the last few months. The Covid-19 pandemic created enormous difficulties for retailers in forecasting demand and appropriate inventory levels.
Clearing excess inventory will pressure margins in the short term, and while this is a clear negative for the company, we do not believe it detracts from the long-term attractiveness of the business. Target shares are currently “on sale” due to increased uncertainty about near-term operating margins – this we believe is an opportunity.
Weak consumer sentiment, a slowing economy, recession fears, along with a list of other problems have called Target’s margins and short-term profitability into question. Until the most recent earnings calls, Target and many other retailers were seeing record margins and consumer demand. This led to oversupplying of inventory with a now weaker consumer and that is temporarily damaging the operating metrics of Target and similar retailers. Target’s margins are among the highest in the retail industry, and although it will take a hit in the coming quarters the company’s operating margin will likely return to roughly 7% in the longer term.
While the stock is down sharply from the highs and the economy looks bleak, it is easy to be negative around Target. However, we believe that with the strongest margins in the industry, a healthy balance sheet, an incredibly well managed and integrated supply chain, huge scale and buying power, same day shipping, accretive partnerships, and a growing and increasingly more recognizable owned brands segment, the company will continue taking market share from struggling competitors over the medium to long term.
The strength of brick and mortar. For the fiscal year 2021, 78.2% of Target’s sales originated from physical retail stores and over 95% of its revenue was fulfilled by these stores.3 This is by design, and it is working. Pre-pandemic, Target’s physical stores had 11 quarters of comparable sales growth and 8 quarters of comparable sales growth since the pandemic.4 For the fiscal year 2020 comparable sales growth was 19.3% while fiscal year 2021’s comparable sales growth was 12.7%.5
Physical stores are at the heart of Target’s strategy. Thus, during the most recent fiscal year Target had a net addition of 29 stores and expects to add 30 net new stores per year.6 In addition to adding new stores, the company continues to focus on improving and renovating existing stores through its remodel program. So far, roughly half of Target’s stores have been remodeled through this program and it expects to remodel an additional 200 stores per year.7
Target’s physical store presence gives the company the ability to combine products with services that would otherwise be impossible to implement through a digital-only store. These include services such as seeing an optometrist while buying glasses and recently the ability for customers to get their ears pierced while buying earrings. The introduction of these services into Target stores is relatively new and provides yet another avenue of growth. These examples, among other product-service offerings, leverage Target’s physical store locations to create the convenience of a one-stop shop combined with unique product-service offerings.
Owned brands. Target is known for its in-house brands (owned brands). The product offering among Target’s owned brands varies across the merchandise spectrum from grocery items to furniture. Among these brands are those such as Archer Farms, Made by Design, and Good and Gather. For the fiscal year 2021 roughly 1/3rd of sales revenue was from Target’s owned brands which represent over 30 billion in sales.8
The company owns over 40 different brands. These products are a significant advantage for Target as they offer a combination of lower cost of goods, exclusivity, pricing power, and brand loyalty. The strengths of these owned brands are clear, as more than ten of Target’s owned brands individually generate a billion or more in revenue, and this segment grew by 18% in 2021.9
Growing online business. While physical stores are the focus of the strategy at Target, digital and online sales play an important role. Digitally originated sales are a key driver of Target’s growth and were accelerated by the Covid-19 pandemic. In Target’s 2021 Q4 earnings, 21.8% of sales were digitally originated.10 Although the percentage of sales originating digitally has decreased from a high of 22.1% in fiscal year 2020, it continues to drive increasing revenue growth at Target.11
In FY 2020 Target recorded 145% sales growth digitally and printed an additional 20% growth in digitally originated sales in FY 2021.12 The digital channel provides customers with easy access to Target’s merchandise through three avenues: pick up, drive up, and Shipt (Target’s same day delivery subsidiary). Target customers can sign up for a Shipt annual membership ($99 / year) which offers customers free shipping on orders over $35, similar to Amazon’s “Prime” membership.13
Additionally, over 95% of purchases made through the company’s online store are fulfilled by Target’s retail store.14 Therefore, the company’s digital presence provides all the benefits of an online marketplace such as widening the customer base, greater product offering, and ease of use without the issues of sourcing the products because they come directly from physical Target stores.
Additionally, the digital sales funnel, whether it be through the Target website or the app, allows Target to algorithmically cater its product offering to its customers. This has proven to be complementary to Target’s physical stores and will continue to be an important factor in the company’s growth.
Source: Target Corporation 2021 Annual Report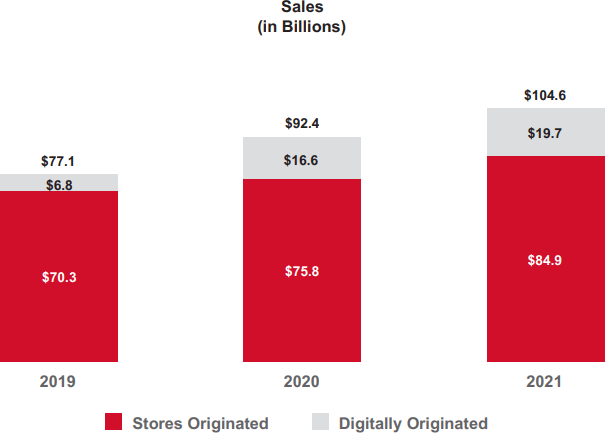
The power of the Target brand and reputation. It is difficult to establish an attractive and unique brand within retail, yet Target has done just that. Target consistently ranks among the most favored retail brands, especially among younger generations such as millennials and Gen Z. This is because of customer loyalty that the company has created for three main reasons: prices, product offering, and store/employee experience.
The Target Corporation is focused on offering low prices. This goes beyond their slogans and advertising. Target is committed to matching the price of any item in their store to the same price of an equivalent item. Target uses its scale to negotiate better prices with suppliers and in turn offers low prices to consumers. This, in combination with private label products (owned brands) gives Target significant pricing power as a result of the strength of the brands. Thus, Target can consistently match the price of any other retailer and provide equivalent or higher quality products for the same or even a cheaper price.
Source: YPulse Brand Tracker 2021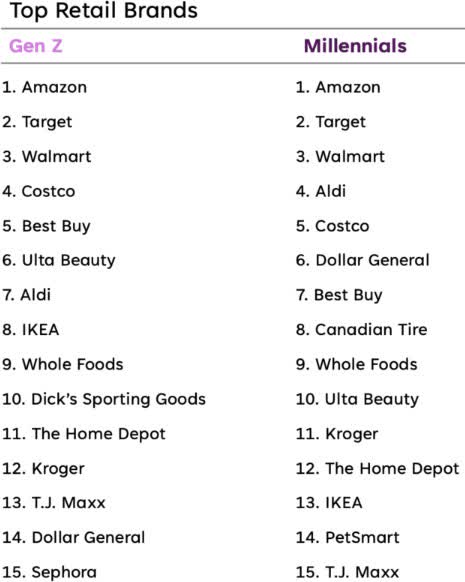
Target has five different product categories that encompass a wide variety of products. This diverse product offering gives the company the ability to meet a range of its customers’ needs and increase customer retention. Not only is there variety in the product offering, but there is quality. Target achieves this through direct quality control via its private label in addition to having high quality and name branded products.
The third key reason for the power of Target’s brand is its unique store and employee approach. Target’s stores are among the most modern and clean retail stores in the United States because of the company’s remodel program. This, combined with the ability to receive services tied to the products you are shopping for leverages the benefits of physical store locations. On top of this, Target leads its competitors in employee pay and compensation and attracts the highest quality employees in its industry. This is reflected upon the customer through consistency and quality.
Source: Target Corporation 2021 Annual Report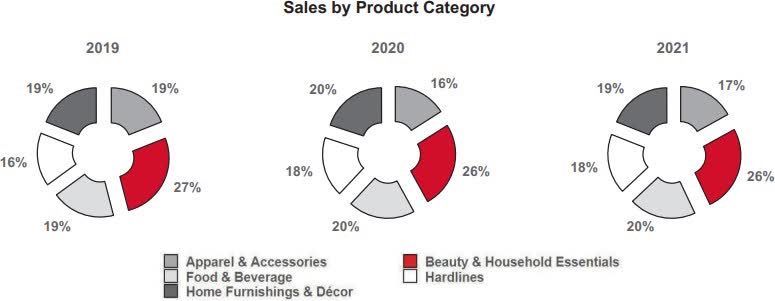
Partnerships. Target has partnered with several different companies to bring those companies’ respective stores physically within existing Target stores. These include businesses such as Disney, CVS, Apple, Ulta Beauty, and Starbucks. These partnerships have proven to be mutually beneficial to both Target and its partners and provide two key benefits to existing Target stores.
First, these partnerships provide incremental sales. For example, Target partnered with Ulta Beauty and entered into an agreement in which physical Ulta Beauty stores would be placed within Target retail locations. Over 100 of these Ulta stores currently exist with a plan to reach a total of 800 stores.15 The first 100 of these stores have shown that customers continue to purchase Target brands while additionally purchasing Ulta Beauty products.16 In its Q4 earnings call management stated that in the first 100 Target stores with an Ulta partnership they saw a 2x increase in the productivity of the rest of the store.17
The addition of partnership stores within Target locations is accretive to Target’s merchandise and provides increasing sales in products across the store but even more so in complementary products. This trend is not unique to Ulta Beauty and is seen across all of Target’s partnerships.
Second, these partnerships widen Target’s customer base and introduce new customers to the Target brand. With the case of the Ulta Beauty partnership, Target stores saw an increase in the number of mid-teens entering its Ulta Beauty partnered locations.18 Although the figures around new customers that are being introduced to Target from these partnerships are not disclosed, powerful and established brands being strategically placed within Target stores inevitably exposes the customers of these partnered brands to Target.
For example, if a customer was looking for Disney products and their nearest Disney store is in a Target store, they are forced to enter a Target store and inevitably pass Target’s merchandise like that of Disney such as toys. This inherently exposes someone that was originally a customer of Disney products to Target products.
The Growth Story Ahead
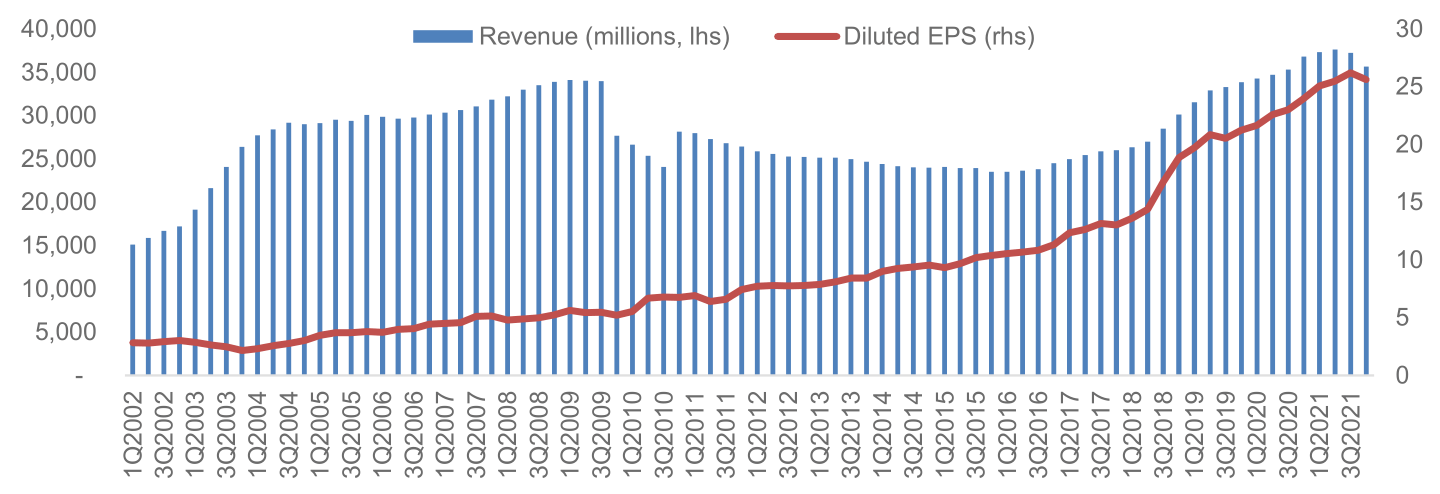
The Target Corporation has proven it can deliver consistent growth. The company has delivered revenue growth every year since 2017 from 70 billion to 106 billion in the most recent fiscal year.19 This represents an 8.6% CAGR over the last five years with an accelerated CAGR of 12.08% in the last three years. During the same period the company saw significant growth in net earnings with a CAGR over the last five years of 21.1%.20
Source: Target Corporation 2021 Annual Report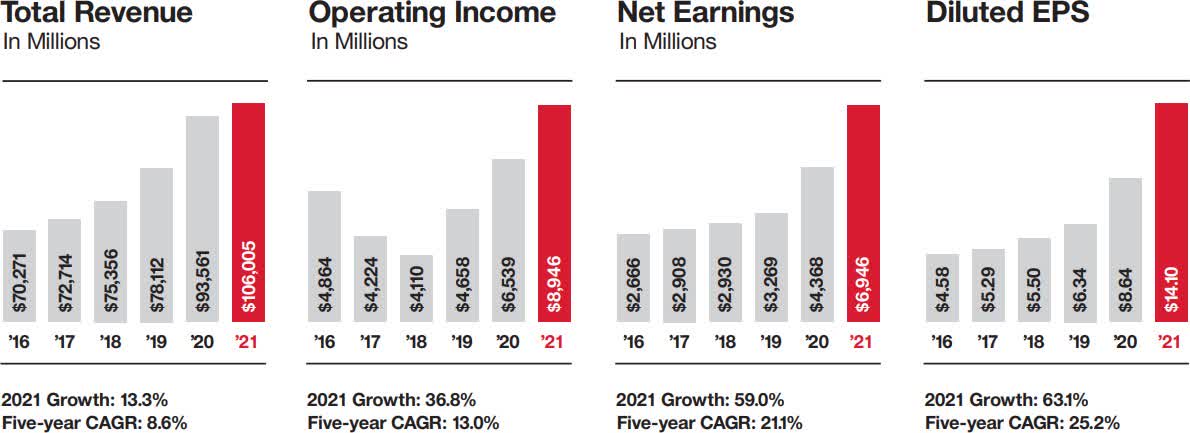
This growth is primarily driven by increases in comparable stores, new partnerships, increasing digital presence, new product and service offerings, the rollout of owned brands, and new store openings (all discussed above). These sources will continue to drive strong growth at Target. In addition to these drivers of growth, the company has significant untapped growth potential with Target Plus, same day delivery/sortation centers, Roundel, and internationally.
Target Plus. Target Plus is Target’s marketplace for third-party sellers and is in its infant stages. Target Plus works in conjunction with Target’s digital and online merchandise stores. Instead of the orders being fulfilled by physical Target stores as is done with the digital Target platform, Target Plus is completely fulfilled by third party sellers like other online marketplaces such as Amazon’s 3rd party marketplace. Target Plus invites third party sellers that widen the product offering (as opposed to cannibalizing it) and integrate their products into the Target digital store.
Currently, Target Plus operates on an invite-only basis to ensure quality control and that third-party sellers are offering products that would otherwise not be offered at Target both physically and digitally.21 This enables the company to widen its product offering and create incremental sales without having to expand its stores and fulfillment capabilities. The continued roll-out and expansion of Target Plus partners will continue to be an explosive growth opportunity for the company.
Same day delivery. Target’s rollout of same day delivery is proving to be a major advantage for the business. Target’s same day delivery is done digitally through Target’s website or mobile app and is fulfilled by Target stores and then delivered through Target’s subsidiary: Shipt. Shipt leverages the scale and network of its Shipt shoppers to deliver products to Target customers on the same day they are ordered. Beyond improving the customer experience and convenience of shopping, same day delivery is improving Target’s costs.
Same day delivery provides Target with 90% cost savings compared to shipping from an upstream warehouse.22 Additionally, it is driving the double-digit growth in digital sales at Target, and rivals the same day delivery capabilities of Amazon. Same day delivery is not available for all items and stores yet. The roll out of same day delivery across Target’s stores combined with the expansion of the purchasable items for same day delivery is expected to significantly contribute to the company’s online growth. Shipt is a membership service for $99/year and will provide Target with a growing and recurring revenue stream.
Roundel. Roundel was created in 2016 and it is an often-overlooked aspect of Target’s business. Roundel is Target Corporation’s in-house media company. The purpose of Roundel is to provide brands with personalized advertising material using insights derived from the vast array of customer data available to Target. Roundel is a significant driver of growth at Target and its impact is underrepresented.23 Roundel is a profitable source of growth for Target, and it reduces the company’s cost of sales.
This is most clear from the performance of Roundel in the month February 2022 for Black History Month. During the month, Roundel media promoted roughly 20 brands that led to an average of 40% increase in sales across those brands.24 This highlights Roundel’s ability to promote Target’s own brands and the brands of third parties. This is and will continue to be a strong source of profitable growth for the company.
Growth Potential. As of the most recent fiscal year (FY2021) the Target Corporation has 1,926 fully stores that are all located within the United States.25 While the company does have offices across the world, they do not sell merchandise and are instead focused on sourcing merchandise and other supply-oriented operations. The company is still underpenetrated in the US market especially in the most urban areas such as downtowns.
This is because Target traditionally operates medium to larger retail locations in the 50,000 to 169,999 sq. ft. range which are less viable in extremely urban areas.26 Target is currently opening stores with square footage of less than 50,000 to enter more urban areas.27 The company has less than half the number of stores in the United States as Walmart, 1/4th the number of stores as CVS, and 1/8th the number of stores as Dollar Tree. Expansion in the United States is still the most important avenue of growth for the company.28
Returning Capital to Shareholders
In addition to delivering strong operational performance, the Target Corporation has continued to return a major portion of its cash flow to shareholders in the form of dividends and share repurchases.
Dividends. Target began to distribute dividends to shareholders in 1967 and has delivered 50 consecutive years of annual cash dividend increases.29 The cash dividend has experienced huge growth while maintaining the company’s goal of having less than a 40% payout ratio. The quarterly dividend has increased from $.43 per share in 2013 to $.90 per share in 2022. That is over a 100% increase in quarterly cash dividends in less than ten years.30
The dividend is safe and has room to grow. The payout ratio for this year will likely be below 25% which not only provides ample room for the company to operate while maintaining its dividend but also leaves plenty of room for dividend growth as the 25% payout ratio is well below the company’s 40% target. The growth of the dividend in the past 7 years has been relatively modest with the exception of the most recent fiscal year (FY2021), in which the annual dividend increased from $2.72 per share to $3.6 per share.31
That is a 32% increase in just one year and is a result of Target’s consistent, predictable, and impressive operating performance.
Source: Target Corporation 2013-2021 Annual Reports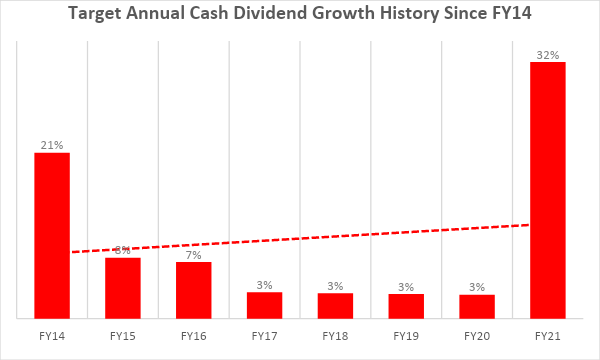
Share Repurchases. In addition to a consistent and growing dividend the Target Corporation has distributed significant portions of its free cash flow to its shareholders via its share repurchase program. By the end of the fourth quarter of fiscal year 2021 the company had repurchased $7.356 billion worth of shares for the year with a remaining $12.3 billion authorized by the Board of Directors.32 This is not a one-off and the company has repurchased millions of shares in the prior years.
Source: Target Corporation 2016-2021 Annual/Quarterly Reports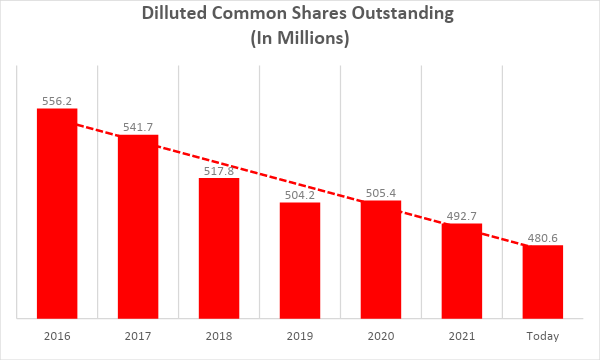
The Target Corporation has stated its commitment to returning capital to shareholders through share repurchases when it believes it is appropriate. The company has proven this as its fully diluted common stock outstanding has decreased from 556.2 million shares in 2016 to 480.6 shares in the most recent quarter representing a 13.6% decline in its common shares outstanding.33 This consistent and growing return of capital to shareholders from both share repurchases and cash dividends while continuing to maintain its growth profile is further evidence of the company’s outstanding quality.
Industry Overview and the State of Retail
Target operates solely in the United States and therefore the retail landscape will be discussed as it relates only to the United States. The company is one of the largest retailers in the United States and although it is often referred to as a consumer discretionary company, a significant portion of its revenue comes from merchandise typically associated with consumer staples. Retail has and always will be a very difficult industry to navigate, plagued by competition, low margins, the necessity for large supply chains, and a plethora of other issues. However, for businesses like Target that can navigate this difficult industry, the future is bright.
Retail sales in the United States have been rapidly increasing since the pandemic and currently sit near all- time highs. This is promising, especially given the supply and personnel constraints that have been at the forefront of the retail industry.
At the heart of retail is the consumer. Personal consumption in the United States has been remarkably strong since the Covid-19 pandemic but is beginning to show signs of weakening. Although off the high, real disposable income continues to be strong with unemployment near 50-year lows.
High inflation has created a new set of problems for retailers, and it makes forecasting demand harder, increases working capital requirements and increases cost pressures. Some cost increases can be passed on to consumers through higher prices, while others are being absorbed by companies in the form of decreased margins. While inflation is affecting all retailers, and Target hasn’t been spared from the wild fluctuations in consumer demand, we believe that larger companies are better positioned in a high inflation environment because they have more strategies available to them to mitigate rising prices.
Retailing is a difficult industry. Even the best retailer in the world will never achieve the level of profitability of a successful software company. However, even small differences in operating performance, when coupled with intelligent capital allocation and sustained over time, can lead to enormous differences in shareholder returns. We believe that Target is well positioned, well managed, and has delivered superior profitability within the US Retail industry. The company has intelligently allocated capital (the most recent accelerated share buyback program notwithstanding) and is squarely focused on the US market – another feature we like34.
The difficult environment of rising costs, whether they come from rising wages, discombobulated supply chains, or a weaker consumer will weaken those not prepared and strengthen retailers such as Target that are able to navigate these obstacles. Target’s industry leading employee compensation and benefits has allowed it to largely avoid experiencing issues around staffing. As of the most recent quarter the company reported that all its stores were fully staffed, and that staffing was not an issue.
Additionally, the company has experienced rising shipping and freight costs and some supply restraints but believes these are short term and will have minimal impact on the business. Target has weathered the short-term difficulties within the retail space well, especially compared to its competitors which will not only benefit the company now but will strengthen its position within the industry and allow it to continue to take market share.
Competition
Retail has and continues to be an extremely competitive industry with many players. Target’s diverse product offering opens itself to further competition from other market participants ranging from big box retailers, digital marketplaces, and more specialized/niche retailers. Nevertheless, Target has been consistent in its ability to grow its business while simultaneously returning significant amounts of capital to shareholders.
Target has managed to maintain its market leading position because of the work it has done to differentiate itself. This includes but is not limited to its affordability, diverse and curated assortment of brands including both third-party and in-house brands, differentiated shopping experience through modern and strategic store- -layouts, convenience through a variety of delivery options including same day delivery, size/scale, and the company’s ability to maintain its relevance especially with younger customers.
Although Target has been able to maintain and grow its market share in retail while staying committed to its brick-and-mortar strategy, retail is not a winner-takes-all industry. In fact, many of Target’s largest competitors like Amazon (AMZN), Walmart (WMT), and Costco (COST) have simultaneously been able to effectively grow their businesses while also differentiating themselves from the rest of retail.
Management and Board of Directors
Brian Cornell, CEO and chairman. Mr. Cornell joined Target as CEO and chairman of the board in 2014 and is the first ever Target CEO to be appointed from outside of the company. He has over thirty years of industry experience in public executive roles at companies such as Safeway, Michaels, Sam’s Club, and PepsiCo Americas Foods. In addition to his role as chairman and CEO at Target, he currently serves on the board of directors for Yum! Brands and was previously a director for The Home Depot and Polaris Industries. He also serves on several executive committees including the National Retail Federation. Mr. Cornell has a vast range of retail experience and has led Target’s digital and online initiatives, innovative delivery options, vast remodel, and expansion program, and led multiple acquisitions for the company including Shipt and Roundel. He holds 437,485 shares.
Michael Fiddelke, CFO. Mr. Fiddelke joined Target in 2004 as a financial analyst. Since then, he has stayed within the company and risen through the ranks occupying various roles in strategic planning, store operations, merchandising capabilities, and operations until reaching the role of CFO in 2019. Prior to joining Target Mr. Fiddelke worked at Deloitte Consulting, LLP after getting his MBA from the Kellogg School of Management at Northwestern University. He holds 36,600 shares.
John J. Mulligan, COO. Mr. Mulligan joined Target in 1996 as a financial analyst after earning a Master of Business Administration from the University of Minnesota. He has been with Target for 25 years occupying various roles within the company in departments such as capital finance, pay and benefits, and other related roles. Mr. Mulligan has held a number of other C-suite roles including CFO and even interim president and CEO in 2014. He also currently serves on the board of directors for the McDonald’s Corporation as well as Minnesota Children’s Hospitals and Clinics. He holds 157,333 shares.
David P. Abney, director. Mr. Abney was appointed to Target’s board of directors in September of 2021. Prior to Target he spent 46 years at United Parcel Service and served as the company’s CEO for four years from 2016 to 2020. In addition to serving on Target’s board of directors Mr. Abney serves on the board of directors for Northrop Grumman Corporation, Freeport-McMoRan, the Annie E. Casey foundation, the Georgia Historical Society, and the Delta State University Alumni Foundation. He holds 7,510 shares.
George S. Barrett, director. Mr. Barret has served as a member of Target’s board of directors since November of 2018. He has held a range of executive roles including CEO of Teva Pharmaceutical Industries Ltd North America and Cardinal Health, Inc. where he served as the Chairman and Chief Executive Officer. Mr. Barrett also serves on the board of directors for the Biopharmaceutical and manufacturing company Resilience. He holds 11,057 shares.
Donald R. Knauss, director. Mr. Knauss was appointed to Target’s board of directors in August of 2015. He has a range of public executive experience and served as the CEO of The Clorox Company from October 2006 to November 2014 and served as the company’s executive chairman from November 2014 to July 2015. Prior to joining Clorox, Mr. Knauss was the president and COO of Coca-Cola North America and held several marketing roles at Proctor and Gamble. He was also an officer in the United States Marine Corps and served on the board of directors for the Kellogg Company and the Clorox Company. He holds 27,662 shares.
Gail K. Boudreaux, director. Ms. Boudreaux has served as a member of Target’s board of directors since September of 2021. Ms. Boudreaux currently serves as the CEO of Anthem and has spent over thirty years in the healthcare industry and held executive roles at Blue Cross/Blue Shield of Illinois, Aetna, and served as the CEO of UnitedHealthcare from 2011 to 2014. In addition to currently serving as the CEO of Anthem, Ms. Boudreaux serves on the board of directors for the Central Indiana Corporate Partnership, Blue Cross Blue Shield, the Business Council, the Business Roundtable, the National Institute for Health Care Management, and the American Health Insurance Plans. She holds 32,890 shares.
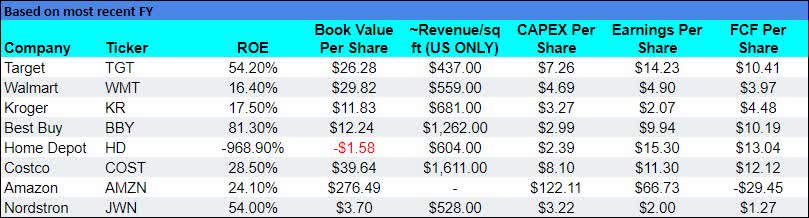
Source: Sentieo, Target Corporation 2021 Form 10-k, roic.ai. Source: Sentieo, Target , Walmart, Kroger, Best Buy, Home Depot, Costco, Amazon, Nordstrom 2021/2022 Form 10-k, roic.ai.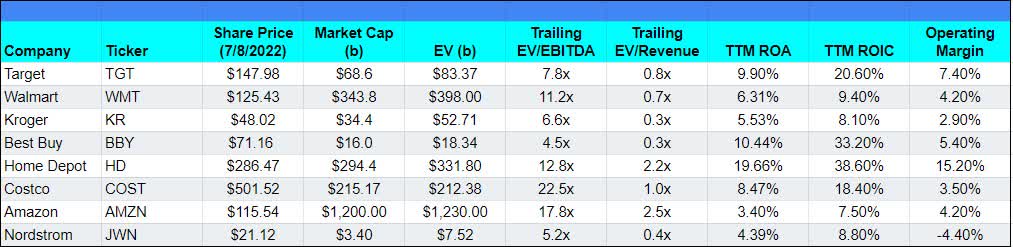
Our Portfolio
The top ten investments in our portfolio as of 8/1/2022, in order of position size, are presented on the following pages. All valuation metrics and returns are as of 8/1/2022 unless otherwise stated.
The table below gives additional insight into our portfolio exposure. We continue to be dramatically underexposed in technology, communication, financials, and utilities, while being overexposed in industrials, consumer cyclicals and real estate. These sector weightings are an outcome of where we currently see opportunities, and not a top-down decision based on macro predictions. We will happily own many technology companies if their valuations become more attractive.
|
Portfolio Statistics as of 8/1/202235 |
|||
|
Sector Allocations (Long Exposure, %) |
|||
|
S&P 500 Sector |
Portfolio |
S&P 500 |
Delta |
|
Consumer Cyclical |
25.92 |
10.74 |
15.18 |
|
Industrials |
22.57 |
8.22 |
14.35 |
|
Technology |
9.63 |
24.46 |
(14.83) |
|
Healthcare |
9.18 |
14.48 |
(5.30) |
|
Financial Services |
7.20 |
13.37 |
(6.17) |
|
Real Estate |
6.94 |
2.77 |
4.17 |
|
Consumer Defensive |
4.95 |
6.90 |
(1.95) |
|
Basic Materials |
4.90 |
2.47 |
2.43 |
|
Communication Services |
4.83 |
8.81 |
(3.98) |
|
Energy |
3.88 |
4.80 |
(0.92) |
|
Utilities |
– |
2.98 |
(2.98) |
|
Market Cap Allocations (%) |
|||
|
Large |
37.84 |
||
|
Mid |
49.74 |
||
|
Small |
12.42 |
||
|
Country Allocations (%) |
|||
|
United States |
94.45 |
||
|
Canada |
3.90 |
||
|
Denmark |
1.65 |
||
#1 – Northrop Grumman Corporation (NOC)

Based in Virginia, Northrop Grumman is one of the world’s largest defense contractors with annual revenue more than $30 billion. The company operates in a cozy oligopoly, that after decades of consolidation the US defense market is now controlled by five large companies: The Boeing Company (BA), General Dynamics Corporation (GD), Lockheed Martin Corporation (LMT), Northrop Grumman Corporation (NOC), and Raytheon Technologies Corporation (RTX).
Industry barriers to entry are immense, government procurement cycles are extremely long, and the consolidated industry structure reflects this. This industry structure has allowed Northrop to earn stable mid-teens returns on invested capital (ROIC) and grow earnings per share at a rate of over 13% per year in the past decade, despite a topline that has grown only in-line with inflation. Even after the recent run-up in the stock price, it trades at approximate 15x, next year’s earnings estimates, far below the S&P 500 index, despite being an above average company.
While nominally, there are five major defense contractors, the true industry concentration is even higher because not all companies compete in all possible business segments. General Dynamics’ division submarine division, Electric Boat, is the sole supplier of nuclear power submarines in the United States. Lockheed Martin is the sole supplier of the F-35 and F-22. Northrop was the sole bidder on the contract to develop the next generation of intercontinental ballistic missiles; and so on.
The company’s revenue growth over the past decade has been mediocre but even that has led to impressive shareholder returns that have far outpaced the S&P500. What’s more, we believe that revenue growth may accelerate in the next few years. A lot of ink spilled every year about the “massive” U.S. defense budget36 that critics claim is “out of control”37.
Given this, you might be surprised to hear that U.S. defense spending as a share of GDP is at the lowest level in recorded history,38 at a mere 3.8%. In other words, U.S. military spending could double and not be out of line with historical norms. While we are not calling for a new Cold War, given the global instability we are witnessing, it is not unreasonable to expect defense spending to grow faster than GDP over the next decade.
Select Financial Metrics – Trailing Twelve Months
#2 – Marriott International, Inc. (MAR)

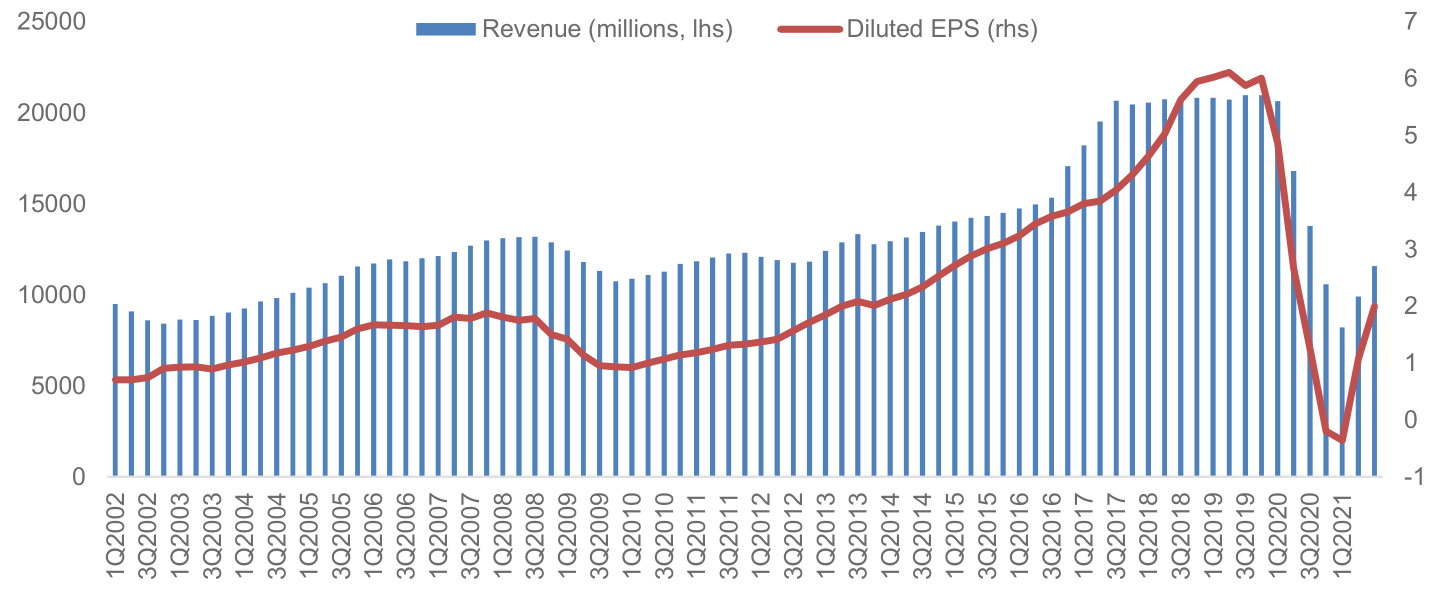
Marriott is the world’s largest hotel company followed closely by Hilton (HLT) and Intercontinental Hotels Group plc (IHG). The company owns a portfolio of brands from the low end (Courtyard, SpringHill Suites, Aloft), through the mid-tier (Marriott, Sheraton, Westin, Renaissance Hotels), to the luxury high end (JW Marriot, Ritz-Carlton, St. Regis). In total the company had 7,642 properties with over 1.4 million rooms as of the end of Q1 2021.39
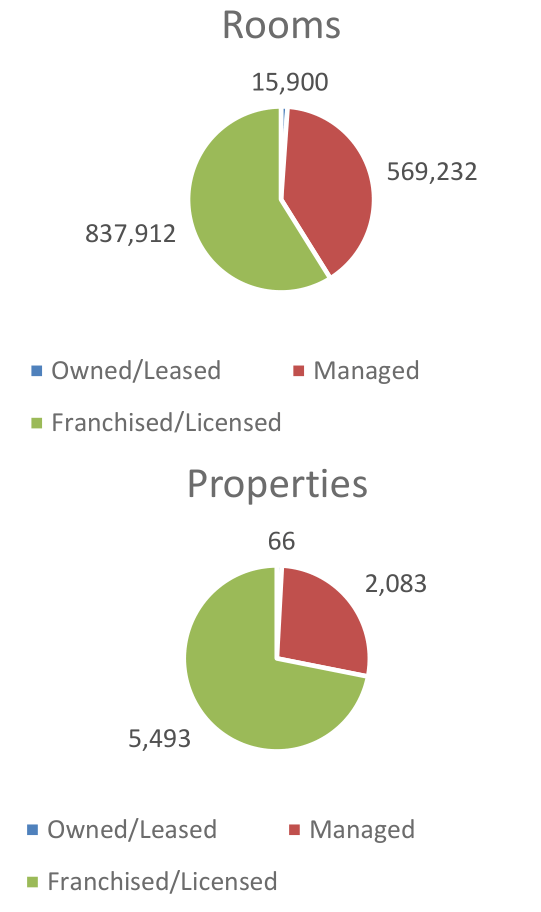
The majority (85%) of Marriott’s revenue comes from hotels in the United States, with the rest almost evenly split between Asia Pacific and Europe. Like it’s smaller peer, Hilton, the company today is almost exclusively a manager and franchisor of hotels, not a hotel owner. The company owns 66 hotels, manages 2,083 and franchises 5,493. Like all franchise-based businesses Marriott requires very little capital to grow as it utilizes the investment capital of its hotel-owners/partners to expand.
Marriott currently faces a difficult operating environment due to the Covid-19 pandemic and uncertainty about the future of business travel. However, the company is an excellent operator with a somewhat leveraged capital structure (the company acquired Starwood Properties in late 2016) – if pent-up demand for travel materializes post-Covid, as we expect it will, the company will quickly go from losing money to raking in profits.
Select Financial Metrics – Trailing Twelve Months
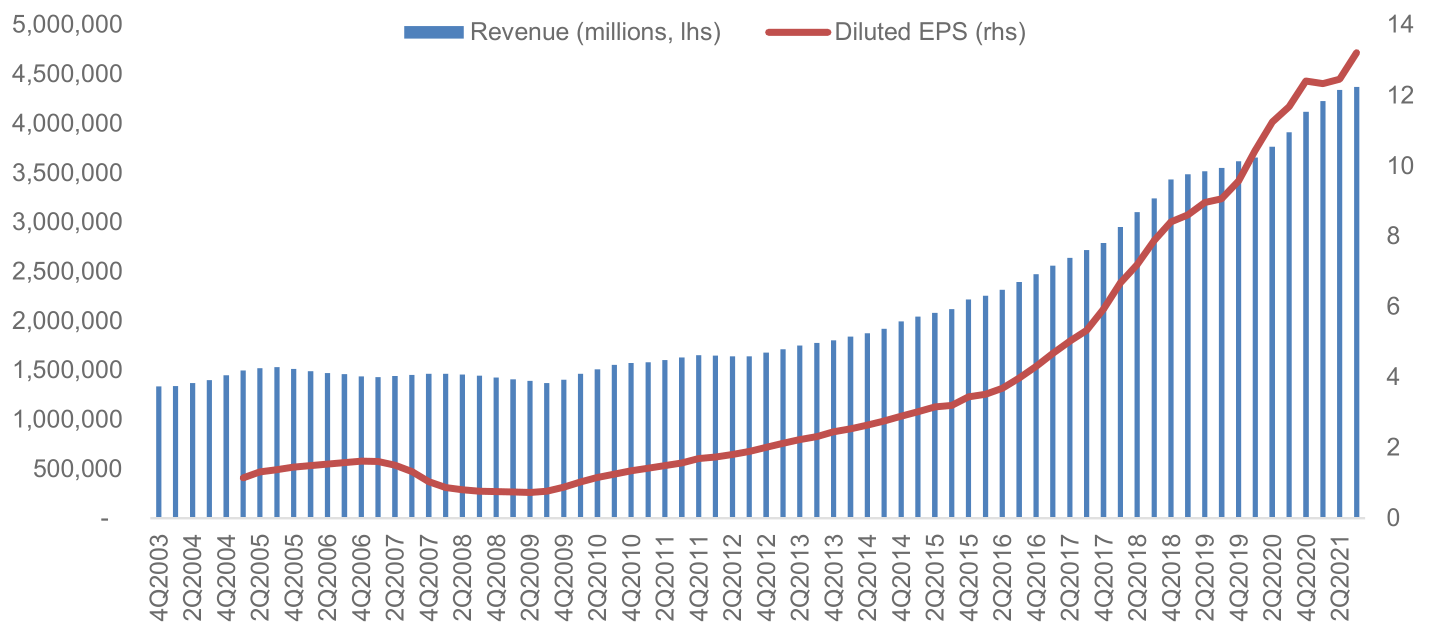
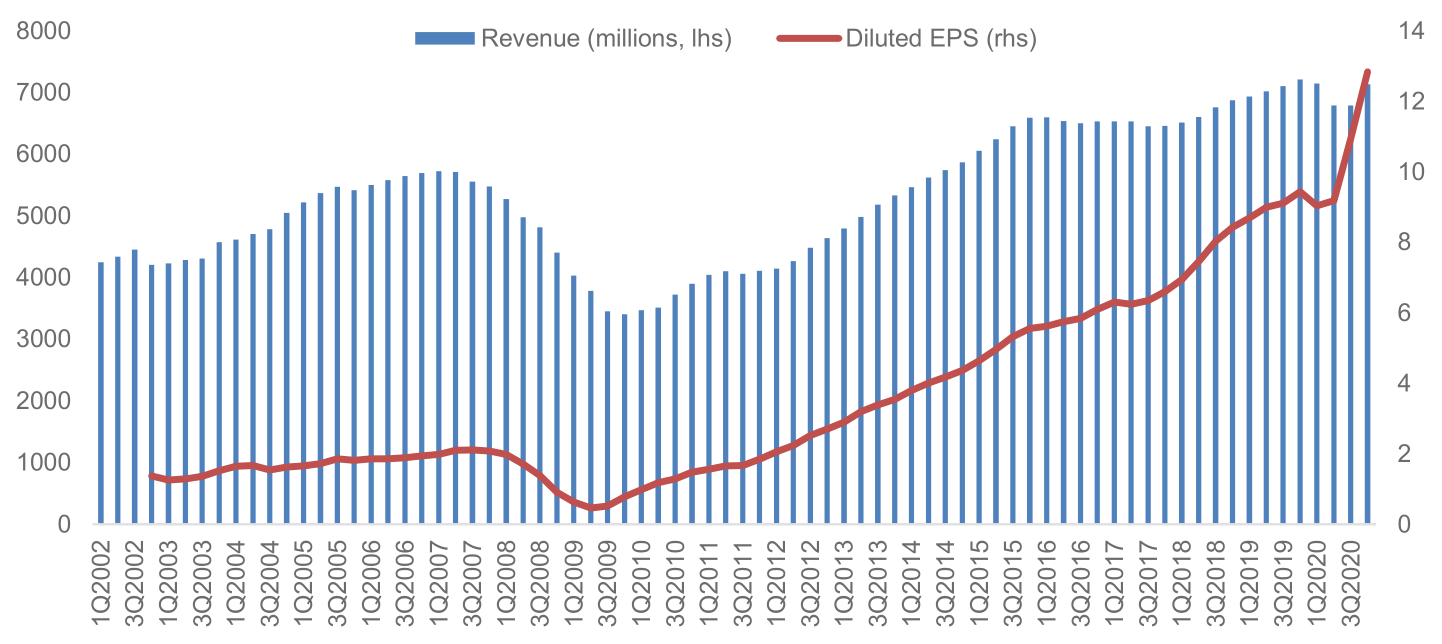
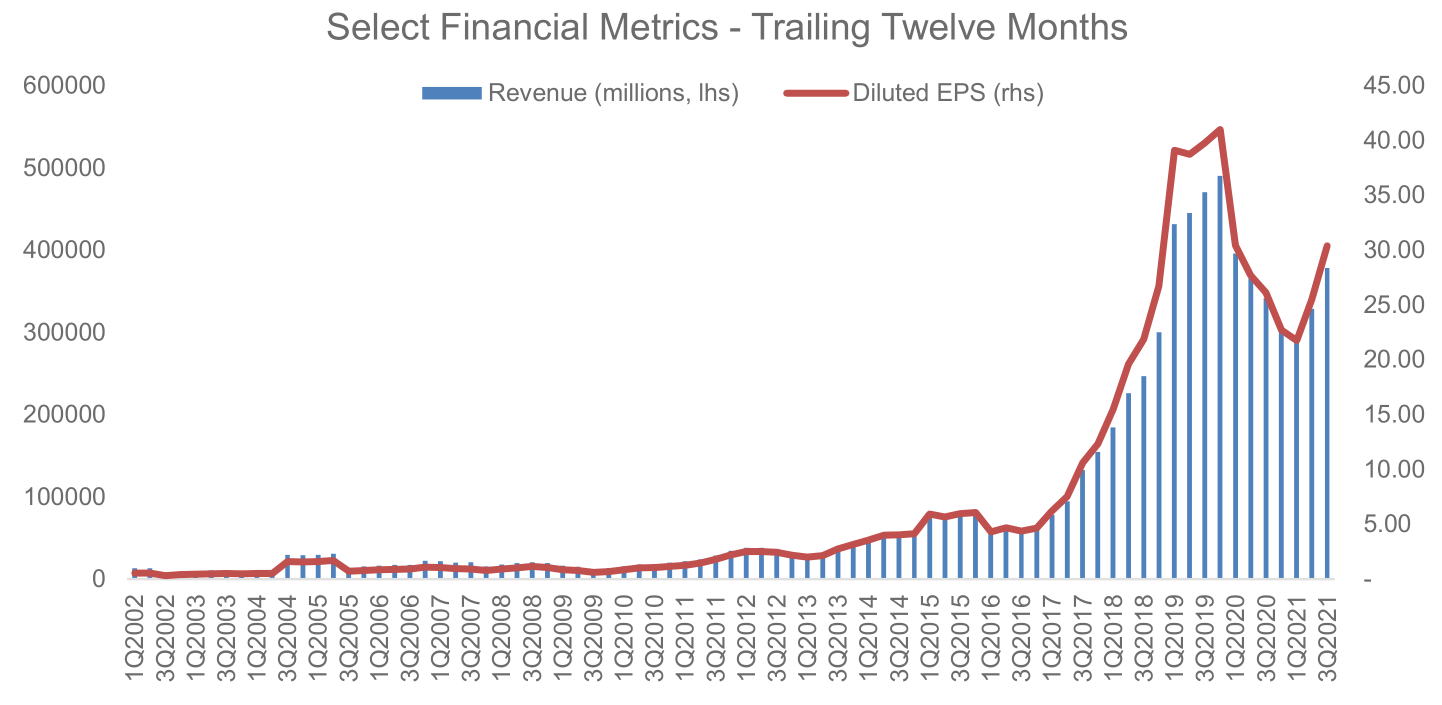
#3 – Domino’s Pizza, Inc. (DPZ)
Domino’s Pizza is the world’s largest franchisor of pizza restaurants with over 13,800 locations in 85 countries. As for any restaurant operator, the key metric to consider for Domino’s Pizza is same-store-sales (SSS) growth. Growing same-store-sales are ultimately how a restaurant business increases earnings from its existing assets. The company continues to impress in this criterion with SSS having grown in the U.S. for 40 consecutive quarters, and an astounding 109 straight quarters internationally.
Two-thirds of the company’s stores are currently abroad, and the international segment remains the company’s largest growth opportunity, as the penetration of convenient fast food remains lower abroad than in the United States. Pizza is a product with exceptionally high gross margins, one that “translates” well across different cultures, and one that literally “travels well”, not losing much of its appeal when delivered in a cardboard box.
The rise of 3rd party delivery platforms such as Uber Eats, Doordash and Grubhub is challenging the pizza category as it has expanded the number of choices consumers have for convenient takeout. However, the economics of food delivery remain challenging for most restaurants and platforms alike40, while pizza delivery continues to be highly profitable. Regardless of how the “delivery wars” currently playing out end, Domino’s financial results show little impact of this increased competition, and the company continues to deliver exceptional financial performance.
Domino’s Pizza stock is not optically cheap based on forward earnings, however, the company has routinely reported earnings growth of over 20% in almost all quarters since 2009. Given the company’s high growth rate, international growth opportunities, and capital light business model, which allows for returns on invested capital of over 40%, we are happy to continue to hold the shares.
Select Financial Metrics – Trailing Twelve Months
#4 – Asbury Automotive Group, Inc. (ABG)

Asbury Automotive Group is one of the largest automotive retailers in the United States. It operates 90 dealerships consisting of 112 franchises and 25 collision repair centers. The company’s stores offer new and used vehicles, parts, and service, as well as finance and insurance (F&I) products. Franchise agreements controlled by automotive manufactures and state laws create an environment of tightly controlled market entry and restricted competition.
The dealership industry is highly fragmented with 93.5% of dealers having only between 1-5 locations according to data from 202041. In fact, dealers with over 50 locations account for only 0.1% of the industry – a testament to the huge opportunity for consolidation that lies ahead. Industry dynamics, including the rising complexity of automobiles and the need for omnichannel distribution are favoring better capitalized and larger dealer groups.
We believe Asbury Automotive Group has several distinct advantages, particularly its highly profitable parts and service business, its overexposure to the luxury vehicle business, which carriers the best margins, and its Clicklane omnichannel strategy. Asbury’s management has also been acting in the best interests of its shareholders by allocating capital towards acquiring dealerships to aggressively expand its business, and occasionally repurchasing stock when attractive acquisitions targets could not be found.
ABG is not a fast-growing SaaS business, but when paying a valuation of ¼ of the overall stock market, one does not need to make heroic assumptions about the future to enjoy strong returns as shareholders. We believe that over the next several years, Asbury will continue to acquire dealerships, occasionally buyback stock and invest to improve its digital shopping experience. We wrote about Asbury in detail in our August 2021 Investor Letter.42
Select Financial Metrics – Trailing Twelve Months
#5 – Texas Pacific Land Trust (TPL)

Long time readers will know that we rarely invest in commodity businesses. However, there are periods in the market where commodity-based businesses outperform the broad indexes by a wide margin. Therefore, to have balance in the portfolio, we have long searched for a competitively advantaged company in the commodity space. We believe that Texas Pacific Land Trust (TPL), meets that criterion. Formed out of assets of formerly bankrupt railroads, TPL controls the largest acreage of land in the Permian basin – the center of the US shale oil industry.
The company has two main sources of income: 1) royalties from oil & gas extracted on its properties – essentially a free call option on future oil prices and production; and 2) a water business which develops water resources and sells services to the fracking industry. We see TPL as an effective way to diversify the portfolio into a commodity exposed business that has a history of smart capital allocation and low risk of financial distress during periods of low oil prices. The company has no debt, and $281 million in cash.43
The company uses most of its cash flows to pay dividends and repurchase shares.
Select Financial Metrics – Trailing Twelve Months
#6 – Public Storage (PSA)
Public Storage is the largest self-storage REITs. The company acquires and develops self-storage facilities and currently owns or manages over 2,7000 properties and is extremely well diversified across the United States. The company was founded in 1972 and IPOed in 1980. We have long admired the company’s ability to grow and maintain high occupancy. We purchased our position after a recent pullback in the company’s share price. We also hold a small position in Extra Space Storage Inc. (EXR), for the same reasons.
The business is largely recession proof with predictable revenues that grow every year due to rent increases, operating efficiencies and new sites. Typical reasons for using a self-storage facility include deaths, divorces, downsizing as well as birth and marriages – things that happen all the time, regardless of the economy. The company can continue to grow through consolidation as the self-storage market is still dominated by mom-n-pop operators. By acquiring underperforming assets and improving operations the company creates incremental shareholder value.
In densely populated areas land is scare and land values are high. High value locations are limited in major metropolitan areas and cannot easily be acquired by an incumbent. This is a simple and seemingly boring business that takes decades to build and that cannot be disrupted by tech companies.
We wrote about Public Storage in detail in our March 2022 letter.44
Select Financial Metrics – Trailing Twelve Months
#7 – Progressive Corp. (PGR)
![]()
Progressive is a leading U.S. auto insurer that has pioneered telemetrics as a source of differentiation in its underwriting and itoperates through a direct (non-agency) sales model. We believe that the company’s sales model, which is still the minority model in the industry confers on the company a durable process-based cost advantage that has allowed the company to deliver industry leading combined ratios (a standard measure of profitability in the insurance industry).
The company has plenty of room to grow and take market share from players such as State Farm, Farmers and Nationwide. The cost advantages conferred by the direct sales model are unstoppable, and the scale advantages the company has in advertising and other customer acquisition costs furthers its strong competitive position. We believe the industry structure is going to evolve towards a duopoly with Progressive and GEICO as the two main players.
While we do not believe telemetrics itself confers any competitive advantage as it is a technology that has been copied by other players, Progressive is a very innovative company, and it has evolved from being an insurer for the highest risk drivers to one that now targets the general population. GEICO on the other hand began its life as an insurer for the best drivers and has now evolved in the direction of insuring everyone. On the surface the companies are similar, but their different pasts continue to shape their corporate cultures and are evident in subtle ways in their decision-making processes arounds expense management and claims processing.
The company has a very conservative investment portfolio with over $44 billion in fixed income securities.45 75% of their portfolio is held in securities with a duration of under five years, which means that an increase in interest rates will benefit the company as the portfolio will relatively rapidly reprice into higher yielding securities.
Select Financial Metrics – Trailing Twelve Months
#8 – Murphy USA Inc. (MUSA)

We have held a position in Murphy USA for several months and have recently increased it, making it a top ten name in the portfolio. The company is a gas station operator and was spun-off from Murphy Oil in 2013. Murphy USA operates 1,700 stores primarily in Walmart parking lot locations and owns the underlying real-estate.
What makes Murphy USA unique from other convenience store operators such as Casey’s General Stores, Inc. (CASY) and Alimentation Couche-Tard Inc. (ATD.TO)46, is the company’s focus on high volumes of gasoline sales47 and a minimal amount of convenience store sales. Fuel sales account for close to 60% of gross profit, a big difference from a typical convenience store, where fuel is close to 25% of profits. Most locations have a very small store of approximately 500sqft only.
In December 2020, Murphy USA purchased QuickChek, a chain of 157 stations in the New Jersey and New York with an average store size of 5,500 sqft. which will strengthen the company’s food offering and expand the company’s focus into larger store formats.
The industry Murphy USA operates is attractive because of rising fixed costs of operations which are squeezing smaller and less well capitalized players leading to industry consolidation. While the advent of electric cars may mean less gasoline sales in the future, we continue to believe that the transition to electric vehicles will take a lot longer than most analysts believe.
The company has been using all available cashflow to repurchase shares, a value creating activity, as we view the shares as undervalued.
Select Financial Metrics – Trailing Twelve Months
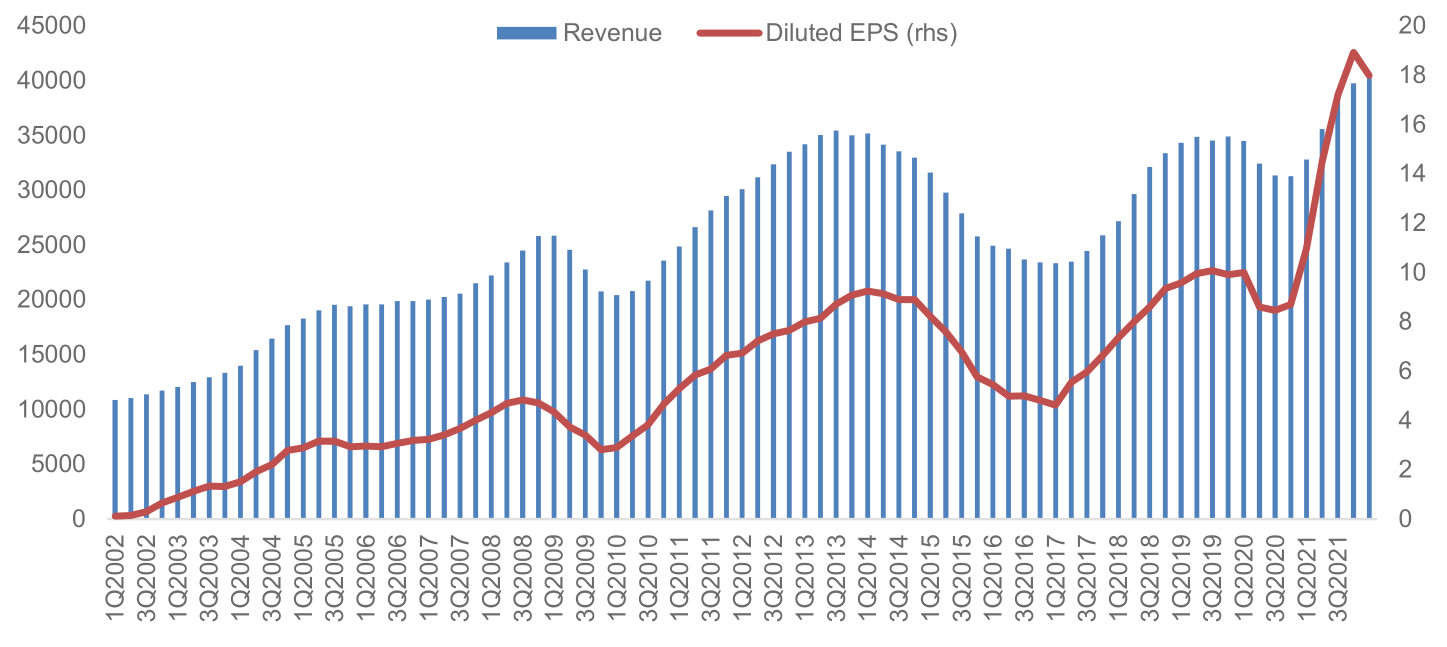
#9 – Colliers International Group Inc. (CIGI)

Colliers International Group is a commercial real estate brokerage and investment management company founded by Jay S. Hennick in 1976 in Toronto, Canada. From humble beginnings the company has grown, primarily through acquisitions, to become one of the five largest commercial real estate brokerages in the world (the others being CBRE, Jones Lang LaSalle, Cushman & Wakefield, and Savills). The company today offers a full range of services and reports in the following segments:
Outsourcing & Advisory (45% of revenue; this includes Engineering & Design services, Valuation services and Property Management), Capital Markets (25% of revenue), Commercial Real Estate Leasing (24% of revenue), and Investment Management (6% of revenue). The company believes that about half of its revenue is recurring in nature. The Investment Management segment deserves special attention, as it is the result of an acquisition of the real estate investment management company Harrison Street in 2018.
While the segment contributes the smallest part of revenues, it has a very high margin, contributing over 17% of the company’s EBITDA.
Colliers has historically grown by acquisition, and we expect it to continue to do so. The real estate services market is highly fragmented outside of North America presenting ample opportunities for Colliers to continue its growth strategy. The company has been a good steward of shareholder capital and spun out FirstService Residential (FSV) in 2014 to maximize the value of that business. This spinout accounts for the drop in revenue in 2014 seen in the chart below.
Select Financial Metrics – Trailing Twelve Months
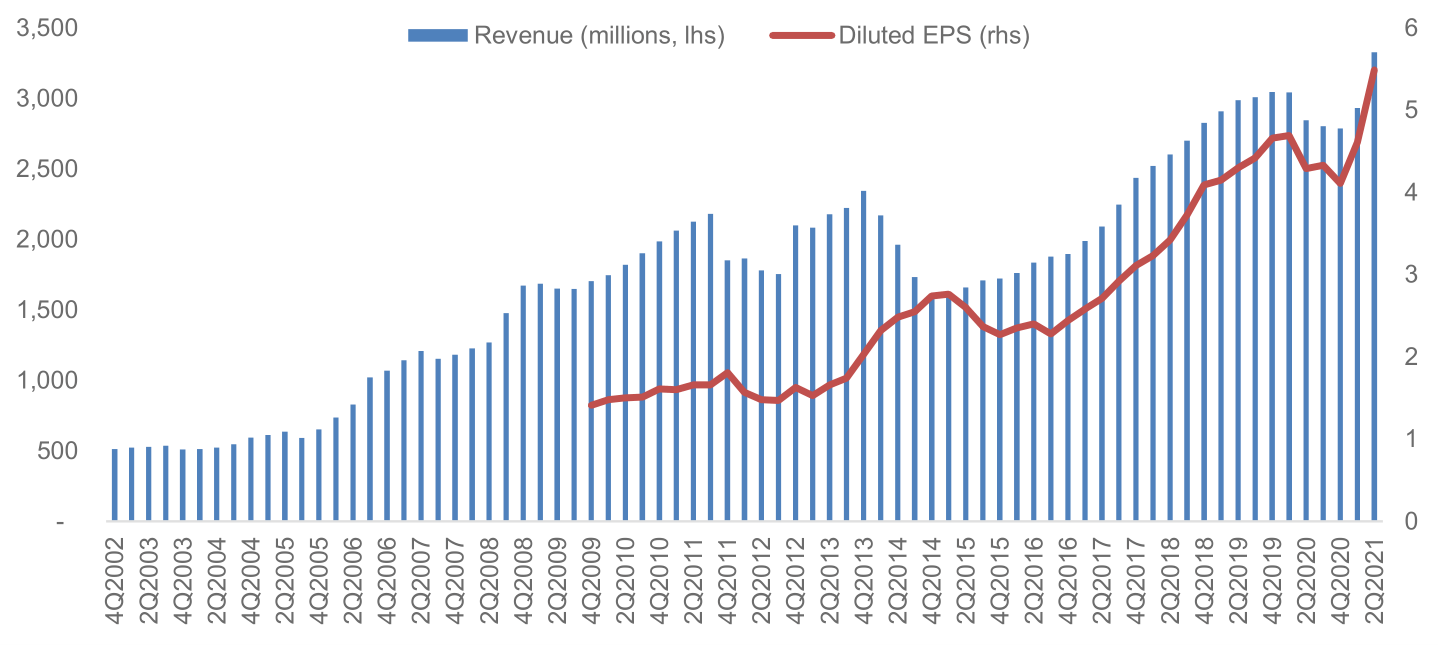
#10 – Deere & Company (DE)
Deere & Company manufactures machines and equipment, which help the agriculture and construction industries. The company’s production and precision agriculture segment manufacture global equipment and technology solutions for production-scale growers of large grains, small grains, cotton, and sugar. The small agriculture and turf segment develops equipment for dairy and livestock producers, crop producers, and turf and utility customers. Finally, the construction and forestry segment make a range of machines for the earthmoving, forestry, and roadbuilding production systems.
The company is the leader in farming and agricultural equipment and competes with the likes of CNH Industrial and Kubota Corporation. Deere has generated returns on equity of over 20%, and in many years well above 30%, for more than two decades. How is this possible when the company’s end markets are so cyclical?
Deere sells an “ongoing relationship” to farmers, as every piece of equipment purchased leads to a steady supply of future parts and related services. The true source of Deere’s competitive advantage is the company’s dealership network, and its ability and willingness to finance the purchase of its equipment for farmers. The unique nature of its distribution system and the credit decisions that are made at the distributor level have created a structure that has allowed the company to keep credit losses to astonishingly low levels.
Select Financial Metrics – Trailing Twelve Months
As always, I look forward to hearing from you and answering any questions you might have. Thank you for your continued interest and support.
Lukasz Tomicki, Portfolio Manager LRT Capital
Appendix I: Attributions and Holdings as of 7/1/2022
|
LRT Economic Moat |
Portfolio Statistics |
||||||
|
Top Holdings (%) |
Sector Allocations (Long Exposure) |
||||||
|
Northrop Grumman Corporation (NOC) |
5.51 |
Sector |
Portfolio |
S&P 500 |
Delta |
||
|
Marriott International, Inc. (MAR) |
4.76 |
Consumer Cyclical |
26.14 |
11.84 |
14.30 |
||
|
Domino’s Pizza, Inc. (DPZ) |
4.73 |
Industrials |
23.96 |
8.15 |
15.81 |
||
|
Progressive Corp. (PGR) |
4.15 |
Technology |
9.93 |
25.59 |
(15.66) |
||
|
Asbury Automotive Group, Inc. (ABG) |
4.12 |
Healthcare |
8.83 |
13.70 |
(4.87) |
||
|
Texas Pacific Land Trust (TPL) |
3.92 |
Financial Services |
7.85 |
13.19 |
(5.34) |
||
|
Murphy USA Inc. (MUSA) |
3.64 |
Real Estate |
6.47 |
2.72 |
3.75 |
||
|
Public Storage (PSA) |
3.44 |
Consumer Defensive |
4.77 |
6.50 |
(1.73) |
||
|
Booking Holdings Inc. (BKNG) |
3.26 |
Basic Materials |
4.66 |
2.34 |
2.32 |
||
|
AO Smith Corp. (AOS) |
3.17 |
Energy |
3.92 |
3.87 |
0.05 |
||
|
Top Holdings Total |
40.70 |
Communication Services |
3.47 |
9.36 |
(5.89) |
||
|
Utilities |
– |
2.74 |
(2.74) |
||||
|
Hedges (%) |
Market Cap Allocations (%) |
||||||
|
Vanguard Mid-Cap ETF (VO) |
-12.91 |
Large |
35.61 |
||||
|
Vanguard Small-Cap ETF (VB) |
-11.84 |
Mid |
51.7 |
||||
|
iShares Core S&P Mid-Cap (IJH) |
-11.58 |
Small |
12.7 |
||||
|
SPDR S&P MidCap 400 ETF (MDY) |
-11.58 |
||||||
|
iShares Russell 2000 (IWM) |
-11.17 |
||||||
|
iShares Core S&P Small-Cap (IJR) |
-11.02 |
||||||
|
Return Attribution (%) |
Country Allocations (%) |
||||||
|
Long Equity |
14.12 |
United States |
94.86 |
||||
|
Hedges |
-7.29 |
Canada |
3.76 |
||||
|
Unlevered Gross Return |
6.83 |
Denmark |
1.38 |
||||
|
Leveraged Gross Return |
13.66 |
||||||
|
Net Return |
13.58 |
||||||
Source: Morningstar, Sentieo.
Net returns are net of a hypothetical 1% annual management fee (charged quarterly) and 20% annual performance fee. Individual account results may vary due to the timing of investments and fee structure. Please consult your statements for exact results.
Please see the end of this letter for additional disclosures.
Appendix II: Investment Philosophy
Over the past 36 months, we saw a large increase in the number of LRT Capital partners (the term we use to describe our clients). With so many newcomers, it is important that we write about our investment philosophy again.
Here are the key points:
-
- Exceptional stock returns come from exceptional business returns on a per-share basis.
- We seek to invest in high-quality companies, i.e., those possessing sustainable competitive advantages (moats), the ability to grow and reinvest capital over time, and management that excels at capital allocation.
- We only purchase companies whose shares trade at a discount to our assessment of their intrinsic value.
- It is futile to predict short-term market movements. We seek to hold our investments for as long as possible.
- The financial markets are dominated by short-term traders who see stocks as casino chips. This occasionally allows us to purchase shares in great companies at large discounts to their true worth.
- If we are right about the trajectory of the businesses we invest in, over time, we will be right on the trajectory of their stock prices.
We view stock market volatility as a source of opportunity. Volatility allows us to profit by acquiring shares in superb businesses at attractive prices. The more that markets (the “other” participants) are irrational, the more likely we are to reach our ambitious performance objectives.
In the long run, stocks are the best investment asset class, but our experience has taught us that our investment process will not generate linear returns. In some years, our portfolio will outperform, and in others, it will generate a below average return. This is a certainty that we must accept. We are long-term investors and we do not try to dance in and out of the market.
In summary, our investment strategy can be summed up in three steps:
- Only seek out high-quality companies.
- Do not overpay.
- Do nothing – patience and discipline are the keystones to success.
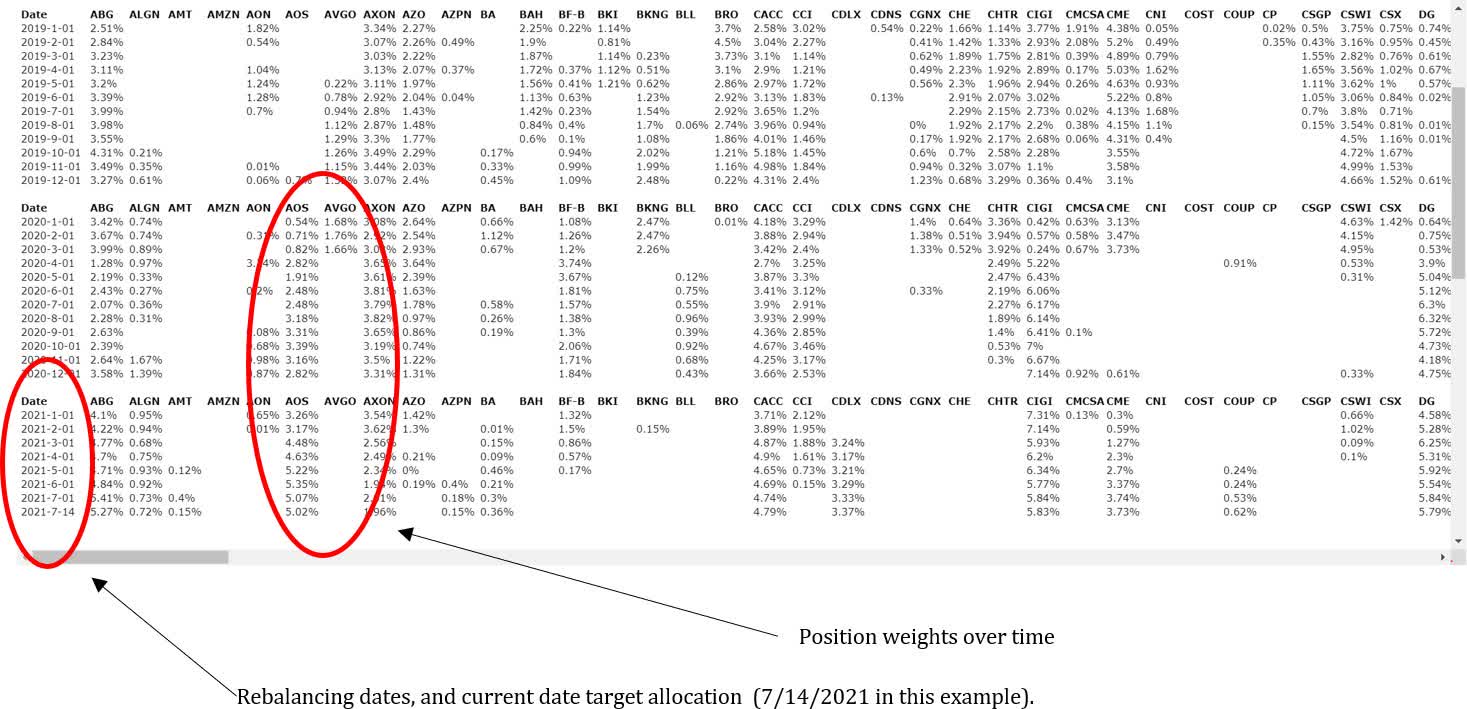
Appendix III: Portfolio Construction Software Overview
LRT separates the discretionary and qualitative process of selecting the equity holdings from the portfolio construction process which is systematic and quantitative.
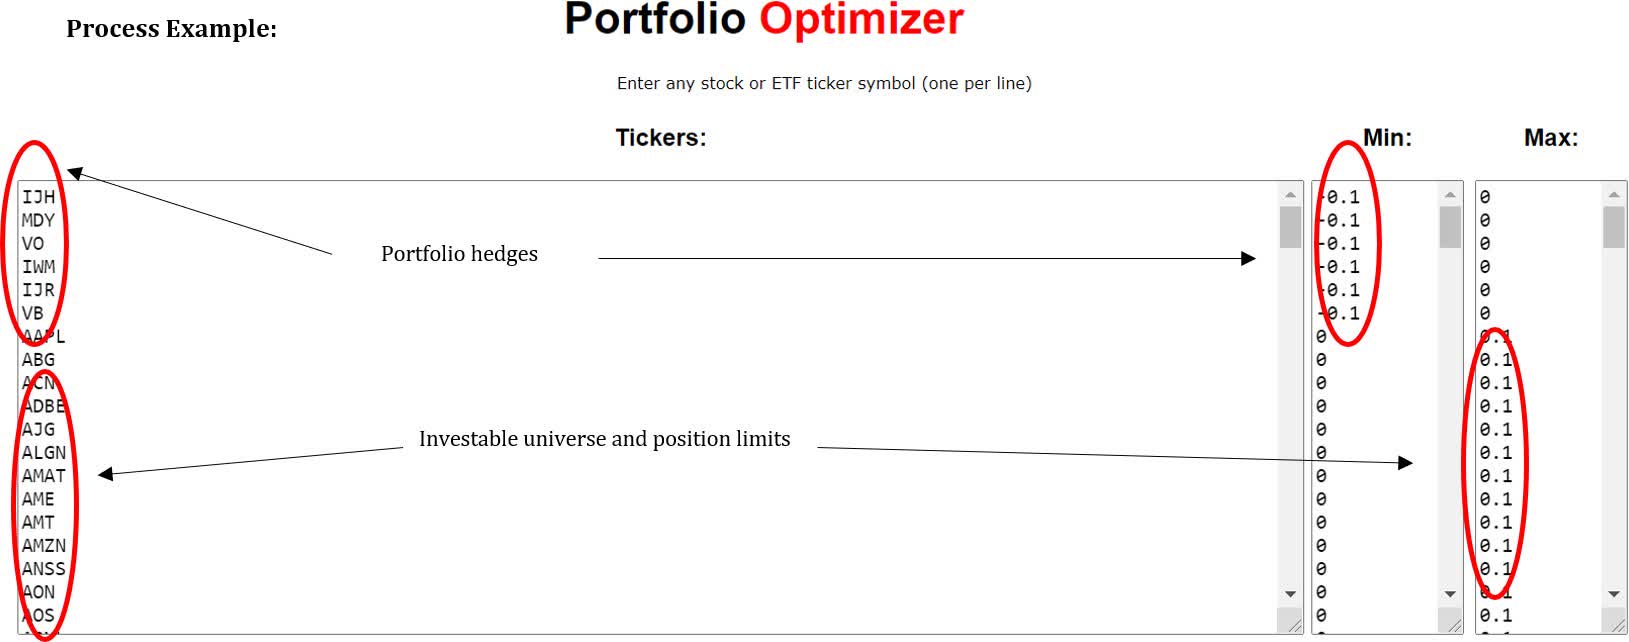
Our quantitative process considers each position’s contribution to portfolio volatility, contribution of idiosyncratic vs. systematic risk and portfolio factor (size, value, quality, momentum, vol, etc.) exposures.
The system outputs target portfolio weighs for each position. We trade mechanically to rebalance the portfolio each month to the targeted exposures. This eliminates emotions, human biases, and overconfidence risk.
Example system output:
Footnotes
1 “The committee is united in our determination to get inflation back down to 2 percent, and I think we’re going to continue to do what we need to do until we are convinced that inflation is well on its way back down to 2 percent — and we are a long way away from that.” Fed’s Kashkari says officials are ‘a long way’ from backing off inflation fight.
2 TGT FY2022 10-K.
3 Ibid.
4 Ibid.
5 Ibid.
6 Ibid.
7 Ibid.
8 TGT FY2022 10-K.
9 Ibid.
10 Ibid.
11 Ibid.
12 Ibid.
13 Ibid.
14 Ibid.
15 TGT FY2022 10-K.
16 TGT 2022 Financial Community Meeting.
17 Ibid.
18 Ibid.
19 TGT FY2022 10-K.
20 Ibid.
21 TGT 2022 Financial Community Meeting
22 TGT 2022 Financial Community Meeting.
23 TGT 2022 Financial Community Meeting
24 Ibid.
25 TGT FY2022 10-K.
26 Ibid.
27 Ibid.
28 WMT, CVS, DLTR FY2022 10-K.
29 NASDAQ.com
30 Ibid.
31 NASDAQ.com
32 TGT FY2022 10-K.
33 TGT FY2017 and FY2022 10-K
34 To see the folly of international “diworsification” look no further than Walmart and its misadventures in China, Brazil and Germany.
35 Source: Morningstar, Sentieo.
36 It’s Time to Rein in Inflated Military Budgets, It’s Time to Rein in Inflated Military Budgets 37 U.S. Military Spending is Out of Control, https://www.bloomberg.com/opinion/articles/2021-12-27/pentagon-budget-military- spending-is-getting-out-of-hand
39 Source: Marriott, 10-K/A, 02-Apr-21
40 DoorDash lost $312 million in Q4, 2020. Source: DoorDash, 8-K Earnings, Update, 25-Feb-21
41 https://www.nada.org/WorkArea/DownloadAsset.aspx?id=21474861098
42 https://www.lrtcapital.com/wp-content/uploads/2021/09/2021-08-August-Investor-Update.pdf
43 Source: TPL, Investor Presentation March 2021, 02-Mar-21
44 https://www.lrtcapital.com/wp-content/uploads/2022/04/2022-03-March-Investor-Update.pdf
45 As of September 30th, 2021. Source: PGR 10-Q FY21 Q3.
46 The owners of the Circle K brand.
47 The average Murphy USA store sells close to 3 million gallons of fuel per year, 75% more than the industry average.
Editor’s Note: The summary bullets for this article were chosen by Seeking Alpha editors.
Be the first to comment