

kynny/iStock via Getty Images
Introduction
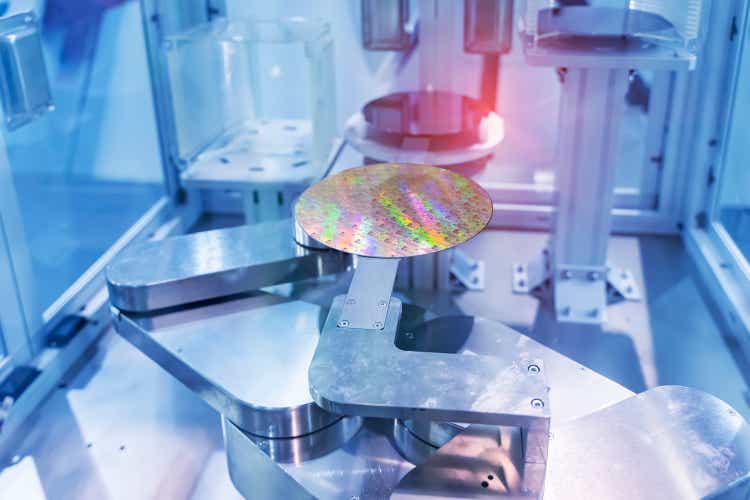
In this article, I analyze Lam Research (NASDAQ:LRCX), Applied Materials (AMAT) and Tokyo Electron (OTCPK:TOELY) ( herein referred to as “TEL”). They’re among the top five semiconductor equipment suppliers. The compete in a subset of “front-end” equipment that I call “processing equipment” such as deposition or etch, as opposed to inspection/metrology or “process control” equipment from KLA (KLAC) or “back end” equipment from bonding or test companies.
LRCX, AMAT, and TEL compete against each other in plasma etching and thin film deposition segments. Total revenues in each segment represented 20% of the $100 billion equipment market in 2021, according to our report “Global Semiconductor Equipment: Markets, Market Shares, Market Forecasts.”
Assuming the stock market reaches a bottom in the next six months, investors need to position their portfolio for 2023, and hopefully they will gain insight from this article.
The Vagaries of The Stock Market
There are several inconsistencies in the way semiconductor equipment stocks are traded:
- Companies are seldom considered as competitors and adversaries and shares are bought and sold as a sector. Good news for one company should be considered bad news for a competitor but instead rise and fall in tandem.
- I’ve written extensively about Applied Materials and its loss of market share against competitors because it doesn’t have “best of breed” equipment is not addressed by analysts. Thus as competitors, the loss of share by AMAT should be considered a positive for Lam Research and Tokyo Electron. However, they are not. Just today, at the time of this writing, LRCX is down 6.02% and AMAT is down 5.69%.
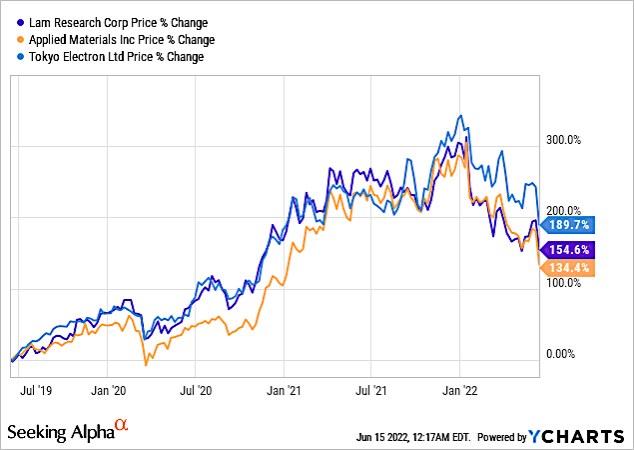
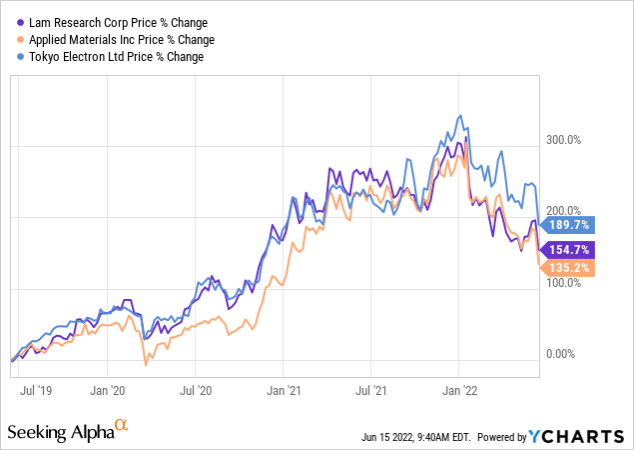
Chart 1 illustrates my point. In the three-year period, the percent change in share price for the three companies is surprisingly similar and separated by less than 40% with share profiles nearly identical.
YCharts
Chart 1
Indeed, the current environment affects all stocks, so macroeconomic and geopolitical factors prevalent today plays a big role. But share performance in Chart 1 is remarkably similar when these three companies compete strongly against each other.
For example, market share of LRCX, which I will show later, dropped strongly in the past few years because of its high revenue exposure to NAND memory yet its revenue losses are not reflected in Chart 1. Likewise, AMAT’s share has also dropped compared to TEL, but not according to Chart 1.
Strong Dependence on Chip Type
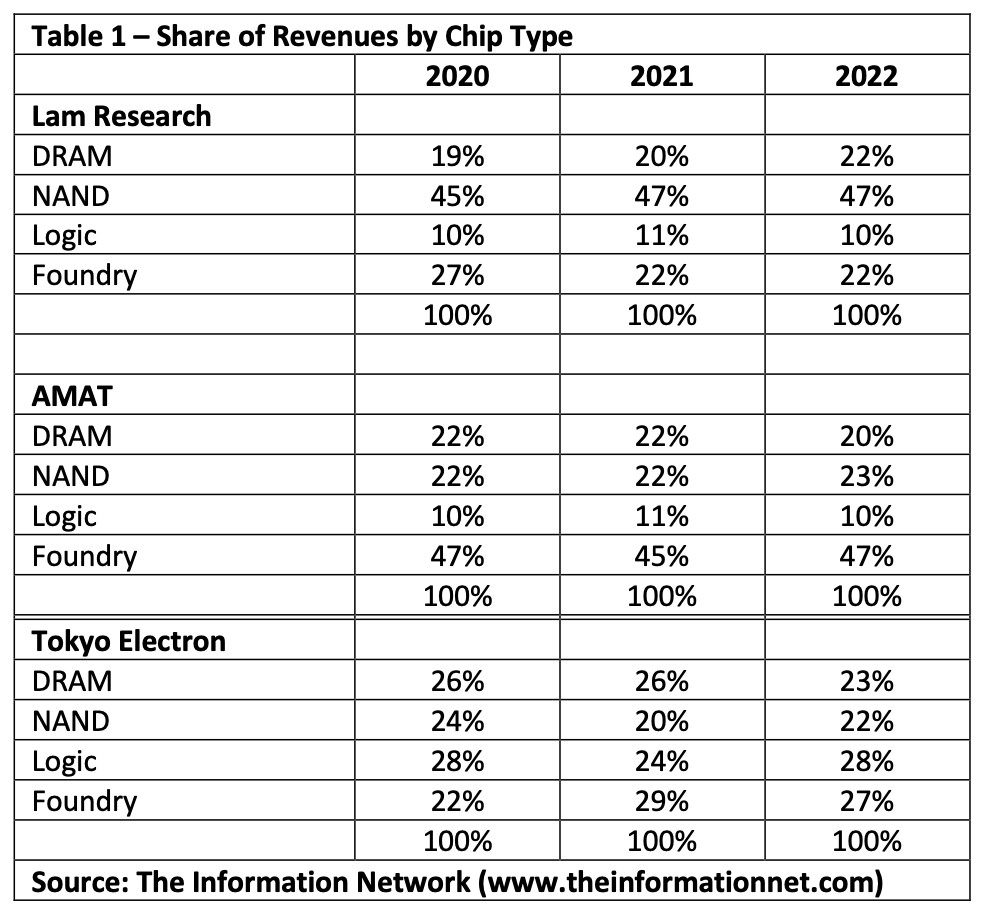
Table 1 shows the percentage of company revenues by chip type. Lam has its greatest exposure to NAND memory at 47% of revenues, AMAT its greatest exposure to Foundry at 45% of revenues, and TEL evenly divided.
The Information Network
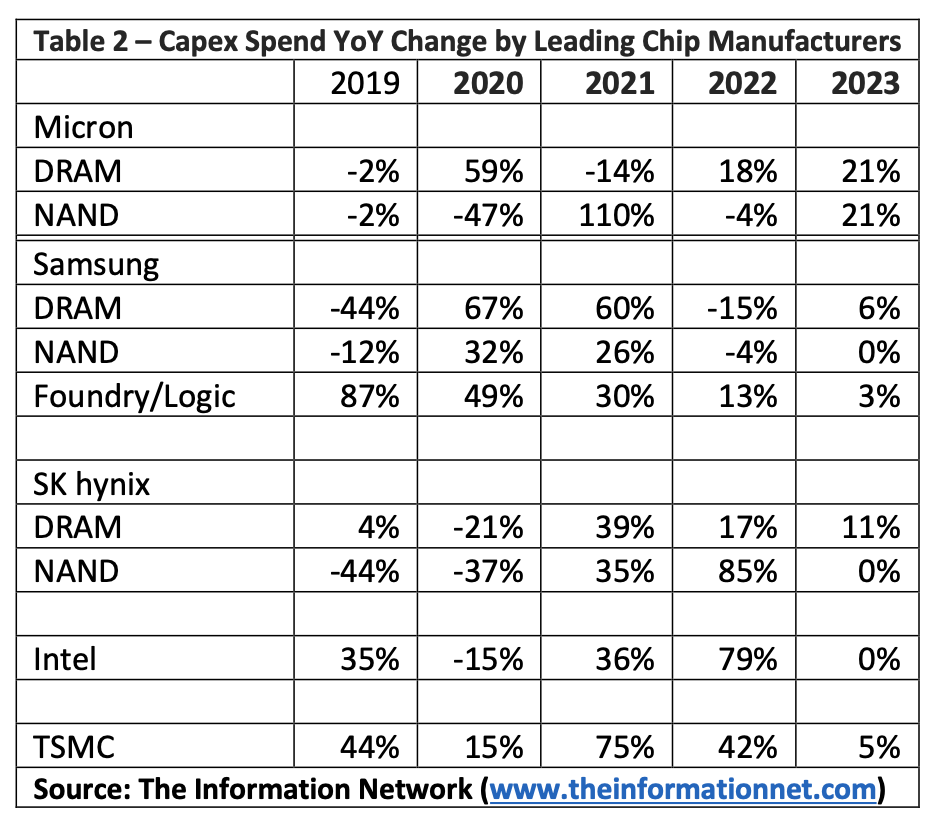
What does that mean for 2022 and 2023 revenues? Table 2 shows capex spend YoY change by leading semiconductor companies from 2019 through 2023. Capex is a combination of building structure (fabs) and equipment in an approximate 50:50 ratio.
The Information Network
The top three memory companies, Micron (MU), Samsung Electronics (OTC:SSNLF) and SK Hynix (OTC:HXSCL) have a planned YoY capex spend between -4% and +75% for NAND and -15% and +18% for DRAM for 2022.
Intel (INTC) (logic/foundry) plans a capex increase of 79% in 2022 followed by an increase of 0% in 2023. This strong growth in 2022 is due to new foundries capable of 7nm and smaller nodes.
Samsung’s foundry business plans a capex increase of 13% in 2022 followed by an increase of just 3% in 2023.
TSMC (TSM) (foundry) has a planned capex spend of 42% in 2022 followed by 50% in 2023. This is due to a large number of fabs in the works.
These data metrics are critical. If a customer is cutting back on capex spend, meaning it cuts back on equipment purchases, the equipment supplier is impacted.
Thus I see problems for Applied Materials in 2023 because TSMC and Intel won’t increase spending on equipment compared to what was spent in 2022.
Investor Takeaway
In this article, I chose AMAT, LRCX, and TEL. They are the top three “processing equipment” suppliers. In other words, they make tools such as etch or deposition that are used in the more than 500 steps to make a semiconductor device. They compete against each other in these equipment segments.
There are two other equipment companies in the top five:
KLA (KLAC) is not considered a processing equipment company but a “process control” company. It does have a small percentage of its business in etch and deposition, however.
ASML (ASML) is also considered a processing equipment company, but their major technology is lithography, which are not made by the other companies and hence don’t compete with them. It does have a small percentage of its business in process control, however.
As one can see from the above analysis, there are a plethora of factors that affect revenues of the companies. All these factors are summed up in Chart 2, which shows market shares for AMAT, LRCX, and TEL.
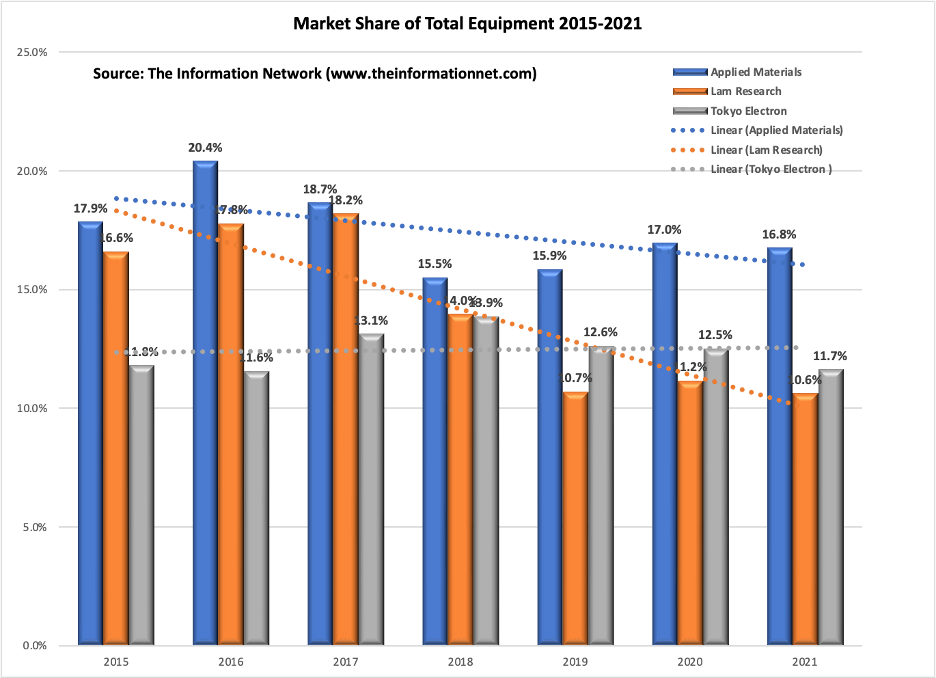
The Information Network
Chart 2
AMAT and LRCX shares have dropped between 2015 and 2021 as shown in the dotted trendiness, while TEL rose.
The strong drop in LRCX is because of its large exposure to NAND, as I said above, due to the crash of the memory market over the past few years and judicious capex spend by memory companies.
TEL’s share increased slightly over the seven-year period. This is due to the fact that its revenues are evenly distributed by memory, foundry, and logic, as shown above in Table 1. Thus, when there’s a slowdown or oversupply in one semiconductor segment, share loss will be mitigated but high exposure in the others, unlike what has happened with LRCX and memory.
I wrote in a June 25, 2023 Seeking Alpha article entitled “Applied Materials: Tracking A Likely Semiconductor Equipment Meltdown In 2023” that the large number of fabs built in 2020 – 2022 associated equipment purchases that grew 44.7% YoY in 2021 will result in an oversupply of logic/foundry semiconductors and a significant drop equipment purchases.
Looking to 2023, based on capex spend, TSMC’s anticipated drop to 5% YoY change and AMAT’s 45% exposure will be a negative for the company. Intel is also reducing capex spend in 2023. LRCX will fare better as memory capex spend recovers.
Financial Metrics
The complexity of analyzing the semiconductor is a daunting task for investors. As a result, they need to rely on sell-side analysts. The result is that, as shown below in Chart 3 and discussed above, stocks are traded as a sector and there is no differentiation.
YCharts
Chart 3
Seeking Alpha’s Quant Ratings and Rankings are more helpful, but fall short because they don’t include all stocks. For example, in Chart 4 we see that in Quant Rankings, TEL being a Japanese company and trading as an ADR is not ranked. Yet it’s revenues are ranked third among all semiconductor equipment companies.
Focusing on LRCX and AMAT, even though its performance is better, as detailed above, LRCX is ranked below AMAT.
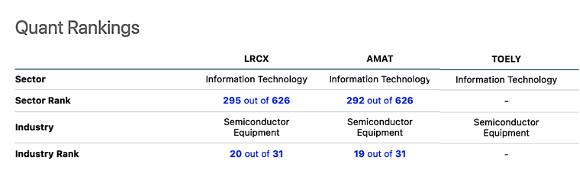
Seeking Alpha
Chart 4
Chart 5 shows the same thing for Quant Factor Grades. LRCX has better momentum than AMAT but worse valuation.
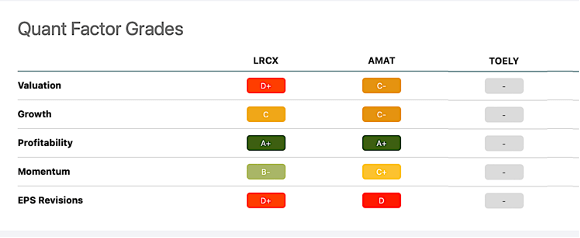
Seeking Alpha
Chart 5
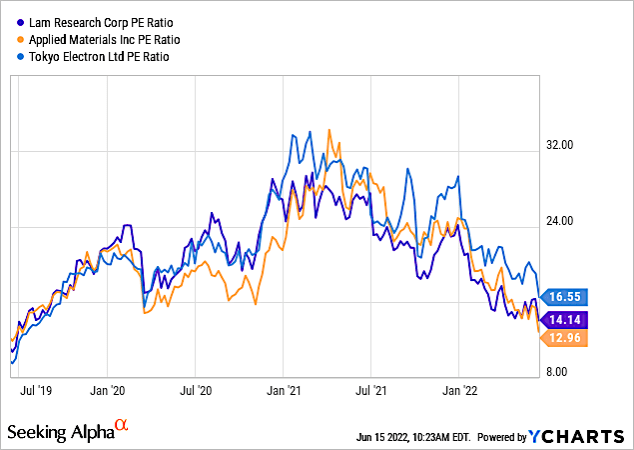
Indeed, Chart 6 shows that AMAT has a PE ratio of 12.96, but only just below LRCX at 14.14.
YCharts
Chart 6
Over a seven-year period, TEL is the only company exhibiting positive trendlines. For 2023:
- Lam was impacted by a downturn in the memory market, which has recovered and won’t be impacted by an oversupply of foundry/logic chips in 2023. A resumption in memory spend will be a positive of LRCX in 2023.
- AMAT with 47% exposure to foundry will be negatively impacted in 2023.
- TOELY, with more than a 50% exposure to foundry and logic will be negatively impacted in 2023.
Table 3 shows fab plans for 3D NAND, benefiting LRCX.
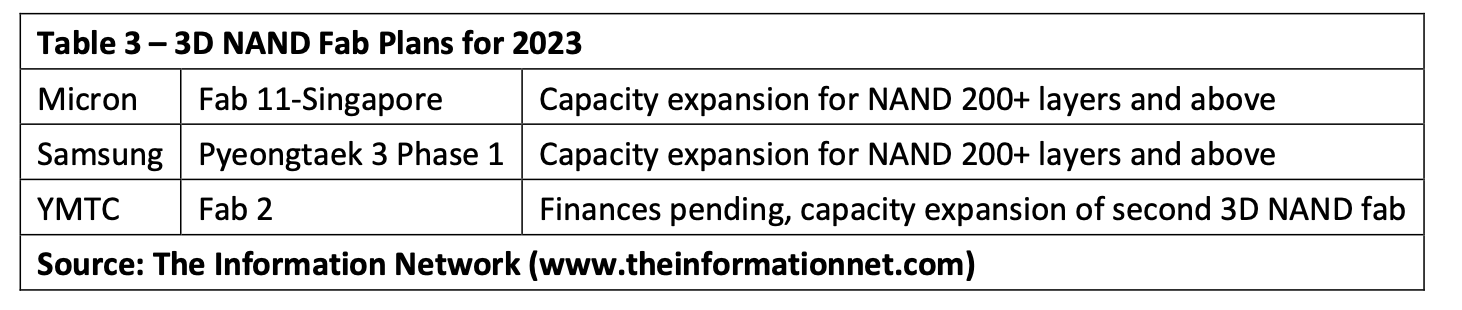
The Information Network
I recommend LRCX but not AMAT and TOELY, based on a confluence of metrics, primarily on my forecast for 2023 that foundry spend will be weak following two strong years of growth resulting in chip oversupply. Memory will be stronger and not impacted by oversupply as memory companies expand 3D NAND to 200+ layer.
Be the first to comment