

Mariia Skvortsova
Louisiana-Pacific (NYSE:LPX) is set to continue to bring in respectable cash-flow on the back of persistent strength in its Siding business while increasing stability in its earnings as the company’s strategy shifts away from commodity-based OSB. However, large downward revisions to OSB price guidance leave earnings in a rough place relative to previous quarters. With an additional layer of uncertainty being added by the housing market and overall macro-scene, investors should wait and see if the future earnings picture becomes more clear over the next few months.
My method of analysis rests in looking at the past two earnings calls of companies and seeing what changed vs. what stayed the same. I’ll then talk about what those similarities and differences mean for the stock going forward as well as how it plays into my valuation of the company through a DCF/3-Statement Model.
What Stayed the Same from Q1 to Q2
Continued Siding Strength
In the Q1, the Siding segment hit a record $330 million in sales. This reflected 17% YoY growth- the compounded effect of 12% pricing and 4% volume growth. Even despite hefty raw material inflation and rising freight costs, the business unit delivered strong EBITDA margins. Further capacity projects were also touched upon- with their Houlton facility beginning SmartSide production in March of this year, the Sagola mill conversion being on schedule for a Q1 2023 start-up, and further capacity plans to be announced in the future. It is clear that despite the recent upside the company’s financials have experienced from the volatile OSB segment, Siding is Louisiana-Pacific’s bread and butter and the segment they really want to focus on long term.
Similar themes arose in the Q2 call. Siding revenue grew 24% YoY to reach another quarterly record of $356 million. This consisted of 12% price coupled with 10% volume growth from last year. There was also a price increase implemented July 1st with the impact of these raises to be reflected in Q3 results. Sales volume of 448 million square feet was also a record for the company, with the ramp up of Houlton and an increase in operating efficiency being the drivers of the results. Especially with all of the other noise in the Q2 call, Siding performance was a bright spot and will continue to be the foundation of the company’s business.
To further illustrate the strides the Siding segment has taken, see the two slides below coming from each quarter’s earnings presentation.
Q1:
Q1 Earnings Presentation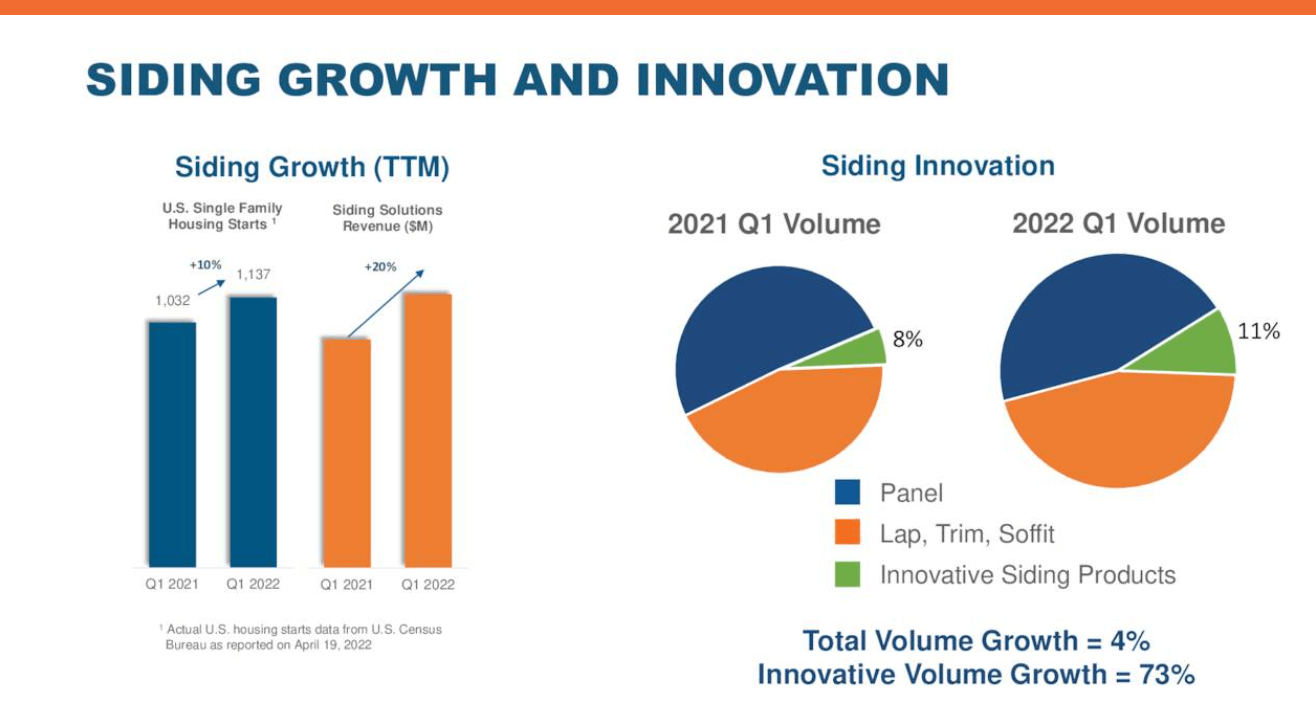
Q2:
Q2 Earnings Presentation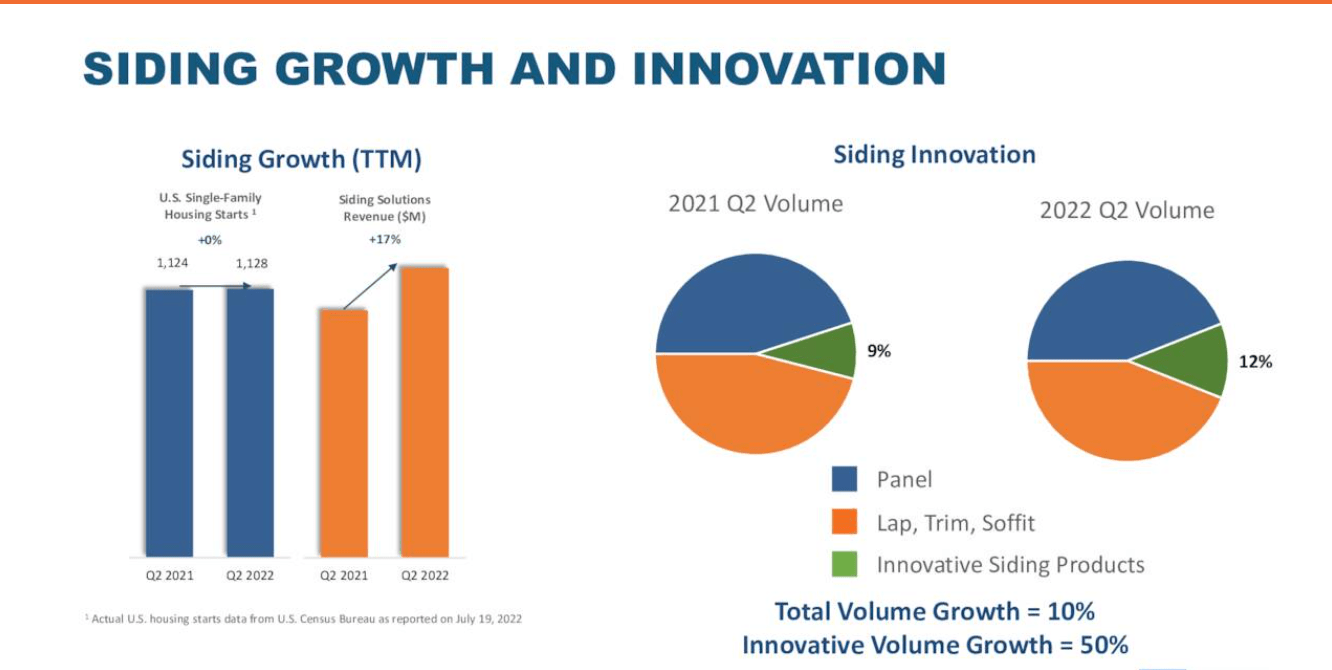
Two things to note when looking at these figures. The first is how revenue growth in each quarter outpaces U.S. single-family housing starts. What really jumps out is Q2 where starts were flat YoY while Siding still posted sizable growth. This is a trend that management really focuses on- investors often hold the narrative that revenues come and go with swings in housing starts. While there is still some correlation, leadership wants to emphasize that just because starts go down, this doesn’t necessarily mean revenue and earnings will have an equal downward reaction. Specifically, only ~40% of the Siding volume goes into single-family new construction. I think this point has held even greater importance in recent months as investors’ worries have increased about new housing starts numbers and the way they’re trending heading into 2023.
Another trend emphasized by leadership in these slides is the growth of the Innovative Siding Products portion of the Siding unit- the fastest growing segment of the portfolio. As called out in the slides, Q1 volume growth for this product group was 73% YoY while Q2 growth was 50%. This includes products such as Corners, ExpertFinish, Prefinished Siding and BuilderSeries. Some of these products tailor more to the repair and remodel market rather than housing starts and are accompanied by higher selling prices and better margins. It is also because of some of these innovative products that management stated that following a normalization in raw material prices, margins can not only be expected to return to historical levels, but also may end up being higher.
Talks of volatile OSB prices may overshadow Siding in future calls because there can be such a large YoY impact in revenue and earnings stemming from that segment, but investors should feel some sense of comfort in the Siding portfolio’s recent performance. Current and future capacity expansion projects are largely centered around Siding rather than OSB – a clear indicator that Siding will be the driving force in the long-term for the company as it tries to shift away from commodity-based OSB.
Importance of Structural Solutions
Structural Solutions is a portion of Louisiana-Pacific’s OSB segment that is not as closely tied to commodity OSB due to its specialized nature. Generally, these products have margins that are more resilient than their commodity-based counterpart which can be beneficial during downtimes in the OSB market. In Q1, management said Structural Solutions made up 55% of OSB sales, up 8 percentage points from the previous year. Similarly, the Q2 call revealed Structural Solutions volume comprised 53% of volume, 7 percentage points higher than last year. This will continue to be a focus on future earnings calls as the company tries to move away from commodity-based OSB.
To illustrate why so much effort is being placed on the Structural Solutions segment, we can turn directly to financial impacts outlined in the Q2 call. Overall, OSB prices were down 24% YoY, and when we break it down further, commodity-based OSB was down 32% while Structural Solutions was down 16%. In short, Structural Solution’s margin resiliency moderated the substantial negative impact from spiraling commodity prices. Hence the line of thought goes that if the company increases the percent of OSB sales attributed to Structural Solutions, earnings will be less fixated to commodity OSB. This is a positive because as we see with this most recent earnings call, OSB can swing drastically downwards and severely impact profits. More stable earnings, even though they might be lower in the near-term without as much benefit from volatile commodity OSB, is certainly preferred to what Louisiana-Pacific just experienced. This stability will eventually lead to greater internal forecast accuracy and thus be reflected in better guidance given to investors.
What Changed from Q1 to Q2
OSB Pricing
On a related note, there was a monumental shift in OSB pricing that the company realized from Q1 to Q2. In the first call, the leadership stated OSB prices climbed sharply, ending nearly double what they started the beginning of the year at. This also represented a staggering YoY change in prices as can be seen below. $130 million of the $151 million EBITDA increase is attributed to OSB pricing- or ~85%.
Q1 Earnings Presentation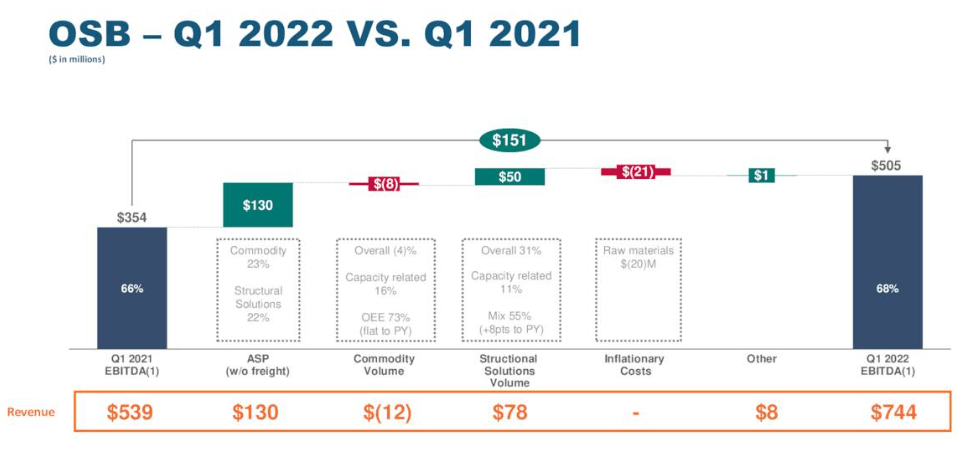
Throughout Q2, the company saw a reversal of fortune as OSB prices dropped off steeply. Additionally, prices dropped 24% on a YoY basis. An opposite reaction of even greater magnitude than Q1 can be seen in the Q2 EBITDA walk below. A $195 million drop YoY is really telling to how commodity OSB can make or break Louisiana-Pacific’s earnings.
Q2 Earnings Presentation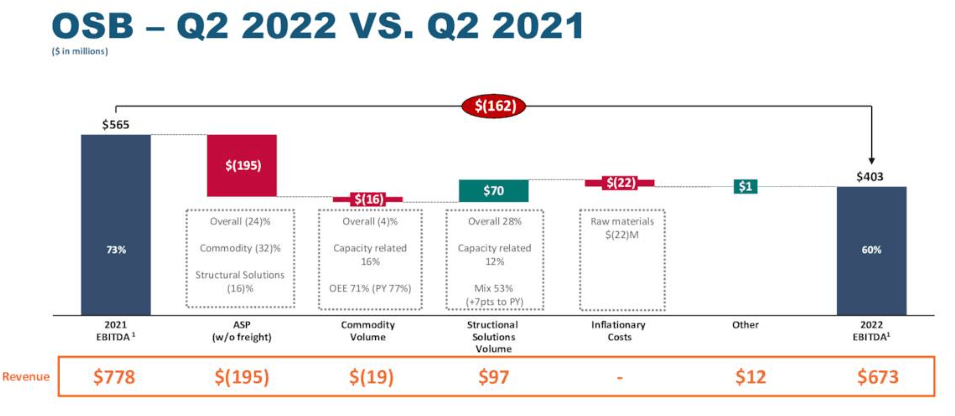
These wild swings in commodity prices are uncontrollable by the company, which is why the previous point on Structural Solutions is emphasized so frequently by management. Speeding up the adoption and increasing efforts towards Structural Solutions is something that is in the company’s control and can help mitigate future impacts from decreases in commodity pricing.
Unfortunately, the OSB price story doesn’t end there. If prices were to stay at the level they were before the Q2 call, OSB revenue would be an alarming 40% lower in Q3 sequentially. Upon this poor guidance, the stock fell 8% during the day after making a decent run up in the month leading up to the call, and it has plunged further over the last weeks as both macro and housing related concerns mount. Here lies the byproduct of having a segment that is so tied to a volatile commodity such as OSB. Company records have been set over the last few earnings calls, but as can be seen in the most recent one, significant pricing decline can completely change outlook for the year by a wide margin. The company constantly harked on efforts to make Structural Solutions the future of its OSB segment, but the fact is commodity based OSB is still a sizeable chunk of revenue and profits.
The good news is that I believe the company was anticipating such a decline eventually – with historically-high OSB prices bound for some sort of correction. Even as OSB was bringing in wads of cash at its peak, leadership pressed the importance of Structural Solutions to the future of the company’s success – with 75% of OSB revenue being the next goal for the segment. Albeit a tough pill to swallow for investors and company alike, reading in between the lines it was evident that some version of what we just saw could be expected- just not as quick as it did.
What This All Means for LPX’s Valuation
As mentioned in the intro of my article, I derive my share price targets from a discounted cash flow model that is driven by a full three-statement model for each company I analyze. At a high level, here are some assumptions for 2022 and beyond I gained from each earnings call that is input into my models.
1. The poor outlook for OSB prices certainly had a negative impact for the valuation of the stock. As a result, consensus estimates for both revenue and EPS took a hit. Initially in my model, revenue for ’22, ’23, and ’24 were $5.46 billion, $5.13 billion, and $5.39 billion, respectively. The most updated figures according to Seeking Alpha are $4.06 billion, $3.14 billion, and $3.24 billion. Similarly, EPS estimates for those years were revised down to the new amounts of $12.81, $6.00, and $5.89.
2. Another large adjustment was to the risk-free rate assumption. In my previous article, the 10-year yield was 2.948%. Yields have since climbed to 3.455% on the back of a strong hawkish stance from the Fed. This increase has a negative impact on the valuation due to future cash flows being discounted at a higher rate than previously assumed.
3. Louisiana-Pacific repurchased a sizeable number of shares throughout the year. My last model shows the company at 85.86 million, and with updated info from the company’s latest SEC filings, the number of shares outstanding is now 73.9 million. This gave a nice little boost to the valuation of the stock.
4. Remaining assumptions that needed to be adjusted were largely minor and included ensuring ’22 CapEx was tied at $415 million after major revenue adjustments, updating the company’s beta, and properly reflecting the stock’s market value of equity.
See below for a walk of how these adjustments affected my valuation of Louisiana-Pacific:
Personal Financial Model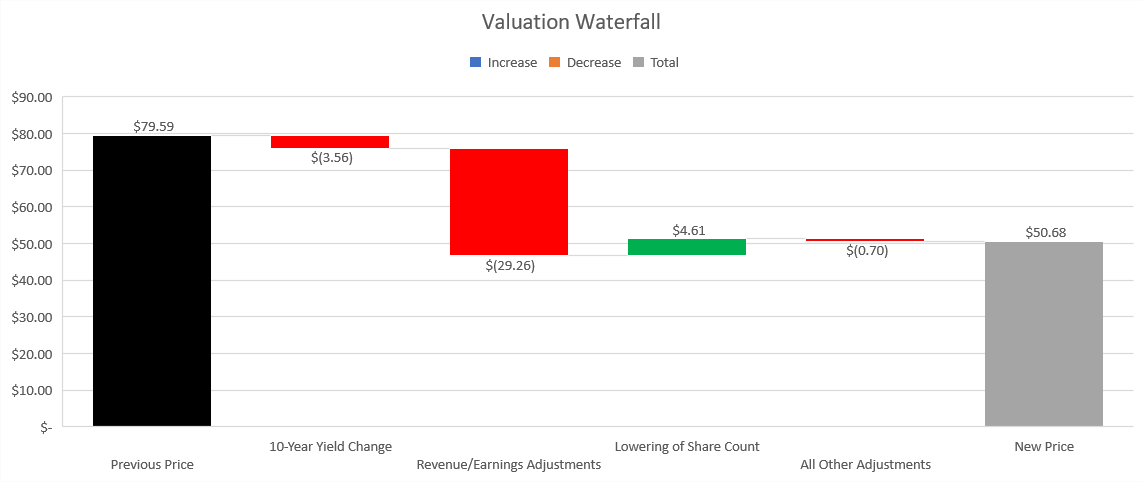
For those familiar with these types of models, there are obviously a lot more assumptions that go into it. In future articles, I plan on digging into my assumptions and what went wrong versus what went right. But to oversimplify everything and provide some numbers, here is a snippet of a valuation sensitivity table with a range of WACC (Weighted Average Cost of Capital) and Long-term growth rate assumptions (both very important for the terminal value of a DCF).
Personal Financial Model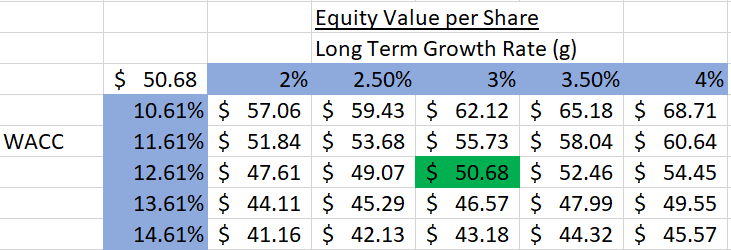
A few notes about the inner-workings of my model and DCFs in general. A DCF sums the present value of all future years’ cash flows. There are two periods we project unlevered free cash flow for. The first stage is your forecast period, which for this model is 5 years. The stage one cash flows are ultimately determined by various assumptions such as revenue growth rate and profit margins, among other things. These 5 years of free cash flows are then discounted by some factor to get the present value of each and then summed together. For Louisiana-Pacific, the sum of its present valued cash flows for the next 5 years is $1.55 billion.
This completes the first half of the enterprise value calculation. The remaining step is to find a way to quantify the present value of all future cash flows after the initial 5-year forecast period. There are a few methods of doing this, but I use the Perpetuity Growth Model. At a high level, this model assumes an infinite long-term growth rate of free cash flows and utilizes this growth rate and Weighted Average Cost of Capital to arrive at the terminal value. This terminal value is then discounted to find the present value, and for Louisiana-Pacific this number is $2.22 billion. Adding this $2.22 billion terminal value of cash flows to the $1.55 billion of stage 1 cash flows brings us to the Enterprise Value of $3.77 billion.
We then need to get to Equity Value, which is first obtained by subtracting cash & equivalents from long-term debt to get Net Debt. For LPX, Net Debt is equal to -$12 million (since cash exceeds debt). This number is subtracted from Enterprise Value and leaves us with an Equity Value of $3.78 billion. To get our final share price estimate, take this equity value and divide it by our diluted common shares outstanding (73.9 million) to get an average share price of $50.68.
As mentioned earlier, I will be reviewing particular assumptions and their accuracy (or lack thereof) in future articles when more company actuals are available.
Comps
For reference sake, here are some comparable companies and how Louisiana-Pacific stacks up in regards to some key ratios. Apples to apple comps are impossible to find in any industry, but both Boise Cascade (BCC) and Builders FirstSource (BLDR) are pretty close. Looking at the table, there aren’t any huge outliers. With that being said, LPX is trading at the highest PE ratio between the three companies while also holding the worst EPS and EV/Sales ratio of the trio. A large part of that could be attributed to the stock not falling as much as the others over the last month. For me, the comps tell me the company is slightly overvalued relative to these select peers. The entire market has had a tough several weeks, but anything related to housing has seen a particular sharp selloff as of late due to concerns regarding the strength of the housing market. Mortgage rates continue to set recent highs as the Fed again raised their benchmark rate, helping contribute to existing home sales falling for the 7th straight month. Expect some turbulence in the near term for this group of stocks.
| LPX | BCC | BLDR | |
|
P/E Ratio |
3.97 | 2.84 | 3.51 |
| EPS | 12.51 | 20.01 | 15.43 |
| EV/EBITDA | 1.98 | 1.60 | 3.03 |
| EV/Sales | 0.79 | 0.22 | 0.56 |
| 1 Month Performance | -14.83% | -20.46% | -17.77% |
Source: Seeking Alpha Financials
The Bottom Line
There are certainly shortcomings to primarily analyzing earnings calls, but I believe it can be a very useful tool in a holistic analysis of a stock – especially as wording from executives across these calls can be so strategic and have a deeper meaning than face-value. Financial models also rely on forecasts and inputted assumptions, but just like earnings calls, if they are utilized correctly, they can provide valuable insights into the valuation and financial health of a company.
My Discounted Cash Flow valuation model suggests the intrinsic value of Louisiana-Pacific’s stock is $50.68, representing a ~2% upside from the most recent closing price of $49.68.
This new price target is significantly lower than my previous valuation. My previous model did bake in a lowering of OSB prices in the near term, but it was nowhere near the most recent guidance given by the company in the Q2 earnings call. The downward adjustment of earnings and revenue, which can primarily be attributed to OSB, brings the valuation down from my prior bullish levels. On the bright side, the stock’s Siding segment is still providing robust growth while Structural Solutions OSB is making progress in reducing dependence on commodity-based OSB. However, the current macro-backdrop in the housing market and poor commodity pricing guidance hurts the company’s cash flow in the near term. Although the stock retains a rock-solid balance sheet and will continue to generate admirable earnings for shareholders, the top and bottom line just won’t be as lucrative as in previous quarters. Investors should take a cautionary stance until more guidance on OSB is given and the near-term housing macro backdrop further develops.
Be the first to comment