

Long GBP/JPY – Multi-Year Trendline Under Pressure
- GBP/JPY long-tern downtrend under threat
- A confirmed break above 156.00 opens the way higher.
GBP/JPY is up around 30 big figures from the spike low made in mid-March 2020 with the daily chart showing a series of higher highs and higher lows printed along the way. A lot of the thrust behind this move has been from an improving British Pound, while the Japanese Yen continues to struggle due to a seemingly never-ending dovish monetary backdrop.
While recent commentary from the Bank of England (BoE) suggests that the central bank remains concerned over tightening monetary policy too quickly, to allow inflation to become more entrenched, price pressures in the UK are growing. The latest UK inflation reading of 2.1% (May) is above target and while the central bank believes this jump to be transitory, they also conceded that owing primarily to developments in energy and other commodity prices that inflation ‘is likely to exceed 3% for a temporary period’. The BoE may continue to stand pat on policy measures but if inflation continues to push higher over the next three months, so will Sterling.
In contrast, the Bank of Japan continues to push a loose monetary policy, keeping interest rates in negative territory in a continued effort to pump prime the economy. Inflation remains negligible – the latest reading of -0.1% y/y is miles away from the central bank’s target of 2% – while the Bank of Japan sees GDP growth of 4% this fiscal year, compared to a 4.6% contraction in 2020.
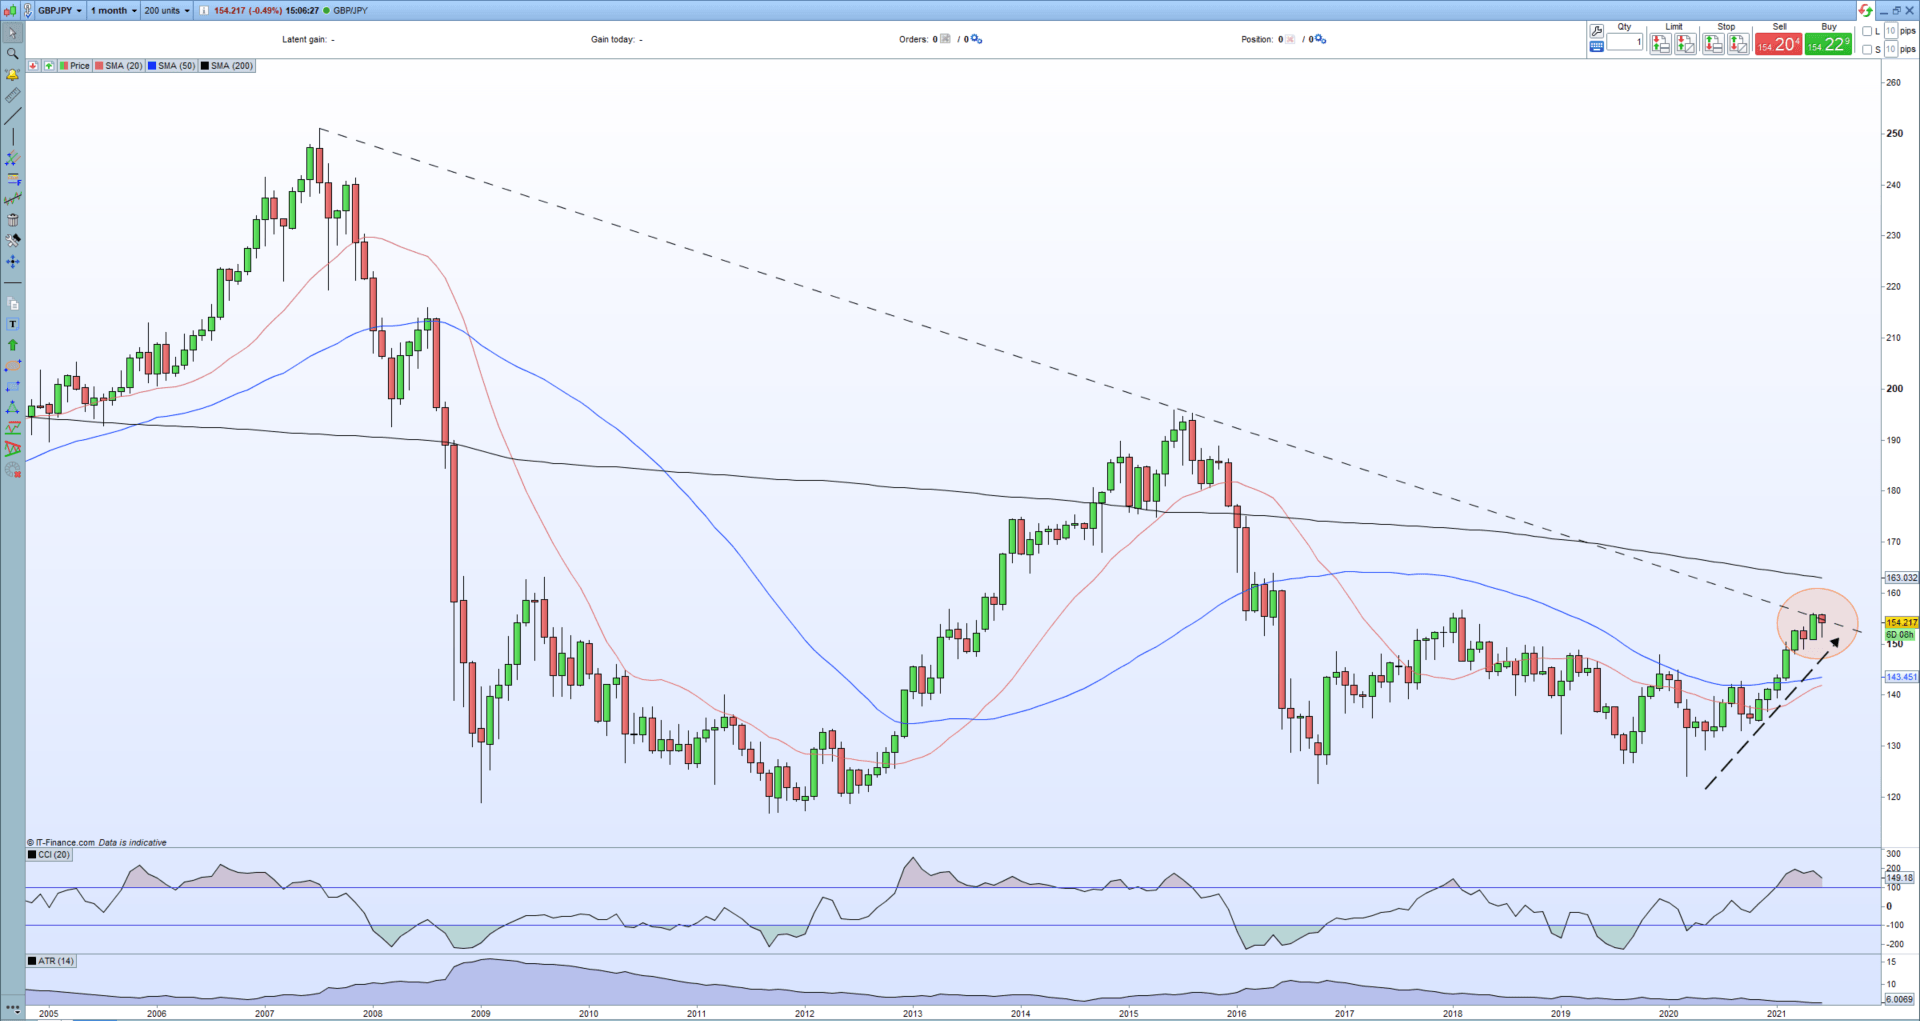
If we look at the broader picture, the monthly GBP/JPY chart shows the pair at an interesting point with the rally over the last 16 months now making an attempt to break above the multi-year downtrend. The first attempt has failed, but as the two slopes begin to cross, repeated attempts are likely to be made.
GBP/JPY Monthly Price Chart
If we reduce the timeframe and look at the daily chart, we can see that the multi-year downtrend is currently holding but has been under constant pressure over the last month. For the pair to move higher there needs to be a confirmed break above trend which would allow a move back to 156.00 and above. There is a cluster of high prints around the 163.90 made between February and April 2016 and this zone may be the next upside target for GBP/JPY if a break above the long-term downtrend is confirmed.
GBP/JPY Daily Price Chart

See the favorite trades from each DailyFX Analyst for the third quarter. Download our new 3Q top trading opportunities from the DailyFX Free Trading Guides!
Be the first to comment