


PeopleImages/iStock via Getty Images
Introduction
In this monthly newsletter, we try to identify the most attractive opportunities in our research coverage by reviewing key news and price moves by sector.
The forecasted annualized returns of key companies in our coverage, along with their current and assumed exit P/E multiples, are below:
|
Illustrative Annualized Returns vs. Current & Exit P/E Multiples 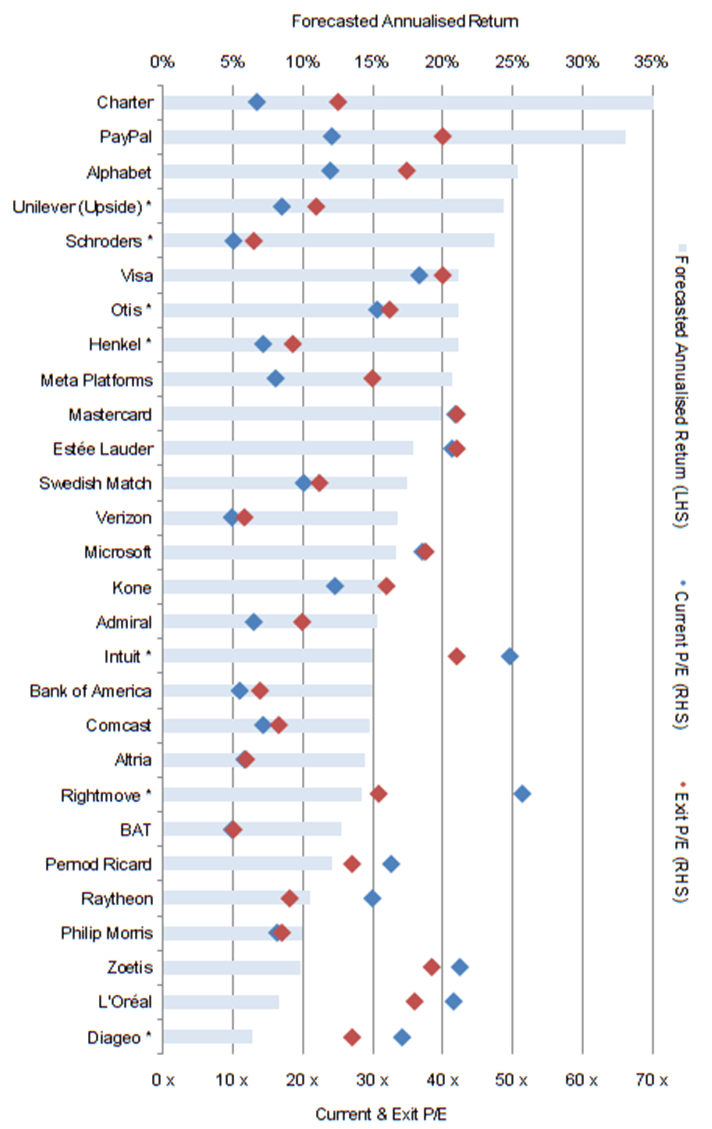 Source: Librarian Capital estimates; market data as of 08-Apr-22. NB. Annualized returns are for the end of 2025 (or, where applicable, a company’s FY25). Companies pending reviews are marked with an asterisk (*). Multiples for Charter and Comcast are based on FCF. |
While the stocks above have been ranked by forecasted returns, the return figures are for our base case scenarios and not probability-weighted, so a higher-ranked stock does not necessarily offer a better risk/reward.
Key Stocks By Sector
We discuss the most notable stocks by sector below.
U.S. Communications: 2022 Key Year to Watch
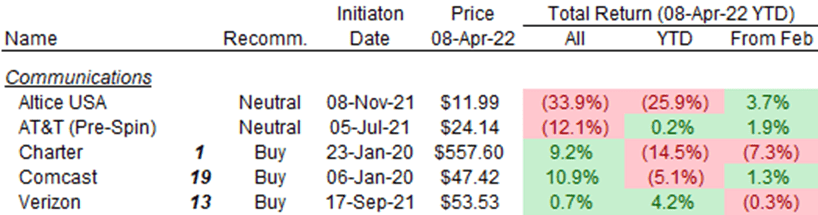
In U.S. Communications, Charter (CHTR) has the highest forecasted return in our coverage, while Comcast (CMCSA) has moved down to #19 (from #5) and Verizon (VZ) is at #13 (was #17):
Source: Librarian Capital estimates.
Charter’s investment case remains as described last month. Shares have lost 7.3% since February with no material news, while Cable peers Comcast and Altice USA (ATUS) saw their shares rise slightly.
One negative may be Verizon’s disclosure in March that they expect their Fixed Wireless net adds to be approx. 150k in Q1 2022, nearly double the quarter before (78k). Fixed Wireless is a bear case for U.S. Cable (the other being telco fiber), potentially opening up monopolistic/oligopolistic local broadband markets to competition. It is relatively new (unlike fiber), enabled as a scale offering by new spectrum (particularly the C-band on in January), and 2022 will be the first year its real impact can be observed. As we have discussed previously, we believe U.S. Cable possesses multiple advantages, and we expect it to maintain good revenue growth even with Fixed Wireless competition.
The 150k figure does not change our thinking. It is just one quarter’s data for a new-ish product, and is small compared to the sector (where the 7 key players have 712k broadband net adds last quarter, and Charter alone has 30m+ subscribers). It may even indicate industry net adds have started rising after decelerating after a surge in the first few quarters of COVID-19:
|
Wireline & Fixed Wireless Broadband Net Adds – Key Players 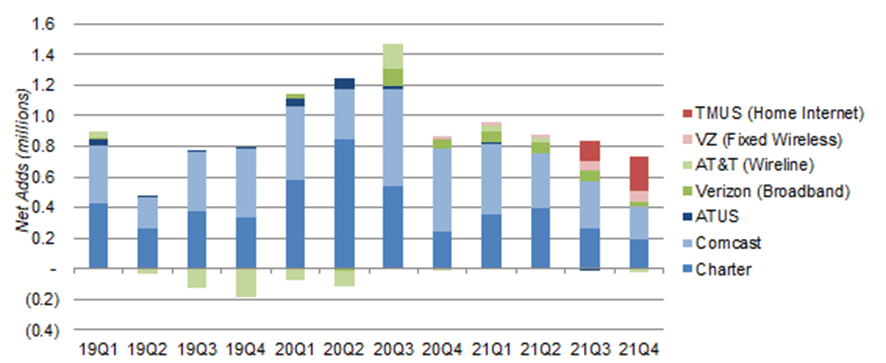 Source: Company filings. NB. TMUS figures only disclosed from Q3 2021. |
Comcast has moved down in our ranking after we cut our forecasts following a review of Q4 2021 results. We now expect a mid-teens annualized return (compared to low 20s previously), driven by cuts in Media, where intense competition in streaming now means a later breakeven at Peacock, and Theme Parks, where we think new parks (including in China) will ramp up less quickly. We still expect Cable EBITDA to grow at 6.5% annually. With nearly 80% of EBITDA from Cable, Comcast’s investment case is similar to Charter’s, but it has some (currently weaker) non-Cable businesses and uses debt and buybacks less aggressively. Comcast’s FCF Yield is also higher (at 7.3%, compared to Charter ‘s tax-adjusted 5.4%), and pays a dividend (2.3% yield).
Verizon shares are still forecasted to have an 17% annualized return, following a review of its investor day (as well as AT&T’s (T)) in March. We prefer Verizon over AT&T (whose shares we would avoid), based on its more disciplined growth in wireless, Mobile Virtual Network Operator partnerships with Charter and Comcast, and optionality in Fixed Wireless. Shares have a Dividend Yield of 5.0%, and we believe its EPS will grow at a CAGR of 6.2% in 2021-25 and its P/E will re-rate upwards from 9.5x to 11.6x.
|
Verizon Selected Outlook (2022-25) 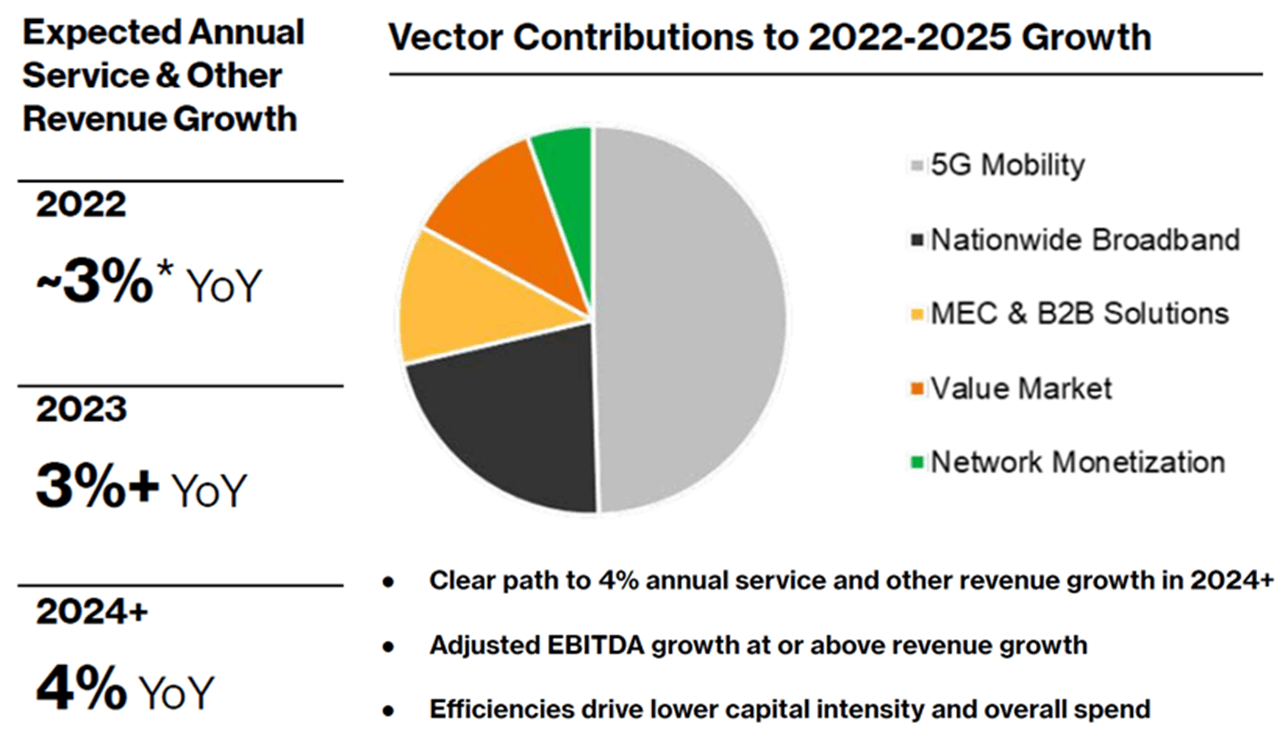 Source: Verizon investor day (Mar-22). NB. Nationwide Broadband includes Fixed Wireless. |
Verizon also reiterated that its fiber roll-out is close to complete, while AT&T again played down the potential of Fixed Wireless, showing that even telcos disagree on the size of these two supposed threats to U.S. Cable.
AT&T completed its WarnerMedia spin-out on April 8, with new Warner Bros. Discovery (WBD) shares commencing trading on April 11. Old AT&T shares last traded at approx. $24, representing a loss of 12% after we initiated coverage at Neutral in July 2021.
Payments: Rising Bond Yields Have Not Changed P/E
In Payments, PayPal (PYPL) has the #2 highest forecasted annualized return in our coverage, at more than 33%, while Visa (V) and Mastercard (MA) are at #6 and #10, each with approx. 20%:
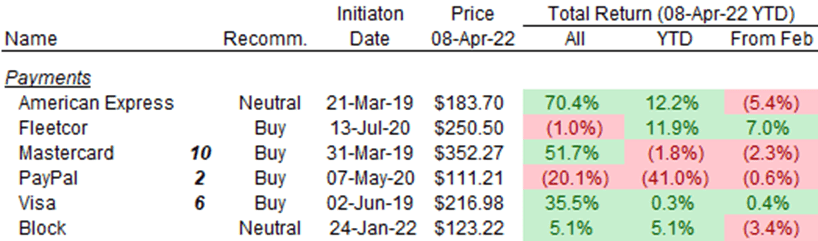
Source: Librarian Capital estimates.
All three investment cases include a double-digit EPS CAGR (highest for PayPal), with the shift to electronic payments driving revenue growth and operational leverage driving margin expansion. We expect P/E multiples to be stable at the current level (of 42x) for Mastercard, and to re-rate upwards for Visa (from 37x to 40x) and PayPal (from 24x to 40x).
These multiples imply earnings yields of approx. 2.5%. U.S. Treasury yields are at approx. 2.8% for maturities of 3 years or longer, after surging in the past year on inflation fears:
|
U.S. Treasury Bond Yields (By Maturity) 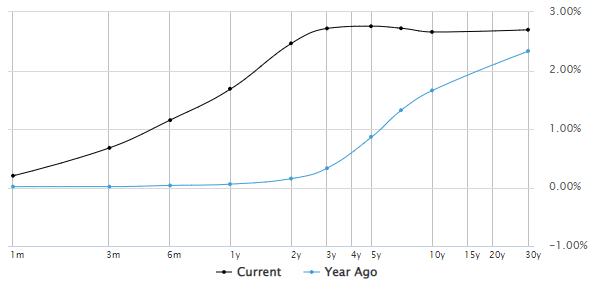 Source: MarketWatch (11-Apr-22). |
We believe Payment stocks are attractive by comparison when yielding 2.5% more, given the resilience and growth in their earnings. Scenarios where bond yields rise further would involve even higher inflation, in which case Payment companies’ earnings growth would also accelerate given their natural pricing power. All three shares have been broadly stable since the end of February, despite 5-year and 10-year U.S. Treasury yields rising by approx. 100 bps.
There were few material news in the sector since February. PayPal CEO Dan Schulman stated that “everything I see right now points to good strength in the core business” at an investor conference on March 8.
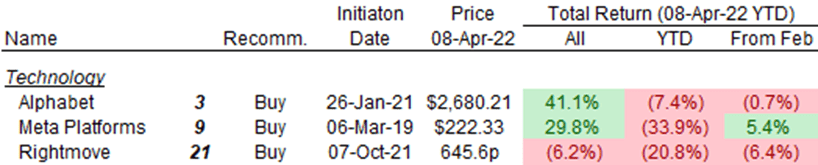
Technology: Still 20%+ Returns in Alphabet & Meta
In Technology, Alphabet (GOOG) and Meta Platforms (FB) are #3 and #9 in our list, with forecasted annualized returns of 25% and 20% respectively, and their investment cases unchanged as described last month:
Source: Librarian Capital estimates.
Meta Platforms shares have recovered 5.4% since February month-end, though still down 33.9% year-to-date. There have been some positive anecdotal evidence: CFO Dave Wehner reiterated at an investor conference on March 10 that Meta expects to lap the headwinds from Apple’s (AAPL) iOS 14 App Tracking Transparency (“ATT”) changes in H2, and clarified that only part of the $10bn revenue headwind attributed to it would be a decline in 2022:
“By the second half of the year … we will be lapping the Apple ATT changes. And at the same time, we expect to continue to improve the targeting and measurement in the new environment …
If Apple had not made the ATT changes, 2022 revenue would be approximately $10 billion higher … it is $10 billion in aggregate. That’s not just the incremental impact in 2022. In the second half of 2021, revenue would have been correspondingly higher as well, certainly to the tune of several billion dollars.”
Meta has also reportedly reduced content creator payments for its incentive program on Reels in March (according to the Financial Times, subscription required). This may be a sign of strength, with Meta feeling less need to “buy” Reels traffic, as the payments were views-based and Meta has a declared focus on engagement rather than revenues or costs on Reels.
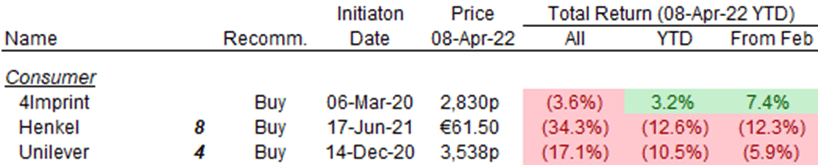
Consumer: Headwinds from Higher Oil & Gas Prices
In Consumer, Unilever (UL) has risen to #4 in our list (from #10 last month), while Henkel (OTCPK:HENKY) has risen to #8 (from #18), the result of their shares having fallen by 5.9% and 12.3% (in local currencies) since February:
Source: Librarian Capital estimates.
We last published articles on the two stocks in November and December respectively, and need to review their full-year 2021 results. At present we do not believe their long-term investment cases have changed, but higher oil and gas prices since the Russian invasion of Ukraine on February 24 represent a material current headwind, both directly through their input costs and indirectly through consumer disposable incomes in Emerging Markets.
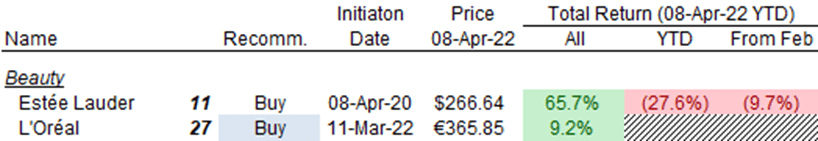
Beauty: Long-Term Growth, Short-Term China Fears
In Beauty, Estée Lauder (EL) is now ranked #11 in our list (from #19 last month), with an 18% forecasted annualized return, while L’Oréal (OTCPK:LRLCF) has re-joined the list at #24, with an 8% forecasted annualized return:
Source: Librarian Capital estimates.
Estée Lauder shares have lost 9.7% since February and are now down 27.6% year-to-date. We reiterated our Buy rating in March after reviewing its latest results – operational performance continued to be strong, margins expanded despite inflation, and Russian exposure is just over 1% of revenues. EPS growth has been consistently at double-digits in recent years, except when interrupted by COVID-19 in FY21, and is guided to be 14-17% (excluding currency) in FY22. EL stock is trading at a 35.9x P/E and we believe it should be at 42.0x, and the Dividend Yield is 0.9%.
|
EL Adjusted EPS (FY15-22E) 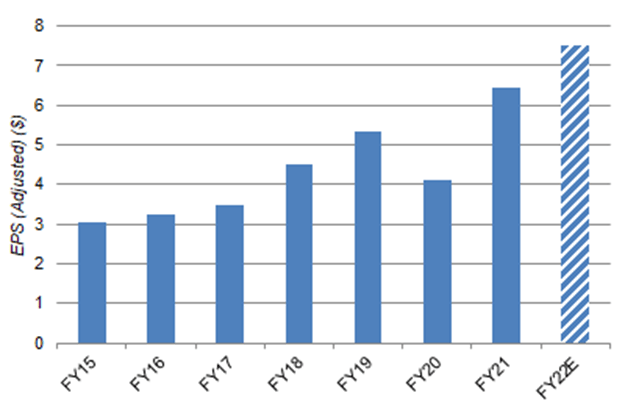 Source: EL company filings. |
L’Oréal was upgraded to Buy in March after shares fell 22% from their January 2022 peak. It is similar to Estée Lauder, but with a more diversified and less premium-focused portfolio, which means lower growth but lower risk. We expect its EPS CAGR to be “only” approx. 9%. Shares have already gained 9.2% since our upgrade, which means a P/E of 41.6x compared to the 36.0x we assume. With the expected de-rating partly offset by a Dividend Yield of 1.3%, the forecasted annualized return is 8%.
A headwind for both stocks is COVID-related lockdowns in China, which represent an outsized portion of their recent growth. Most of the top 100 cities in China (which represent 70% of its GDP) are under some sort of lockdown, with more than 10% of GDP affected by the two toughest levels:
|
China Top-100 Cities Affected by Lockdown (By GDP) 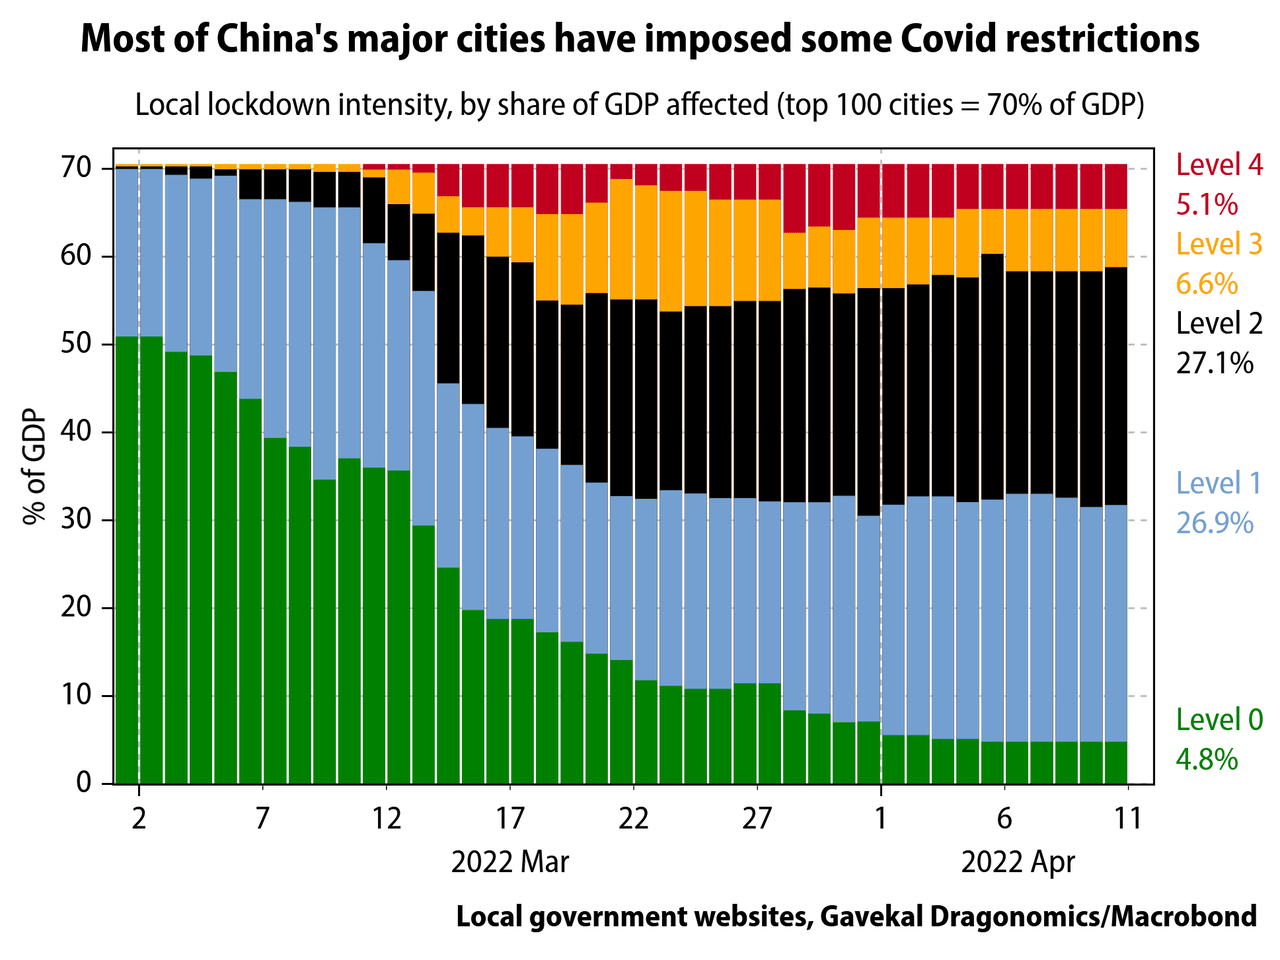 Source: Gavekal Dragonomics (11-Apr-21). |
The impact on L’Oréal and EL is hard to predict and may be material, but it will be mitigated by both companies having more than 50% of sales in China through e-commerce. It also does not change their long-term potential.
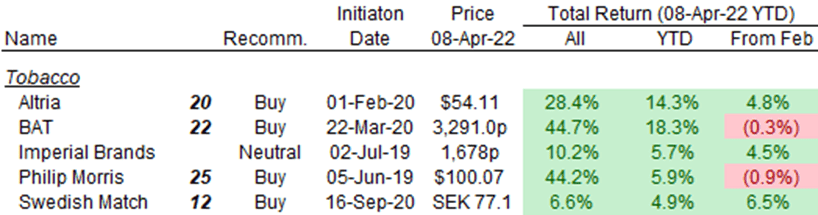
Tobacco: Less Upside After Strong Performance
In Tobacco, Swedish Match remains #12 in our list with a 17% forecasted annualized return, but our other three Buy-rated names are now all outside the top 20, with forecasted annualized returns of “only” 10-15%:
Source: Librarian Capital estimates.
Tobacco stocks have less upside because of their strong performance year-to-date, with (local currency) gains of between 5% and 18%.
Philip Morris (PM) has also been negatively affected by events in Ukraine. Management announced on March 24 that it is exiting Russia; including Ukraine, we estimate PM will see a direct impact of about 7% on its EPS and 1-2% of its EPS growth. Indirectly, the further strengthening of the dollar represents more headwinds to earnings. We now expect Adjusted EPS to fall by 10% year-on-year in 2022, and to grow by just 8% annually thereafter (was 9% before), giving a 2021-25 EPS CAGR of 3%. With a Dividend Yield of 5% and some upward re-rating, the annualized return will likely be 10%.
Swedish Match (OTCPK:SWMAY) shares offer a 17% forecasted annualized return, even after we cut our forecasts after the process to spin off U.S. Cigars was suspended. The decision was prompted by the FDA’s rejection of Substantive Equivalence applications for about 3% of Swedish Match’s cigars, which leads to uncertainty on the remainder. Our expectations for U.S. Cigars were always conservative, and any FDA rule change would have limited impact and take years to succeed. The bulk of earnings is generated by other businesses, particularly nicotine pouches in the U.S., which remain strong:
|
Swedish Match EBIT by Segment (2014-21) 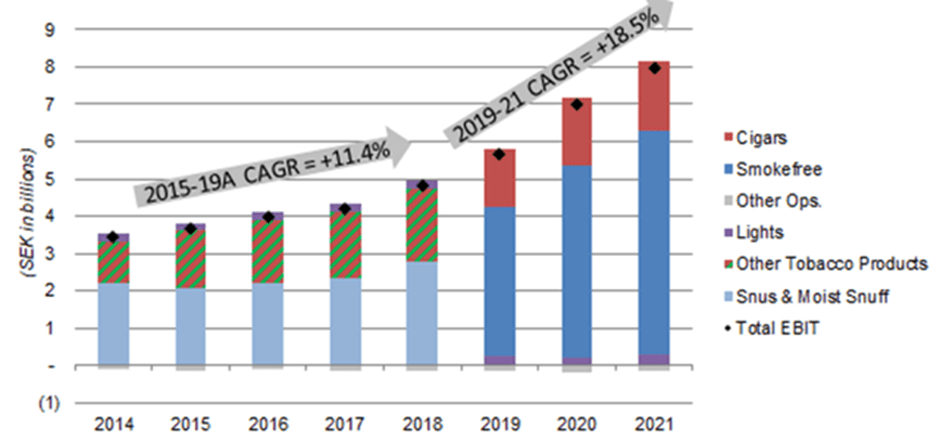 Source: Swedish Match company filings. |
Without the spin-off, there will likely be fewer share repurchases and a lower P/E. We believe EPS can still grow at 9%+ annually, and shares are undervalued at a 20x P/E (we assume 22.5x) and a 2.4% Dividend Yield.
Other Sectors
Sectors not discussed, in ascending order of performance since February, are:
Source: Librarian Capital estimates.
We upgraded Pernod Ricard (OTCPK:PRNDY) to Buy on valuation grounds in March.
Looking Ahead
We expect further market volatility in April, as geopolitical tensions remain unresolved and energy prices stay high. Companies will start reporting results for Q1, an unusual period for many reasons, so there may be even more potential than usual for investors to overreact. However, we are confident in the long-term investment cases of our Buy-rated stocks, and will look to take advantage of any bargains offered by such corrections.
Be the first to comment