

Julio Tamayo
Online lending marketplace, LendingTree (NASDAQ:TREE), has been beaten and battered in 2022, experiencing a more than 80% plunge. While this may lead investors to believe that there is value there, and certainly, the company’s financial performance does not suggest a company on the brink of destruction, there are no near-term triggers for mean reversion. Any meaningful mean reversion is likely to occur after a year, or two, possibly more.
Blood On the Stock Market
LendingTree has been eviscerated on the stock. With the stock price down over 80% year-to-date, investors who bought the stock at the beginning of the year, need a bounce of more than 500% to get back even. Those investors are advised to sell and move on. In my opinion, there is no coming back.
The S&P 600’s travails seem tame in comparison, with the index down just over 14%. LendingTree’s peers have experienced swinging cuts to their share price, with SoFi Technologies, Inc. (SOFI) down nearly 67%, Upstart Holdings, Inc. (UPST) down nearly 87%, and LendingClub Corp. down nearly 59%.
Source: Google Finance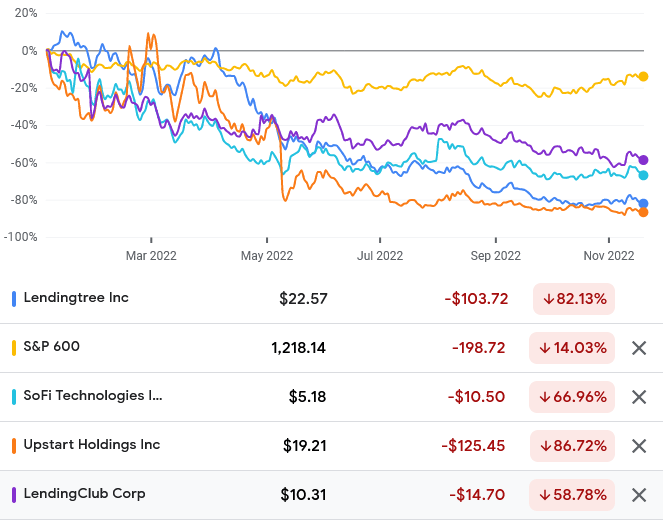
The picture does not look any better when over a 5-year time frame. In that time, LendingTree’s share price has plunged 92.5%, meaning that investors throughout that cycle need a 1,333.33% bump to get back whole. In other words, they require a miracle. For them, there is no coming back. SoFi is down 50.24%, Upstart is down 56.43%, and LendingClub is down 51.6% over that 5-year cycle.
Source: Google Finance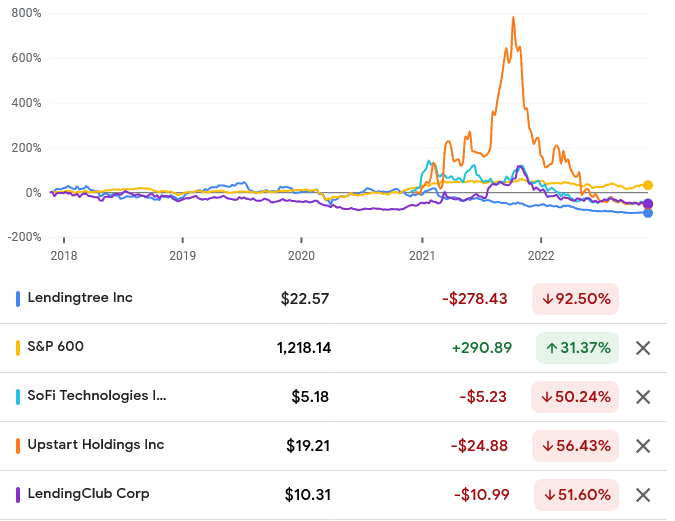
Risk, however, depends on your position. What is a risk for those patient long-term investors, may present an opportunity for an investor coming into the market at this point in the cycle. It should be noted that a preponderant proportion of those losses have taken place this year. In recent months, the share price has started to recover. The question is whether there is any basis for significant mean reversion.
Strong Financial Performance
Revenue has grown from nearly $617.74 million in 2017, to more than $1.098 billion in 2021, at a 5-year compound annual growth rate (CAGR) of 12.2%. According to Credit Suisse’s (CS) The Base Rate Book, 12.6% of businesses experienced a similar rate of growth in the 1950 to 2015 period. The median 5-year revenue CAGR was 5.2%. In the first nine months of the year, the company has earned revenues of $782.9 billion. Revenue is likely to breach the $1 billion barrier again, despite a challenging environment. Sales growth, however, has only a 0.28% correlation with total shareholder returns over a 5-year window.
Source: Credit Suisse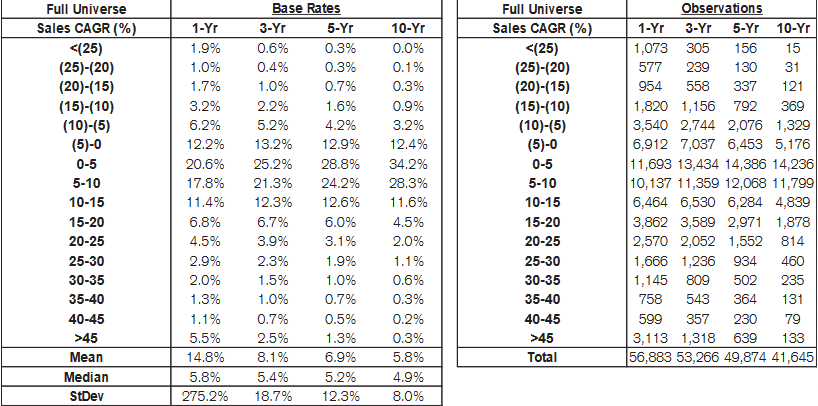
Revenue is derived from three main segments: Home, Consumer and Insurance. The weighting of each segment shifts on a year-to-year basis depending on the economic environment. In 2021, the consumer and insurance segments each accounted for 30% of revenues, and the home segment accounted for 40% of revenues.
Source: LendingTree 2021 Annual Report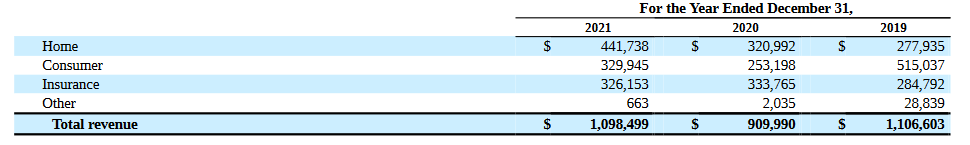
In the third quarter, the consumer segment was the largest segment and helped buoy results despite declines in home refinance volumes and a difficult insurance environment.
Source: Q3 Letter to the Shareholders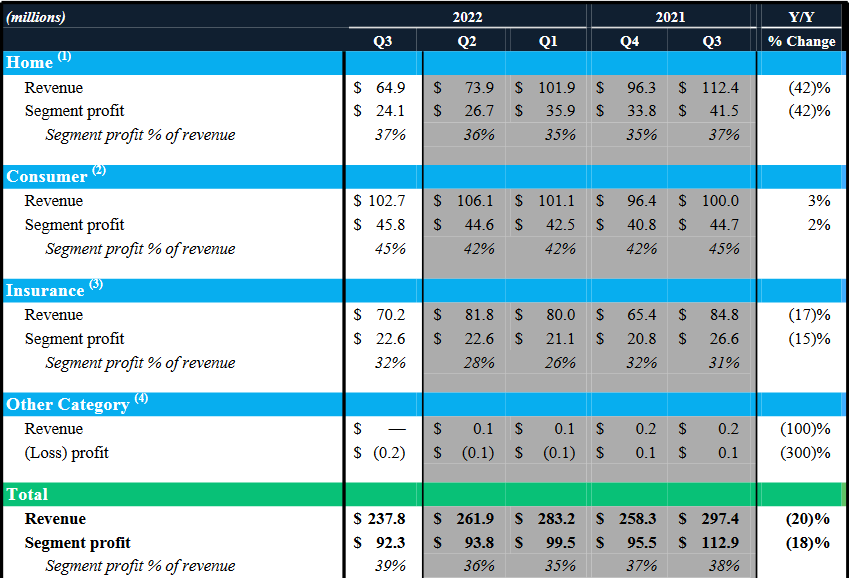
LendingTree’s gross profitability has always been excellent, despite declining from nearly 0.84 in 2017, to nearly 0.76 in 2021. In “The Other Side of Value: The Gross Profitability Premium”, Robert Novy-Marx showed that 0.33 and above represented an attractive gross profitability level. There is a 0.24 correlation between gross profitability and total shareholder returns over 5 years.
Operating margins have been abysmal in that 5-year period, declining from 0.00054% in 2017 to 0.000073% in 2021. This reflects the company’s difficulties in making a profit in the interest rate environment that has held in that period. Operating margins are highly persistent over 5-year periods, with a coefficient, r, of 0.72. Investors should not expect any dramatic changes here.
Source: Credit Suisse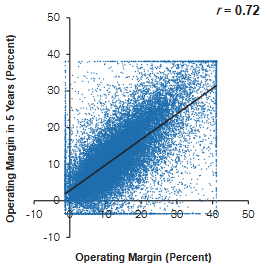
Variable marketing margin, which the company defines as, “revenue less the portion of selling & marketing expense attributable to variable costs paid for advertising, direct marketing and related expenses, which excludes overhead, fixed costs and personnel-related expenses”, has risen from $207 million in 2017, to $382 million in 2021, for a 5-year GACR of 12.93%. This shows improvements in the operating efficiency of the company in terms of its ability to earn revenue from marketing spend.
LendingTree’s net income and comprehensive income rose sharply, from $15.578 million in 2017, to $69.115 million in 2021, representing a 5-year earnings CAGR of 34.71%. According to Credit Suisse’s data, that gives us a base rate of 3.4% of firms with a similar rate of profitability. The median 5-year earnings CAGR was 5.9%. In the first nine months of the year, the company suffered losses of $177.5 million, putting it on track for one of its heaviest losses ever.
Source: Credit Suisse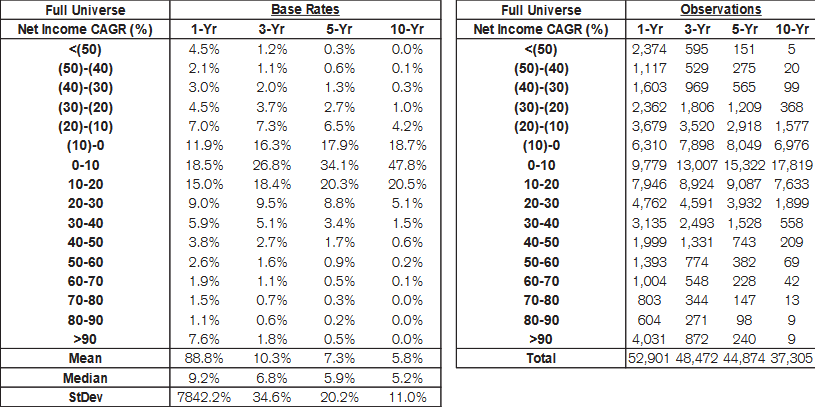
While earnings are difficult to forecast, and easily manipulated (core earnings are a better measure of profitability), the payoff for getting the direction right is very high. The 5-year correlation coefficient between net income growth and total shareholder returns is 0.4.
Source: Credit Suisse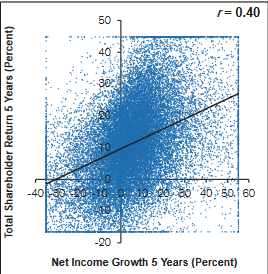
Free cash flow (FCF) generation has been consistent, with FCF rising from $95.498 million in 2017 to $96.191 million in 2021, at a 5-year FCF CAGR of just 0.14%. In that period, the company has earned $507.1 million in FCF. In the first nine months of the year, the company has earned $53.378 million in FCF.
Source: LendingTree Annual Reports and Own Calculations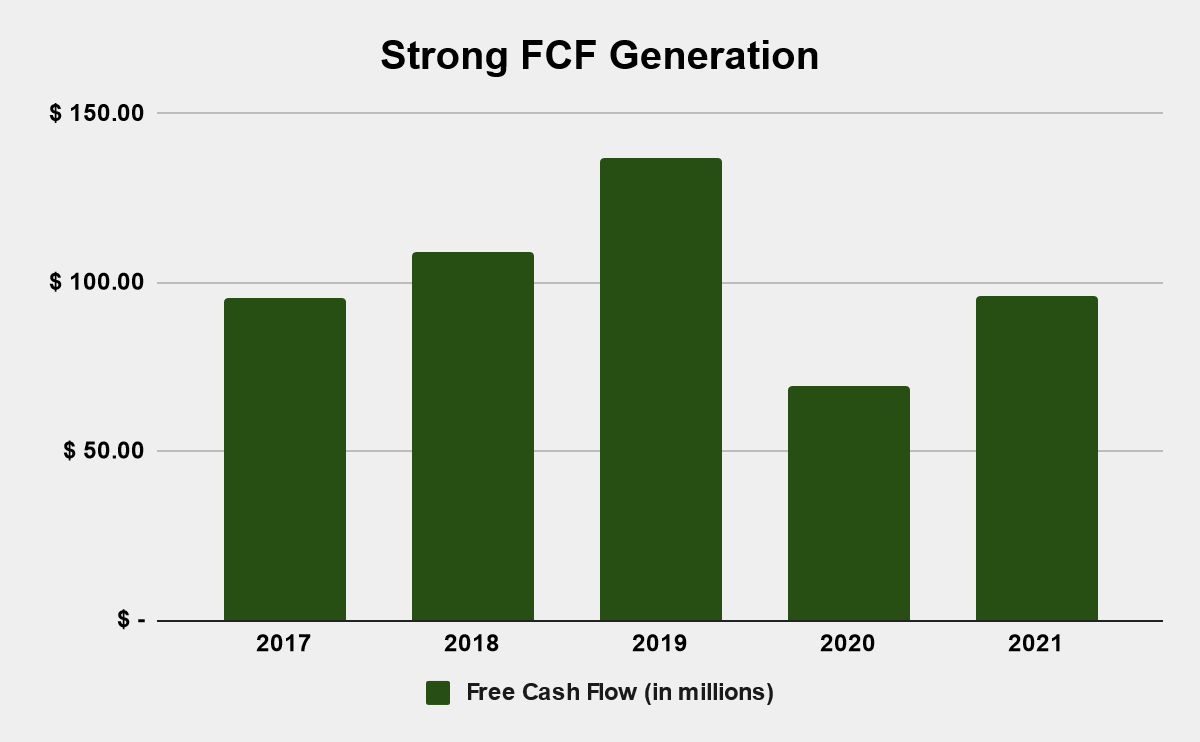
While LendingTree’s return on invested capital (ROIC) is top tier, it has declined from 15.7% in 2017, to 12.3% in 2021.
Source: LendingTree Annual Reports and Own Calculations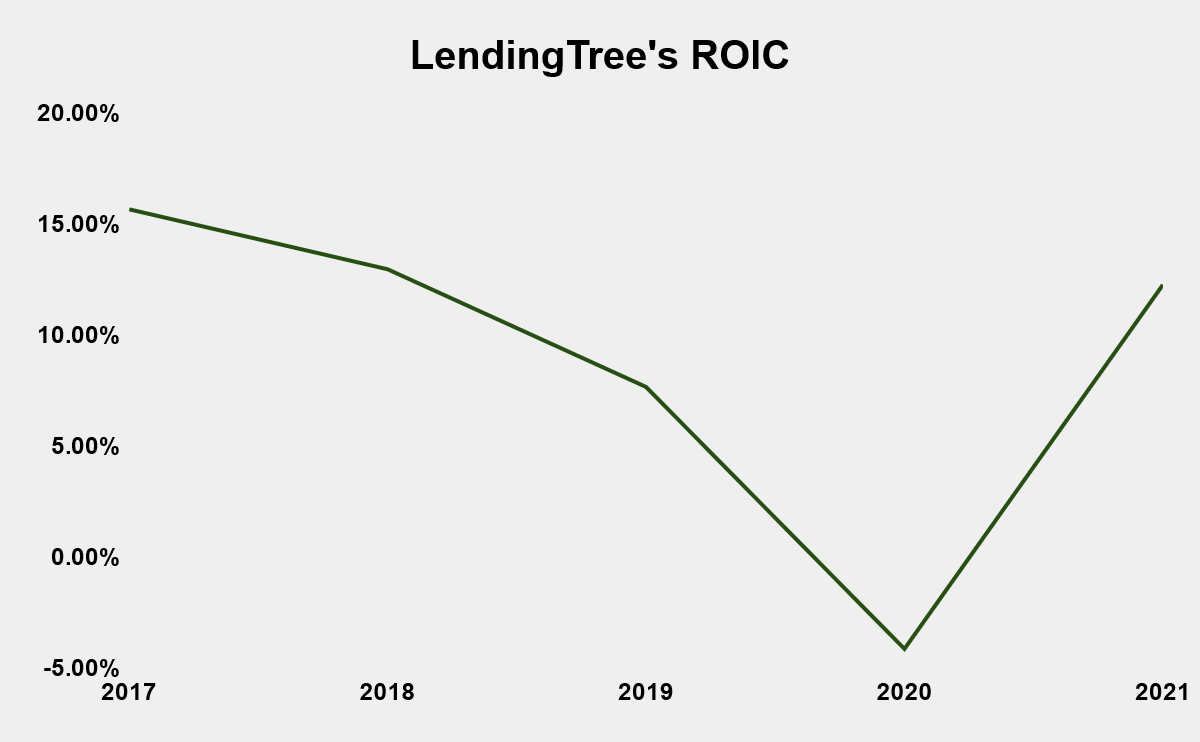
Network Effects are Not Creating a Winner-Takes-All Market
LendingTree’s share price and that of its peers took a hit this year because of rising interest rates and the heightened likelihood of a recession. LendingTree is a matchmaker, matching its more than 21 million users and over 300 lenders on its online platform. Theoretically, the value of the platform rises as the number of users and lenders on it rise. Lenders enjoy a larger and larger pool of customers to lend from, while lenders enjoy the benefits of a larger and larger pool of lenders to borrow from. Thus, network effects lead us to the conclusion that a matchmaker should become more valuable to its users, the bigger it gets, allowing the platform to dedicate more resources to improving the user experience, creating a virtuous flywheel. Certainly, LendingTree has been able to grow at a staggering 46.31% 8-year membership CAGR between 2014 and 2021.
Source: LendingTree Q4 Investor Presentation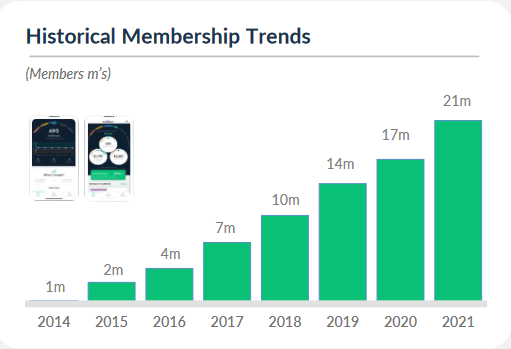
However, while the success of network effects companies such as Alphabet (GOOGL), Meta (META) and Amazon (AMZN) has created an impression that network effects produce winner-takes-all markets, that has not occurred in the lending market. Instead, LendingTree’s platform competes with other platforms, splitting the market between competing matchmakers. Furthermore, barriers to entry are low. LendingTree’s business is not inimitable. LendingTree has to compete with SoFi, Upstart, LendingClub, and other lending platforms, which has hurt its ability to be a price setter and drive its profitability upward. Instead, as we have seen, operating margins are getting crushed.
Nonetheless, as we saw above, LendingTree continues to boast very attractive gross profitability, demonstrating the value it creates for its partners, and the strength of its variable marketing model. Nonetheless, the competitive nature of the market means that LendingTree does not have the ability to set prices that would shield it from significant losses. As we discussed above, LendingTree is on track for one of its deepest annual losses ever.
Interest Rates Are Depressing Demand
As chairman and CEO, Doug Lebda, and CFO, Trent Ziegler, noted in their Q3 letter to the shareholders, “elevated interest rates and inflation at 40-year highs in the U.S.” have “pressured consumer demand for mortgage loans and carrier appetite for new insurance policies”.
With inflation forecast to be up between 3% and 4.5% by June 2023, there is no let up for the company’s problems. Considering that borrowers on the platform typically pay higher rates than they would in traditional banks, the penalty for borrowing with LendingTree has grown and will continue to do so. This means that demand will continue to be depressed in the near-term at least.
Valuation
With a negative P/E ratio given the company’s unprofitability in the last year, the company is seemingly cheap. Gross profitability gives a good signal as well. With $87.47 million in FCF in the trailing twelve months, the company has an FCF yield (FCF/enterprise value) of 9.6%, compared to 1.5% for the 1000 largest companies in the United States, as calculated by New Constructs.
Conclusion
LendingTree’s share price has been hammered this year. While the company is trading at an attractive relative valuation, and the FCF yield is certainly attractive, the underlying economics of the business are so challenging over the near-term that there is a strong possibility that LendingTree may prove to be a value trap. There are no obvious triggers for the business to appreciate in value in the near-term. Thus, while the company is tempting from a pure mean reversion perspective, investors are advised to stay away.
Be the first to comment