

vovashevchuk
Introduction and Overview
Kiwetinohk Energy Corp. (OTCPK:KWTEF) is an Alberta-based energy transition company. The company operates an upstream oil and gas portfolio focused in Fox Creek, targeting the Duvernay and Montney formations. Kiwetinohk’s portfolio also includes three solar projects, and three natural gas-fired combined cycle (NGCC) power plants.
Kiwetinohk represents a unique entity amid the Canadian energy landscape, as the company provides shareholders exposure to a variety of liquids-rich Montney and Duvernay assets, additional exposure to its long-life renewable energy portfolio, and vertical integration which position the company as a major player in Alberta’s energy market (expecting to produce >10% of the province’s energy supply by 2025). As such, we are bullish on Kiwetinohk given its current free cash flow generation and its potential future growth upside. As such we recommend a buy.
Operational Assessment
Kiwetinohk is a junior upstream Canadian producer and will be compared against other comparable peers with production below 25,000. Kiwetinohk is a liquids-weighted producer with 50% of its production from oil and NGL’s, and the balance from natural gas. Kiwetinohk’s operations are concentrated in the Grande Prairie region Alberta, and we will focus our comparison to relative peers within these regions.
For context, the below table summarizes Kiwetinohk’s position across all assessed regions in the Western Canadian Sedimentary Basin. Note that values may not be exact, as they include several underlying assumptions and simplifications.
Figure 1: Summary of Land Position and Production by Region (Source: XI technologies, geoSCOUT, generated and formatted by CER)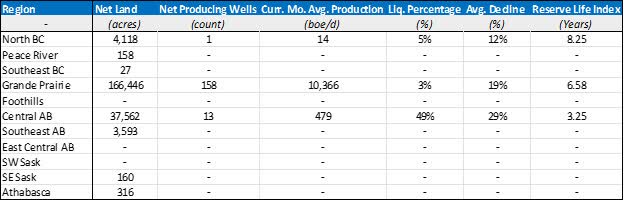
Figure 2: Summary of Land Position and Production by Region (Source: XI technologies, geoSCOUT, generated and formatted by CER)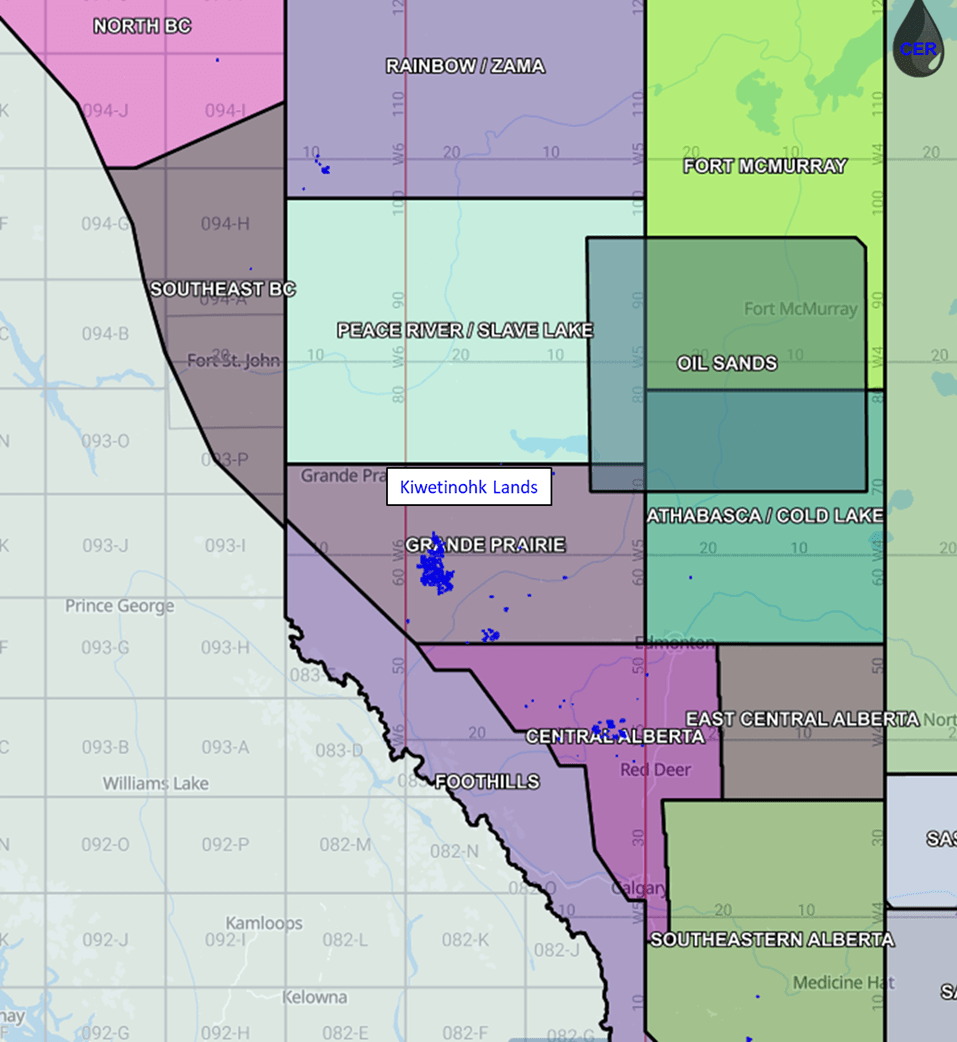
Acreage and Production
As illustrated in many of our articles on the various companies covered, we look at land utilization (illustrated by the plot below) to understand the amount of production each producer generates from its existing acreage position. An operator showcasing excellent land utilization, such as Pipestone illustrated below, displays high production relative to its net acreage position. This is reflective of highly effective geological mapping, and successful drilling and downhole stimulation activities.
Unlike Pipestone, Kiwetinohk maintains relatively higher acreage compared to its production. Although being more competitive than many other peers, we attribute Kiwetinohk’s lower (relative to Pipestone for example) land utilization to the company’s younger vintage and operating presence. The company just listed on public markets in January of this year, moreover the company has been quickly pursuing various acquisitions to expand its acreage position, to support future drilling activities.
One of these acquisitions was announced last week. Kiwetinohk acquired ~25,000 net acres from Repsol in the Montney Placid area, consolidating its position in the area and providing control over future development. Through the acquisition, Kiwetinohk will be able satisfy its Alliance Pipeline commitments, reducing purchased replacement gas volumes further increasing corporate netbacks. Moreover, because of the company’s younger vintage and relatively lower land utilization, we will discount its future cash flows at 15% (compared to our typical discount rate of 10%). You will see, however, that despite the higher discount rate, the company appears undervalued at current price levels.
Figure 3: Net Acreage (Y-Axis), Production (X-Axis) and Net Well Count (bubble size) by Operator (Source: XI technologies, geoSCOUT, generated and formatted by CER)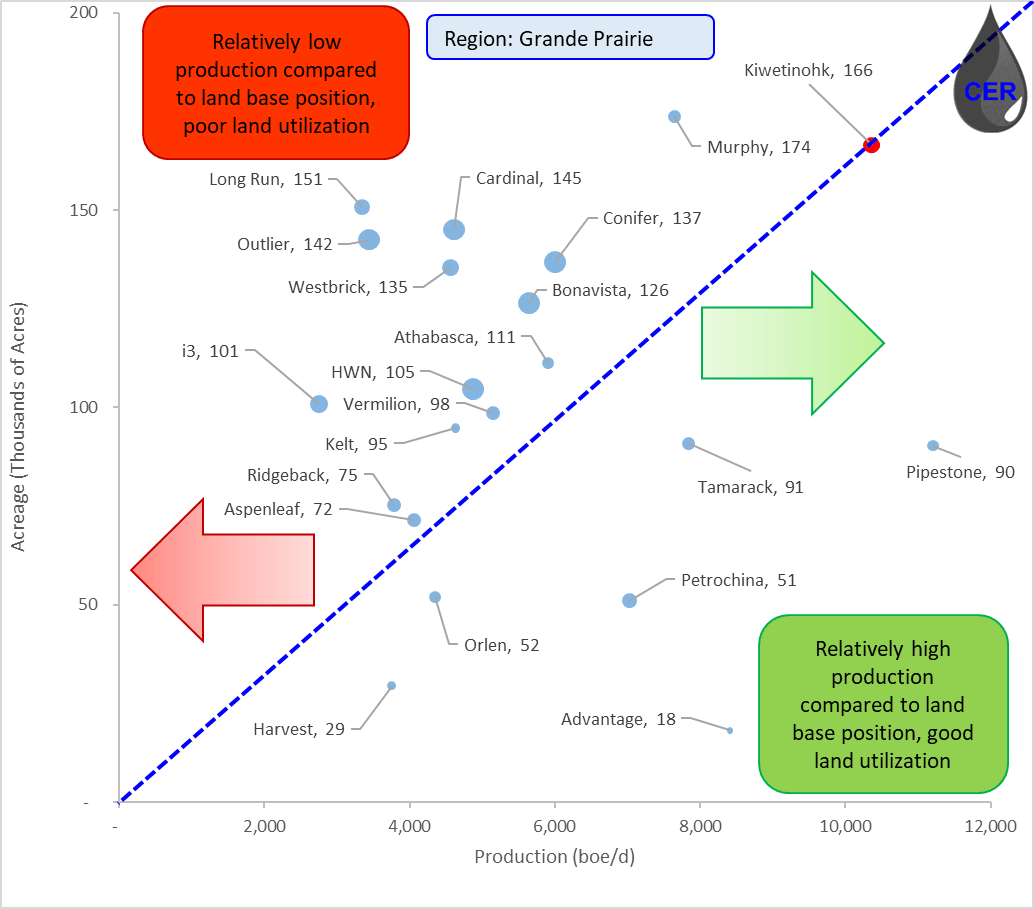
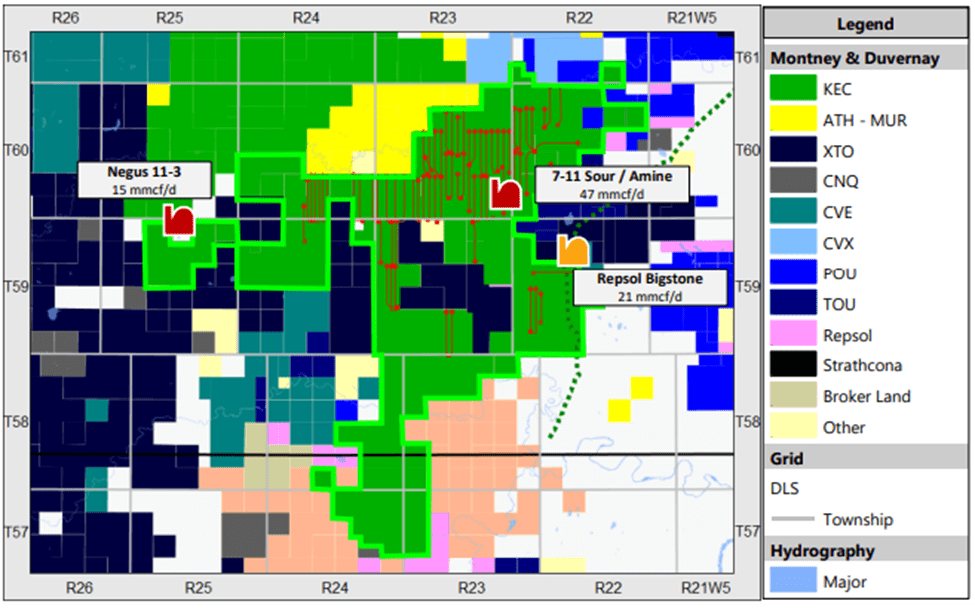
The company’s acreage position is primarily split between two strike areas, Simonette and Placid. The Simonette region is active with many offsetting operators (as illustrated by the map below). The area is serviced by several major gathering lines and Kiwetinohk is strategically placed to supply these facilities. The company’s near term (2022 / 2023) focus lies in the Duvernay region at Simonette, driven by spare facility capacity, lower operating cost, sweet gas production and high working interest in the area. The company has identified 61 Duvernay and 10 Montney drilling locations in the area with breakeven liquids pricing of C$50/bbl Edmonton Par (currently at C$125/bbl). The second area is the Placid, where the company operates 2 gas plants but at relatively lower working interest (<50%) than Simonette. The company has identified 32 horizontal Montney drilling locations with breakeven liquids pricing of C$60/bbl Edmonton Par. Given the company’s breakevens and extensive identified drilling locations we remain incredibly bullish on the company’s future outlook.
Figure 4: Kiwetinohk’s Simonette Acreage, Existing Drilling Locations and Facilities (Source: XI technologies, geoSCOUT, generated and formatted by CER) Figure 5: Kiwetinohk’s Placid Acreage, Existing Drilling Locations and Facilities (Source: XI technologies, geoSCOUT, generated and formatted by CER)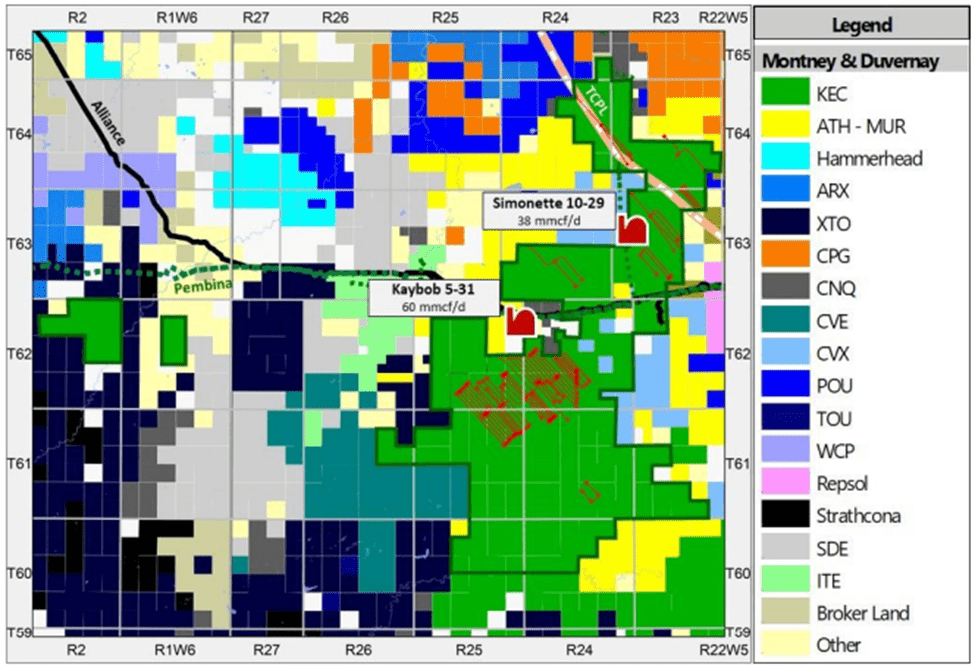
Production Decline and Drilling Activity
The company adjusted its 2022 production guidance to 16,000 – 18,000 boe/d for the year, and its capital guidance to $275 – 290 million for the year, $20 million of which are attributed to Kiwetinohk’s green energy projects. A mid-point increase of approx. 2% from the company’s original guidance in Q1, majority of which will be used to drill and complete 16 total wells. For 2023, the company’s outlook includes 15 new Duvernay wells and 6 new Montney wells, increasing production to ~25,000 boe/d.
During the second quarter, the company drilled four additional wells, and commenced drilling at a two-well pad in the northern part of its Simonette acreage. The company also completed its first full facility turnaround, which are required on a five year basis. The company recently provided results for several of its Duvernay wells delivering IP90 rates of 1,500 boe/d (well above anticipated type curves) and with current rates of 2,000 boe/d. While still early, these initial rates are impressive and serve to validate the company’s expertise in the area.
Given the relatively younger vintage of the company, we would expect higher capitalized peers in the area to be a lot more active in terms of drilling as illustrated by the plots below. Furthermore, given the company’s forecasted development plan, we expect the company to quickly rise in the ranks amongst peers.
Figure 6: Net new drills (LHS) and Avg. Production (“RHS”) by Operator (Source: XI technologies, geoSCOUT, generated and formatted by CER)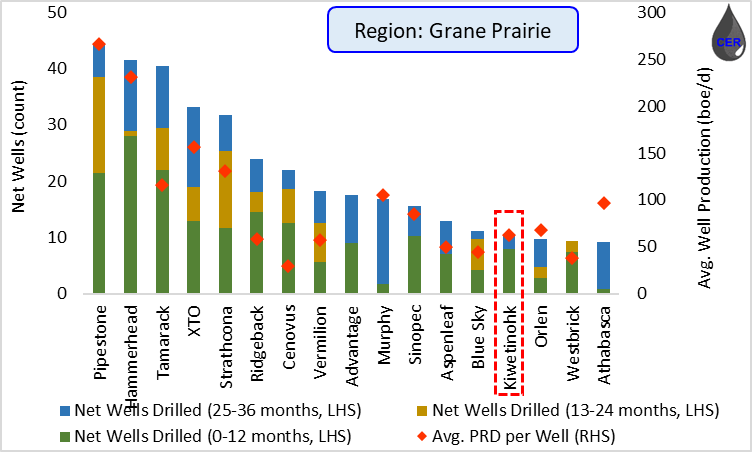
As illustrated by the plot below, the company has already grown production to position itself as one of the top producers compared to other peers of similar size in the region. Additionally, the company is posting relatively modest production declines, which serve to extend the company’s base production profile and reduce the amount of capital / drilling required in order to maintain production flat. This latter point is particularly topical this year, given the inflationary and supply chain pressures affecting casing, and tubing lead times making it more difficult for many operators to grow production. As such, we identify this to be constructive and remain bullish on the company’s future outlook.
Figure 7: Production (LHS) and Average Annual Decline (“RHS”) by Operator (Source: XI technologies, geoSCOUT, generated and formatted by CER)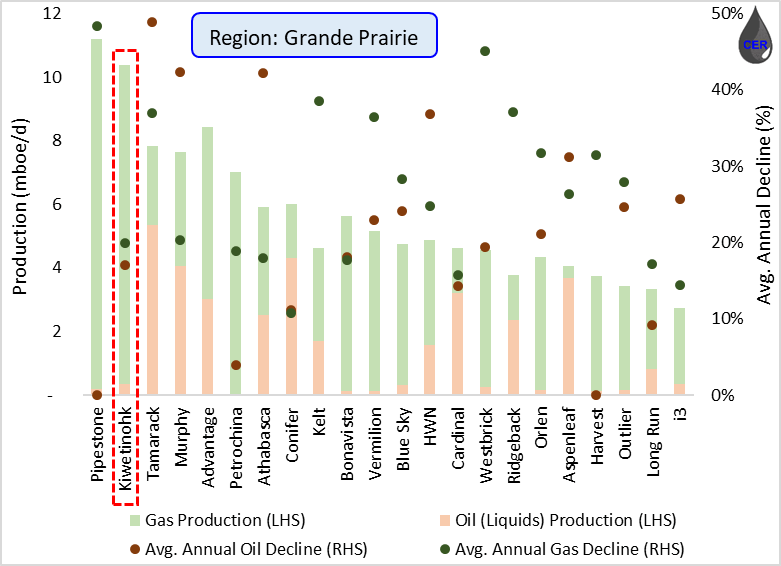
An appealing upside is Kiwetinohk’s renewable and green energy business. Although oil and gas remain core and central to the company’s current operations, Kiwetinohk is also investing in several green energy projects across the province which will provide additional renewable energy exposure to its investors. On its renewable power generation activities, the company owns six projects including three solar projects and three Natural Gas Combined Cycle (NGCC) facilities with a total capacity of 1,950 MW which make up over 10% of Alberta’s current electric grid capacity of 16,000 MW. The company is now expecting FID in H1 2023 for its Homestead (solar) and Opal (CCUS / NGCC) projects and in May the company acquired its third solar development project, with 150 MW Phase 1 capacity and an additional 150 MW expansion capacity. The company estimates the total capital cost to be $257 million, with a targeted FID by Q3 2023.
Figure 8: Kiwetinohk’s Renewable Energy Portfolio (Source: Company Disclosure, generated and formatted by CER)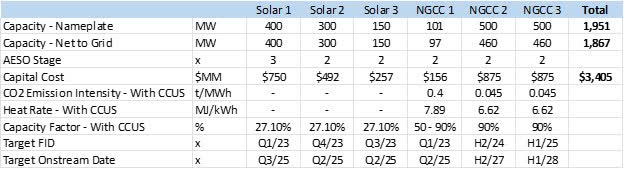
Note that AESO is a six stage process for power projects, required to follow to achieve integration to the electric grid and operate. Stage 1 & 2 include definition & engineering, stage 3 & 4 include regulatory applications, stage 5 & 6 include construction. Note that NGCC 1 is the company’s fast-responding, flexible-output gas driven power generation facility capable of reducing its capacity factor down to 50% in order to ensure constant stable power generation given the intermittency of solar power generation.
We find the renewable energy exposure attractive, as it fully utilizes every stream of the company’s portfolio amid Canada’s shifting energy landscape. The company’s core operations will be underpinned by its liquid production, while natural gas production will be utilized as feedstock its NGCC facilities with CO2 emissions sequestered and providing a stable base load to complement intermittent solar energy production. Lastly, given the growing prevalence of the Canadian Carbon Pollution Pricing, the company will be able to generate meaningful carbon credits up to $170 in 2030 for every tonne of CO2 sequestered from its operations. In light of this, we remain incredibly bullish on the company and its future outlook within Canada’s energy landscape.
Reserves
Given Kiwetinohk’s size and vintage, the company holds relatively low PDP reserves in the area. However, as of YE21 the company and its Independent Qualified Reserve Estimator (McDaniel) report 119 undeveloped locations which maps out to about 11 years of drilling at the current pace of development. We expect the company to accelerate its drilling program, however given the company’s low PDP reserves relative to peers in the area we will discount Kiwetinohk’s future cash flows (see next section below) at a higher long-term discount rate of 15%, above our base discount rates of 10%.
Figure 9: PDP Reserves (left) and Reserve Life Index (“RHS”) by Operator (Source: XI technologies, geoSCOUT, generated and formatted by CER)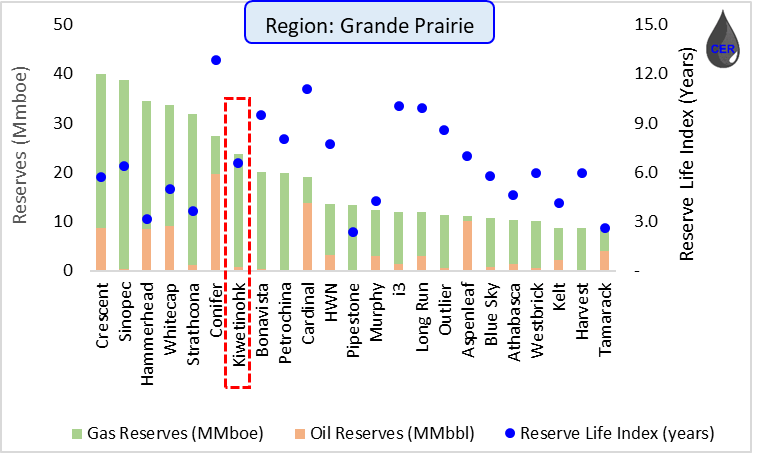
Economic Assessment
In the following five sections we consider Kiwetinohk’s latest earnings and breakdown its intrinsic valuation; starting with a commodity pricing outlook, production forecast, calculating field and corporate netbacks, and finally by discounting free cash flow back to present value.
Earnings and Return of Capital
Q2 volumes were ~16,810 boe/d, well above Wall Street’s estimate of 13,458 boe/d which drove Adjusted Funds From Operations of $1.71 per share compared to Wall Street’s estimate of $1.34 (28% higher). Even more impressively, capital guidance came in shy of Wall Street expectations at $52 million during the quarter vs an estimate of $71 million. Albeit only being publicly traded for two quarters, the company is showcasing impressive results given its ability to meaningfully grow production at lower capital costs, despite the casing and tubing inflationary headwinds.
Pricing
Kiwetinohk’s production can be separated into three main streams: light oils (~6%), NGL (~43%) and natural gas (~51%). On average, Kiwetinohk has been able to realize close to benchmark pricing and is positioned to generate meaningful free cash flow given the current pricing backdrop.
Figure 10: Commodity Price Outlook (source: McDaniels, generated and formatted by CER)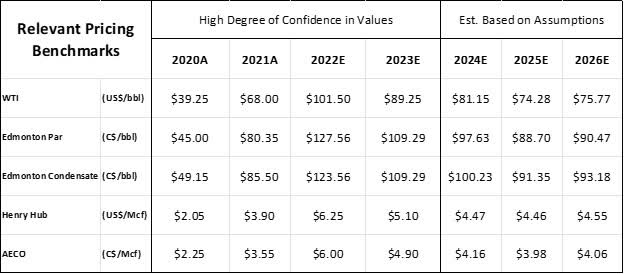
Production
Kiwetinohk’s management provided competitive guidance for 2022, with year-over-year production increasing 86% from 2021, projected to grow another 36% next year. Given the meaningful production growth forecasted until 2023, we have incorporated a lower production growth thereafter to remain conservative.
Figure 11: Production Outlook (source: 2022 Management Presentation, generated and formatted by CER)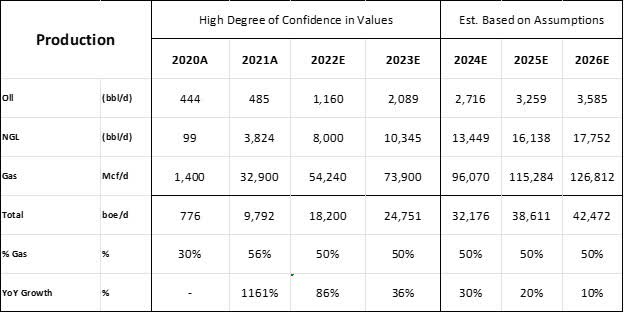
Netback
Given the current pricing environment, Kiwetinohk continues to post appealing field and corporate netbacks. As with any oil and gas company, a major risk is a downturn in commodity prices as we have seen over the past month. Kiwetinohk has mitigated this risk with both fixed price WTI and AECO swaps through Q1 2023. Currently, roughly 70% of 2022 volumes are hedged which does weigh meaningfully on its bottom line field netbacks. Moreover, at the end of Q2, the company revised the royalty rate guidance downward to 10-12% for the year compared to its original guidance of 11-14% for the year, as a result of higher-then-expected Gas Cost Allowance (GCA) credits. Despite the hedging impact, the company is poised to generate meaningful netbacks at ~$40 / boe throughout the rest of 2022.
Figure 12: Operational Netback (All figures in CAD) (source: 2022 Management Presentation, generated and formatted by CER)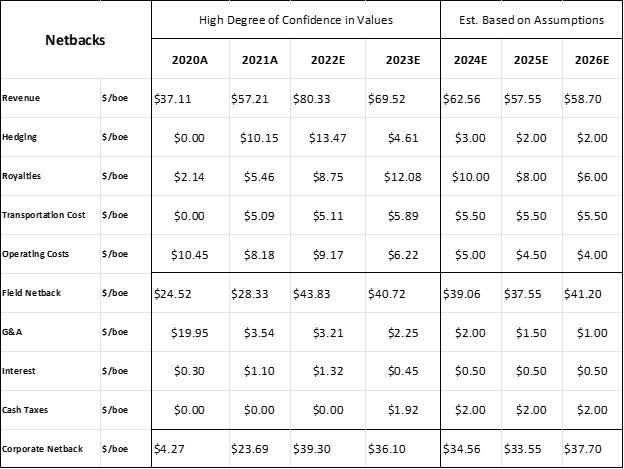
Cash Flow
Given the company’s newer vintage, smaller scale, and relatively lower PDP reserve volumes we will discounts Kiwetinohk’s future cash flow at 15%. As such, the present value of Kiwetinohk falls between C$21/share and C$22/share, implying an attractive ~35% upside from its current valuation. This valuation is underpinned exclusively by the company’s oil and gas assets, and does not include the potential upside of its renewable energy business which in it of itself could be worth up to C$5 billion with an estimate of C$520 million of EBITDA generated once operating.
Figure 13: Free Cash Flow and Present Value (All figures in CAD) (source: 2022 Management Presentation, generated and formatted by CER)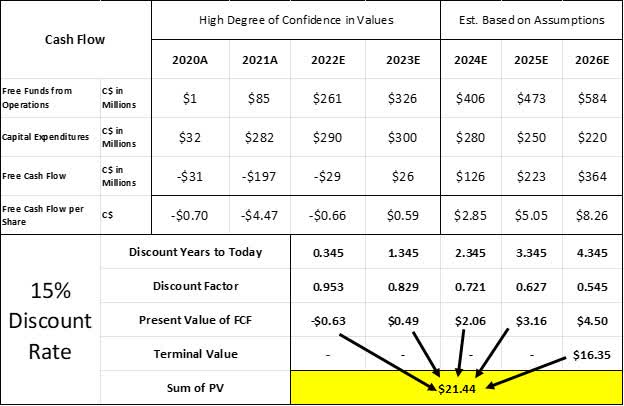
Comparables
Kiwetinohk also remains attractive across several trading multiple metrics compared to Canadian peers of comparable size, as illustrated by the summary table below. Given the implied intrinsic value upside and attractive trading multiple metrics, we believe Kiwetinohk is a buy and we maintain a bullish outlook for the foreseeable future.
Figure 14: Trading Multiples of Various Comparable Peers (source: 2022 Management Presentations, generated and formatted by CER)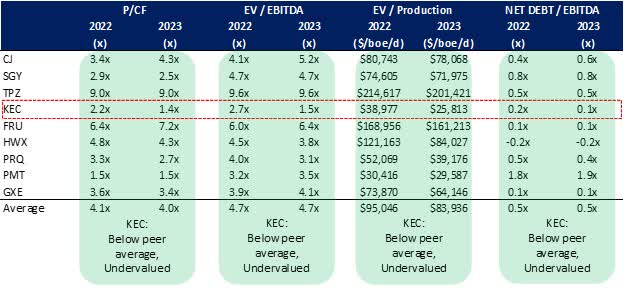
Conclusion
Despite its scale, Kiwetinohk is an incredibly versatile emerging operator who in its recent quarters has proven its ability to exceed production growth forecast, drill and complete wells which outperform IP90 rates and post attractive bottom-line netbacks. Additionally, the company is positioning itself to be a key player in Alberta’s energy market and within the North American energy transition landscape as a whole. As far as intrinsic valuation, Kiwetinohk falls between C$21 and C$22 per share given current commodity, production and free cash flow outlook, implying an attractive 35% upside from the current valuation. Furthermore, Kiwetinohk continues to trade at attractive multiples relative to peers, and as such warrants a buy recommendation.
Be the first to comment