

Editor’s note: Seeking Alpha is proud to welcome Braun Capital as a new contributor. It’s easy to become a Seeking Alpha contributor and earn money for your best investment ideas. Active contributors also get free access to SA Premium. Click here to find out more »

mikulas1/E+ via Getty Images
I give Kimco Realty Corporation (NYSE:KIM) a Hold rating. Kimco is a real estate investment trust that mostly operates open-air, grocery-anchored shopping centers and mixed-use assets. Although Kimco has rallied in the past year, the stock seems to be overvalued based on current financials. Kimco’s dividend has also increased on a year-to-year basis, excluding the pandemic. I think that investors should hold Kimco and rotate into buying other REITs and stocks.
Overview of Kimco’s Operations
Grocery anchored retail centers makeup 77.6% of Kimco’s average base rent (ABR). 44% of Kimco’s ABR comes from essential retailers, 42% from nonessential retailers and 14% from restaurants. 58% of ABR comes from their grocery or anchor tenants, such as Whole Foods (NASDAQ:AMZN), Costco (NASDAQ:COST) , Target (NYSE:TGT) , and Walmart (NYSE:WMT). Mid-tier stores like Dollar Tree (NASDAQ:DLTR) and Trader Joe’s makeup about 11% of ABR, while national franchises such as Panera Bread, Five Guys and JPMorgan Chase (NYSE:JPM) make up about 19% of ABR. About 12% of ABR comes from small, local businesses.
In 2010, Kimco’s real estate portfolio was spread wide across the United States with interest in areas all over the country. Since then, Kimco has aimed to decrease their portfolio size and instead focus on 21 main areas across the country. These areas include Seattle, Washington; Portland, Oregon; San Francisco, California (and the Greater Bay area); Los Angeles, California and Orange County; Phoenix, Arizona; Austin, Dallas, and Houston, Texas; Atlanta, Georgia; Orlando, Tampa, and Miami/Fort Lauderdale, Florida; Raleigh/Durham and Charlotte, North Carolina; Baltimore, Maryland; Washington D.C.; Philadelphia, Pennsylvania; New York City, New York; Boston, Massachusetts; Chicago, Illinois; and Denver, Colorado. In 2018, CEO Connor Flynn said on CNBC’s power lunch show that their transformation of the portfolio had been completed, announcing that the company had sold over a billion dollars of retail real estate in the Midwest. The company now operates in much denser markets with higher barriers to entry, which is a positive for Kimco considering their real estate is now positioned where many large retail companies operate their most profitable stores.
The hardest challenge for Kimco (as well other retail REITs and retail companies) will be trying to bridge the gap between online shopping and brick-and-mortar retail stores. If Kimco’s main tenants continue to offer solutions such as home delivery, curbside pickup, and in-store pickup, they should be able to adapt to current customer preferences just fine. Some of Kimco’s main anchors such as Home Depot (NYSE:HD), Best Buy (NYSE:BBY), DICK’S Sporting Goods (NYSE:DKS) and Walmart have seen eCommerce surpass brick-and-mortar commerce, overtaking far more than 50% of sales.
In 2018, the Supreme Court overturned Quill Corporation v. North Dakota and widened the reach of sales tax for eCommerce stores. This is pushing more eCommerce retailers into brick-and-mortar retail including the eCommerce giant Amazon, a company Kimco would undoubtedly like to have as a tenant. Although the retail space is constantly changing, Kimco has a solid plan in place to adapt to the current market.
Q4 2021 Results
The Q4 2021 and full-year results for Kimco look promising, showing growth in many areas. Kimco purchased $1.2 billion of Albertsons Companies (NYSE:ACI) common stock which was offset by the full integration of Weingarten realty into their portfolio. The Weingarten and Kimco merger was completed in August of 2021, but Q4 2021 was the first quarter it was fully integrated.
Same-store net operating income increased 12.9% on a year-to-year basis, including redevelopments and the newly merged Weingarten realty portfolio. Funds from operations grew from $.31 a share to $.39 a share, although net income available to common shareholders dropped from $.45 a share to $.13 a share. This change was mostly caused by marked-to-market fluctuations in the gain on marketable securities on their 39.8 million shares of Albertsons stock. Kimco raised their dividend by 11.1%, declaring a dividend of $.19 that was paid on March 24, 2022.
Kimco ended the quarter with pro-rata occupancy at 94.4%, a 50 base point increase year-to-year. Pro-rata anchor occupancy increased to 97.1%, a 40 base point increase year-to-year, while small shop occupancy increased to 87.7%, an increase of 160 base points year-to-year. Kimco signed 438 new leases, with rental rates up 14.1%. Renewals and options also grew 7%.
Kimco ended the quarter with $2.3 billion in immediate liquidity, which includes $2 billion under their unsecured revolving credit facility, and $334,7 million in cash and cash equivalents. Kimco’s investment in Albertson’s was also valued at $1.2 billion at the end of the year.
Kimco had a strong quarter and a strong year overall. Their funds from operations grew, showing that their assets are good investments, and the company’s operating performance is strong. Although net income available to common shareholders dropped, this is not alarming considering it was mostly due to marked-to-market fluctuations of Albertson’s stock. With the dividend and FFO increasing, Kimco has proven they can bounce back from the pandemic and continue to grow as a company.
The REIT Space As A Whole: Occupancy Rates
In 2021 REITs rose 40% as a group compared to the 27% return of the Standard & Poor’s 500 Index. However, regional mall REITs were able to rally an amazing 92% last year. Self-storage was able to rise about 80% while apartment REITs rose about 60%. In comparison, Kimco stock did great in 2021, rising about 60% as well.
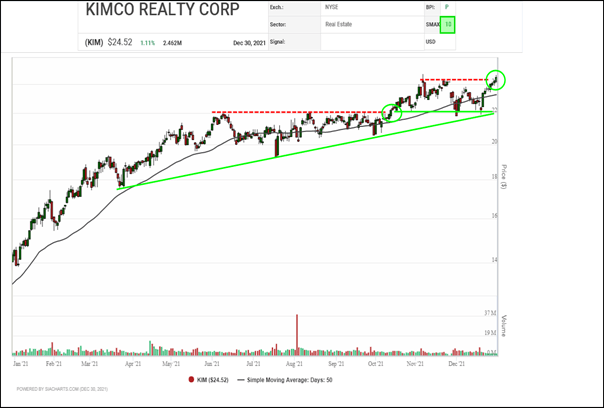
SIA Charts
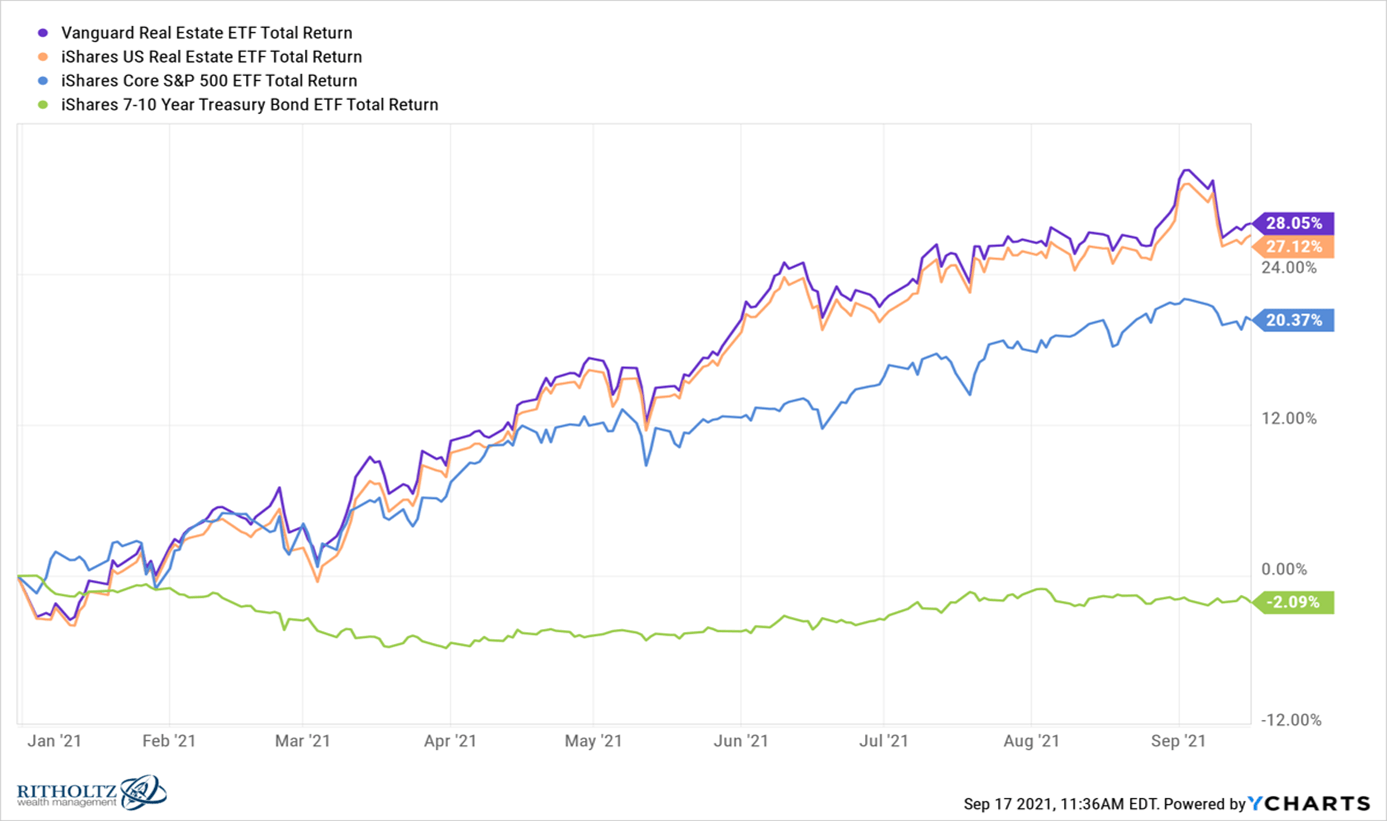
YCharts
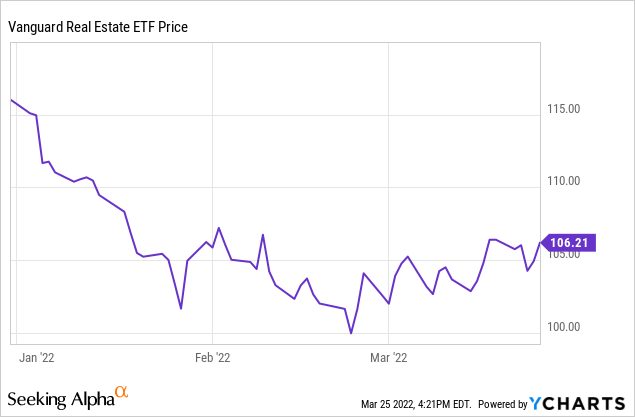
It’s been a different story regarding REITs in 2022. Since the beginning of 2022 the Vanguard Real Estate ETF (NYSEARCA:VNQ) has dropped a total of 9.34%. On average, REITs have lost a total of 5.66% in 2022. Surprisingly, Kimco has done better than average with a smaller loss of 2.12% in 2022.
A huge factor affecting the performance of REITs in the long run is occupancy rates. Before the pandemic, Kimco’s all-time high for occupancy rates was 96.4% in quarters 3 and 4 of 2019. After the pandemic took effect, Kimco’s occupancy percentage dropped from 95.6% in Q2 2020 to 93.5% in Q1 of 2021. Apartment REITs in 2021 reported about a 95.6% occupancy rate, still slightly below pre-pandemic levels. Industrial REIT’s and office REITs reported about 96.4% and 89.8% occupancy rates respectively. Simon Property Group (NYSE:SPG) posted an occupancy rate of 93.4% in Q4 2021, while Macerich (NYSE:MAC) posted an occupancy rate of 91.5% and Tanger Outlets (NYSE:SKT) 95.3%. Federal Realty (NYSE:FRT) and Realty Income (NYSE:O) posted rates of 91.1% and 98.5% respectively. Kimco, on the other hand, posted a 94.4% occupancy rate, which puts them near the top of their peers in terms of occupancy rates.
Kimco has made a good comeback since the start of the pandemic, but there is strong competition coming from other mall operators. Although one of the biggest factors affecting REITs in the long run is occupancy rates and Kimco is doing a good job of making sure their stores are leased, the current stock multiple is too high compared to other better REITs in the same sector.
The Competition Is Tough
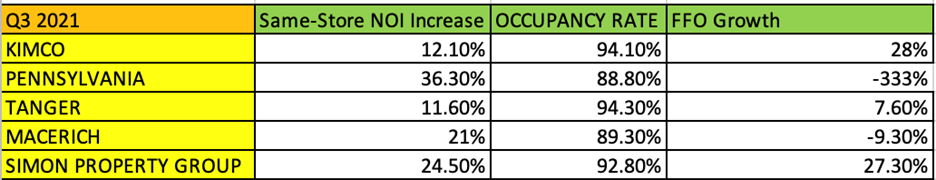
As I mentioned earlier, Kimco is not alone when it comes to mall operators and other REITs. To see how Kimco to some of their top competitors, I’ve taken Simon Property Group, Macerich, Tanger Outlets, Federal Realty, and Realty Income and compared them with each other based on different metrics including occupancy rates, net operating income, and funds from operations growth per diluted share. All analysis was done using results from Q4 of year 2021.
Self Created
Based on the comparison, Kimco pans near the top when it comes to occupancy rates at 97.1% (as mentioned earlier). Only Realty Income had a higher occupancy rate among the group. However, Kimco was near the bottom when compared to other companies’ same-store net operating income with only an 8.75% increase year-to-year. When it came to funds from operations per diluted share growth, Kimco was one of the best, with a 25.80% growth rate.
Kimco’s revenues from the same property pool in Q3 of 2021 were $897,577,000 while expenses were $258,161,000. In Q4 of 2021 these numbers were $1,216,868,000 and $352,077,000 respectively. This shows that although Kimco’s expenses increased over the last quarter, their revenues from the same property pool increased as well to offset that.
Kimco has performed well compared to the other five REITs mentioned, but the competition is still tough. Simon Property Group posted a same-store NOI increase of 36.33% compared to Kimco’s 12.9%, also posting a better year-to-year FFO growth rate of 31.10%. Simon Property Group also posted an occupancy rating of 93.40%. Realty Income’s same store NOI increased by an impressive 26.13%, and their occupancy ratings were the best in the group at 98.20% in Q4 of 2021 although their FFO per diluted share growth was minimal at 5.9%.
Although Kimco has a high occupancy rate, the company’s expenses have caused their same-store net operating income to only increase by a small margin compared to its peers. Their funds from operations per diluted share growth also seems large, but in comparison to Simon Property Group and Federal Realty, it sits in the middle of the list. Kimco has a solid plan to move forward with current market conditions; however, there are better investments out there with lower multiples that you could spend your money on.
Kimco – Dividend
Before the pandemic, Kimco’s dividend had been increasing for several years. When the pandemic hit, Kimco was forced to cut their dividend from $.28 a share (paid on April 1st, 2020) to $.10 (paid on September 9, 2020.) This shouldn’t scare investors, as almost the entire REIT space was forced to cut dividends; Especially because since then, their dividend has increased to $.19 a share (paid on March 9, 2022.)
Their dividend payout ratio in Q4 of 2021 was only 47.80%, a very sustainable number for a REIT. Although their 3-year dividend history shows a 15.32% decline, that number is skewed due to dividend cuts caused by the pandemic. Their dividend yield was 3.02% in Q4 of 2021, slightly lower than the average for REITs which was around 4.3%.
Kimco doesn’t seem to be running out of cash anytime soon, which means they should be able to pay out dividends without a problem. Some may see the dividend was cut in 2020 and be spooked, but there is no reason to be worried about Kimco’s dividend. They have a very sustainable payout ratio, their cash on hand is abundant, and the dividend is increasing over a 2-year basis. Based on their Q4 2021 results, I think Kimco’s dividend will continue to increase as well. Investors should not worry about the health of Kimco’s dividend, as it is strong and will continue to grow as they fully recover from the pandemic.
Kimco – Valuation
I’ve decided to use three different valuation methods, including Price to FFO per share, Net asset value approach, and Debt-to-EBIDTA Ratio. All analysis was done using results from Q4 of 2021. In most of my analysis, I see the current stock price of Kimco being slightly too high to be rated a buy.
Self Made
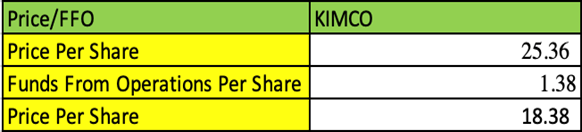
For the first model, I used price to funds from operations per share to calculate the fair value of Kimco’s stock. The model produced shows a P/FFO ratio of 18.38, which is average compared to the rest of the sector. With Kimco trading at almost 18 times their FFO, it doesn’t necessarily seem like the best value play. A dividend yield of 3.02% doesn’t make it anymore attractive. There are better REIT stocks with higher dividend yield and lower P/FFO ratios.
Self Created
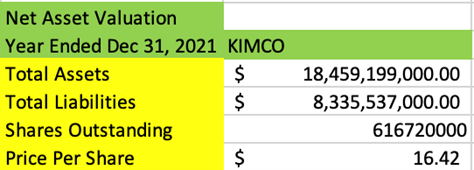
The second method of valuation I used in my analysis was a net asset valuation. Based on this model, Kimco is trading at a price higher than it should be. If this model was to be used to generate the fair value of Kimco, a much lower P/FFO multiple of 11.89 would be assigned, which is much lower than the industry standard. Based on the current price of Kimco, their current FFO multiple, their net asset valuation and their P/FFO multiple, the stock seems to be overvalued.

Self Made
The last model I chose to use was the debt to EBITDA ratio. In this model, Kimco seems to be undervalued slightly. Based on this model, a P/FFO multiple of 18.38 from the first model seems fair; however, the fact that the dividend yield is lower than industry standards and the P/FFO multiple is average for a REIT, the stock still doesn’t seem glamorous to investors.
Kimco isn’t terribly overvalued based on my models, but it is trading at a high multiple compared to some of its peers. Based on my net asset valuation, the price of the stock is trading almost $10 more than what it should be. If the stock price was lower, there could be a value opportunity presented. At its current price and P/FFO multiple, the stock seems like more of a growth play. Although Kimco’s dividend has been increasing, the yield is not high enough to justify buying Kimco stock as a dividend play either. I think investors that own Kimco should hold their Kimco stock, and investors that don’t own Kimco stock should consider the other companies in the same sector before purchasing the stock.
Kimco vs. Peers
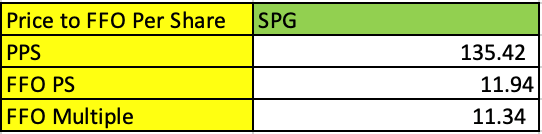
Kimco has a high P/FFO multiple compared to many of its peers. For example, Simon Property Group has a P/FFO multiple of 11.34, which is much lower than Kimco’s. Although Simon Property Group has a lower P/FFO Multiple, what’s concerning is the debt they’re currently carrying.
Self Made
Self Made
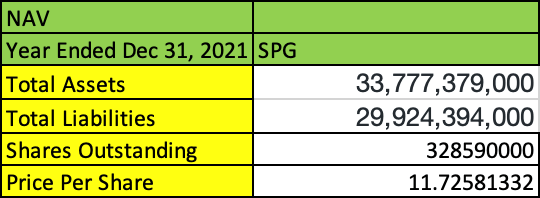
Based on a net asset valuation of Simon Property Group, the share price should only be $11.73. Based on this metric, Simon Property Group seems overvalued. Simon is carrying a lot of debt, and their EBITDA is not enough to offset that.
Self Made
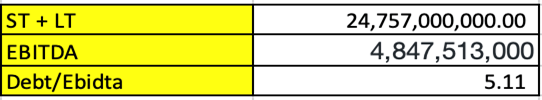
Based on their debt to EBITDA ratio, Simon Property Group seems like they could be in serious trouble with debt issues. A debt/EBITDA ratio is 5.11 is far too high and could present serious issues in the future.
Simon Property Group may be carrying a lot of debt, but they do have a lower FFO multiple, making it a better buy for value investors. A dividend yield of 5.43% is much higher than average, and Simon Property Group’s free cash flows had been increasing before the pandemic. FFO per diluted share also grew 31.10% in Q4 of 2021 for Simon, an impressive number compared to its peers. Simon Property Group is a much better buy for investors despite the debt they are carrying and is a much better value due to its low P/FFO ratio and high dividend yield.
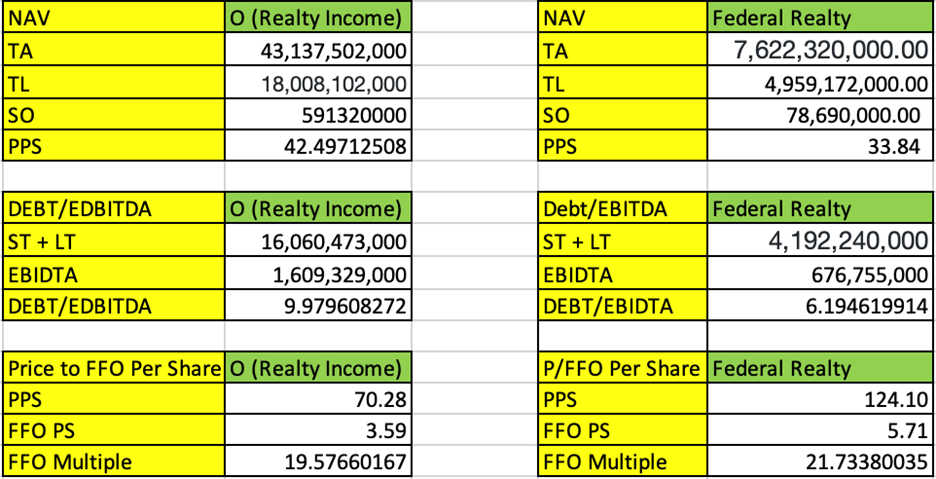
Federal Realty and Realty Income both have super high Debt/EBITDA ratios, at 6.19% and 9.98% respectively. This could present serious problems in the future if their revenues don’t continue to increase so they can pay off their debt. Another downside with these two stocks is their FFO multiple. Federal Realty is currently trading at 21.73x their current FFO, which is high compared to the industry average. Realty Income has a slightly lower multiple at 19.58x, which is still higher than Kimco’s. Neither Federal Realty nor Realty Income are value plays. Federal Realty has a dividend of 3.45% and a payout of 202.94%, which is worrisome for investors looking to collect dividends. Realty Income has a slightly more attractive dividend yield at 4.2%, but that is still lower than the industry average. Realty Income also has a very concerning dividend payout ratio of 302.66%.
Self Made
Company-Specific Risks
There are many risks associated with buying a REIT stock, and right now the current climate is crazier than ever. With interest rates being so low REITs have been able to get an edge on borrowing capital to fund new investments, but as rates start to rise the cost of capital for REITs will also rise. This could present a certain risk for REIT investors, especially since many REITs get loans to fund their projects. Investors should be looking out for changes in interest rates, as it could cause the price of KIMCO and other stocks in the REIT sector to decline in price.
Another company-specific risk that presents itself is the recent Weingarten acquisition. Kimco has told investors that the acquisition will cause debt to increase, as well as incurred costs. As a result, the company could have a harder time paying off their debt and providing funds for future investments. Although the Weingarten portfolio is now fully integrated into Kimco’s portfolio, the merger could still present certain issues for investors and the company.
Kimco seems to be operating strongly as a company, but their valuation is slightly high which is concerning. Besides rising interest rates and the recent Weingarten acquisition, the only other risk affecting KIMCO would be their own performance. The most important thing for Kimco is to continue to pay off debt and decrease their current liabilities. I think that the only thing holding Kimco back is their valuation, and if their current liabilities increase it could cause a decline in revenues and the overall equity for the company.
Lastly, there are risks associated with the investment strategy. At any moment in time, the current climate could change causing the price of Kimco to decline. If the price declines, then holding the stock would mean a loss in capital gains for the investor. Conversely, if the investor holds the stock instead of purchasing more, they could have missed out on potential capital gains. The stock price could decline for many reasons, and I would warn investors to be weary of interest rates, Kimco’s debt and liabilities, and fluctuations in the geopolitical and economic situation of the country.
Conclusion
Kimco is a great mall operating REIT; however, their valuation is too high to justify purchasing the stock. Their dividend history, yield and payout are attractive, but the P/FFO multiple is too high to call it a buy. Q4 2021 results were promising, and the company’s operating performance was strong over the quarter and the past year. Kimco has a lot of competition in the REIT space, but pans near the top when put against their peers. Not every other stock is a better buy, but Simon Property Group seems like a more attractive investment despite the large amount of debt they are carrying. The average P/FFO of the REITs I compared were high, but Simon Property Group’s is surprisingly low. Based on my models and recent financial results, I give Kimco a Hold rating. The stock is valued too high despite strong operations and good dividend history. Investors should investigate the other stocks on the market if they want to invest in REITs, but if they already own the stock, they should hold it and rotate into buying other better-valued stocks.
Be the first to comment