

grandriver/E+ via Getty Images
Introduction and Overview
Kelt Exploration (OTC:KELTF) is a gas-weighted intermediate Canadian E&P with operations concentrated in the Grande Prairie and Peace River regions of Alberta.
In the assessment below we will deconstruct Kelt within two main contexts and prove that meaningful upside exists given Kelt’s operational performance and economic prowess.
- Operational Assessment: Kelt has been able to demonstrate above-average operational performance as demonstrated by its high production per well relative to peers, disciplined capital deployment, impressive production growth and meaningful reserve volumes.
- Economic Assessment: Kelt has posted both strong top and bottom-line numbers, remains severely undervalued both from an intrinsic value and trading multiples perspective, and is positioned to generate meaningful free cash flow in 2022.
Kelt is a strong Canadian gas operator, and a clear sector outperformer when compared to the other Canadian E&P. As a result, we have bullish outlook on Kelt given its strong free cash flow generation and future growth potential. As such we recommend a buy.
Macro Energy Backdrop
The current natural gas pricing (NG1:COM) environment continues to remain strong on the backdrop of the ongoing Russian-Ukraine conflict. North American natural gas supply-demand balance continues to remain tight and now demands a risk premium as countries shift their focus to energy security. Henry Hub pricing remains strong due to higher temperatures and increased demand for air conditioning, especially in the Gulf Coast, unchanging domestic supplies, and increasing LNG exports. Furthermore, Canadian natural gas underpinned by the AECO benchmark, also continues to remain strong trailing the increasing Henry Hub pricing. In light of the strong gas pricing backdrop, Kelt is well positioned to benefit and outperform the broader market.
Operational Assessment
Kelt is an intermediate upstream Canadian producer and will be compared against other comparable peers with production between 25,000 and 75,000 boe/d. Kelt is a gas-weighted producer with 63% of its production from natural gas, and the balance from natural gas liquids and light oil. Kelt is concentrated in the Grande Prairie and Peace River regions of Alberta, and we will focus our comparison to relative peers within these regions.
For context, the below table summarizes Kelt’s position across all assessed regions in the Western Canadian Sedimentary Basin. Note that values may not be exact as they include several underlying assumptions and simplifications.
Figure 1: Summary of Land Position and Production by Region (Source: XI technologies, geoSCOUT, generated and formatted by CER)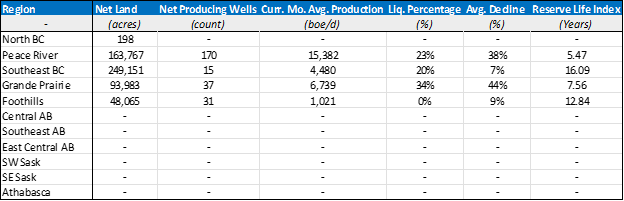
Figure 2: Summary of Land Position and Production by Region (Source: XI technologies, geoSCOUT, generated and formatted by CER)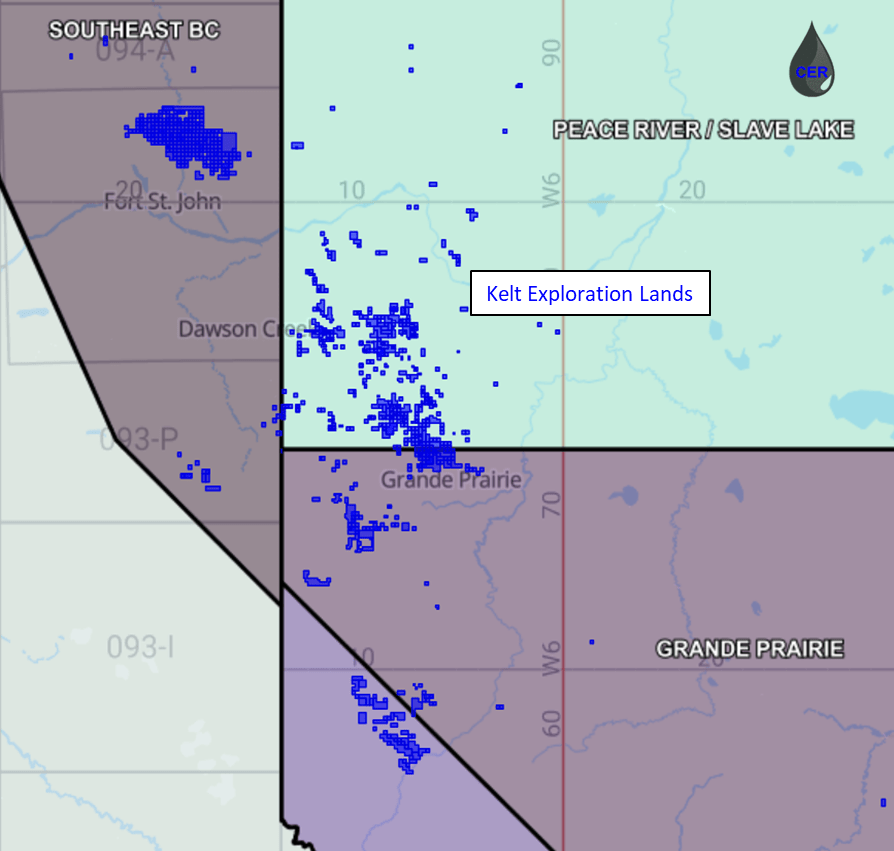
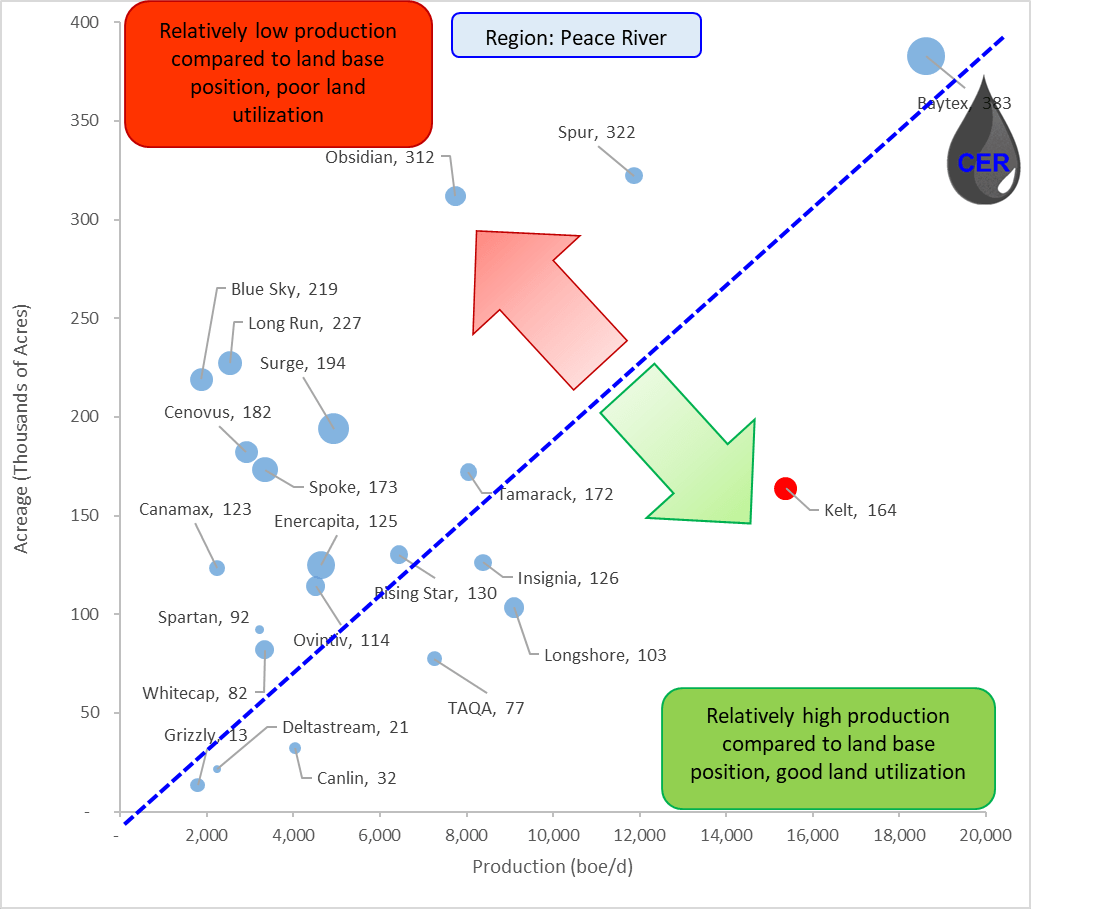
Acreage and Production
In both regions where it operates, Kelt is one of the most efficient operators when it comes to land utilization compared to other peers in the area with similar production in the WCSB and market capitalization. As illustrated by the plots below Kelt has relatively higher production per acreage of land owned, indicative of strong land management across the company. Also note, that Kelt is maintaining these production rates with a relatively lower total count of wells (illustrated by the bubble size in the plots below), further demonstrating effective capital deployment. This is especially notable for the Peace River region, where Kelt holds approximately half of its total production and demonstrates to be the clear industry leader when it comes to land utilization. As such supporting a bullish outlook.
Figure 3: Net Acreage (Y-Axis), Production (X-Axis) and Net Well Count (bubble size) by Operator (Source: XI technologies, geoSCOUT, generated and formatted by CER) Figure 4: Net Acreage (Y-Axis), Production (X-Axis) and Net Well Count (bubble size) by Operator (Source: XI technologies, geoSCOUT, generated and formatted by CER)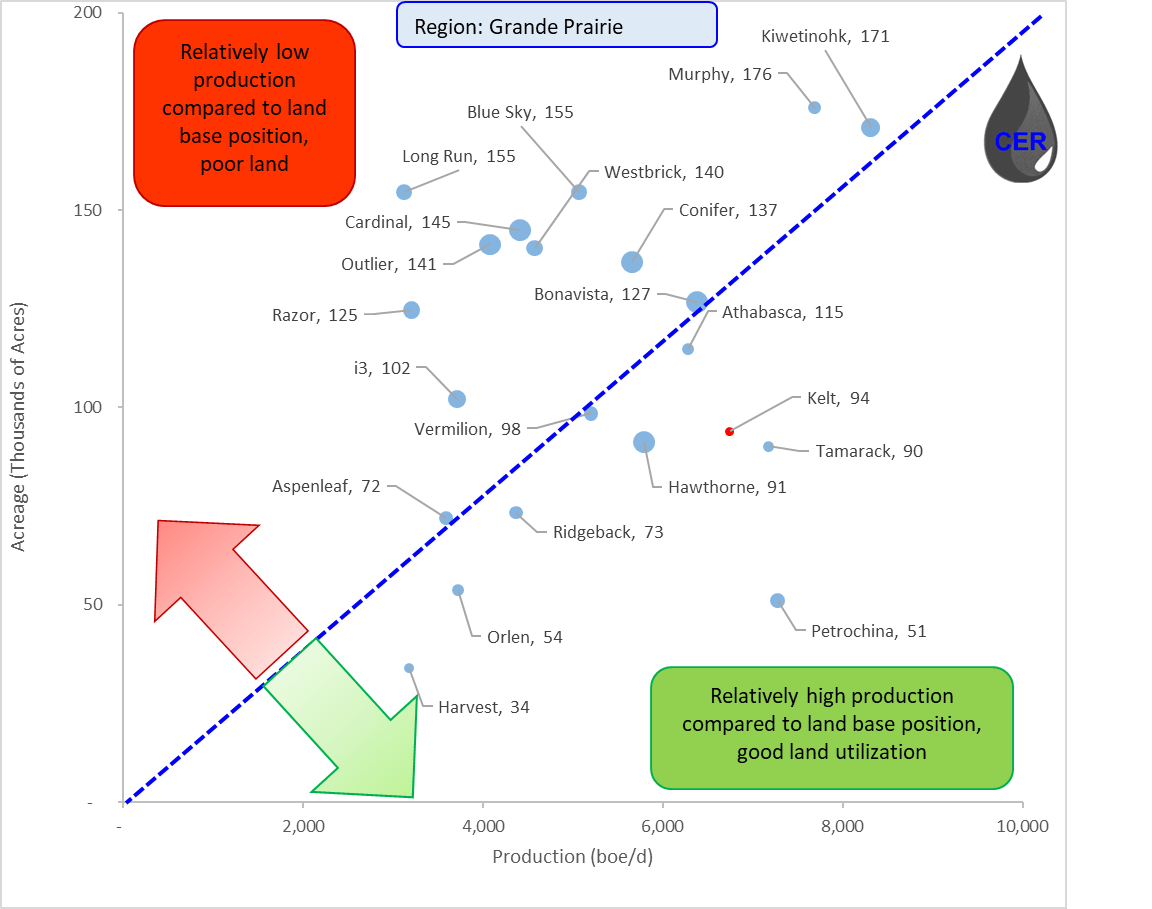
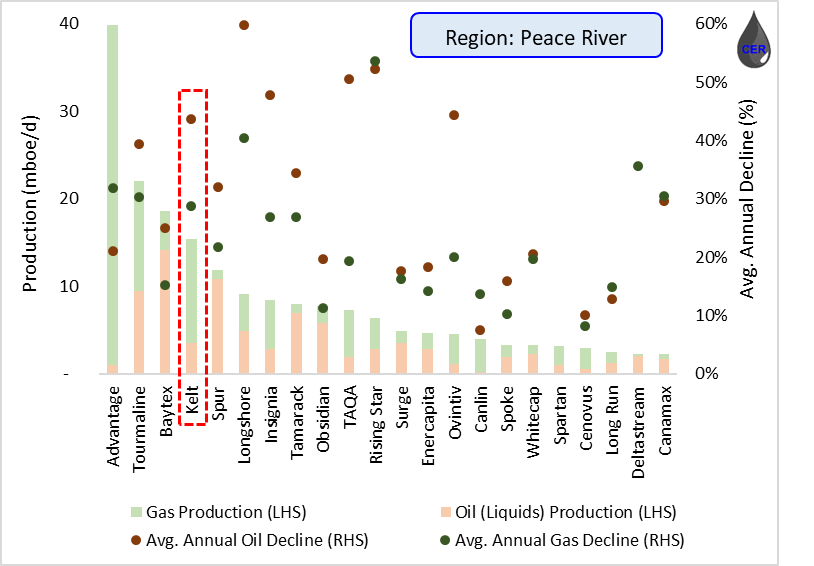
Production Decline and Drilling Activity
Kelt is subject to relatively high decline rates, as expected by a gas-weighted producer. At an average gas decline in the mid 30%, Kelt will have to continue to renew is production infrastructure every 2-3 years in order to maintain current production levels. This is a notable consideration, as Kelt’s future success is closely dependent on its successful exploration, drilling and completion activities in the area. This is especially important given that both labor and material pricing are accelerating in line with ballooning inflation.
This point supports management’s decision to increase 2022 capital expenditure program from C$250 million up to C$265 million (+6%). As disclosed by the latest MD&A, this increase reflects both an acceleration in select drilling activity as well as an adjustment to the remaining capital program to account for inflation of approximately 5%. This is notable as most peers have begun integrating inflation costs in the range of 15-25% in their 2022 outlook, compared to Kelt’s modest 5% outlook. Kelt management noted they have been able to largely mitigate inflationary pressures by securing contracts and stockpiling casing and tubing supplies, and the 5% increase is primarily attributed to increased labor service costs given the accelerated industry-wide drilling activity. This is notable, as a 5% inflation impact will translate to meaningfully higher profit margins compared to peers subject to 20-25% inflationary pressures.
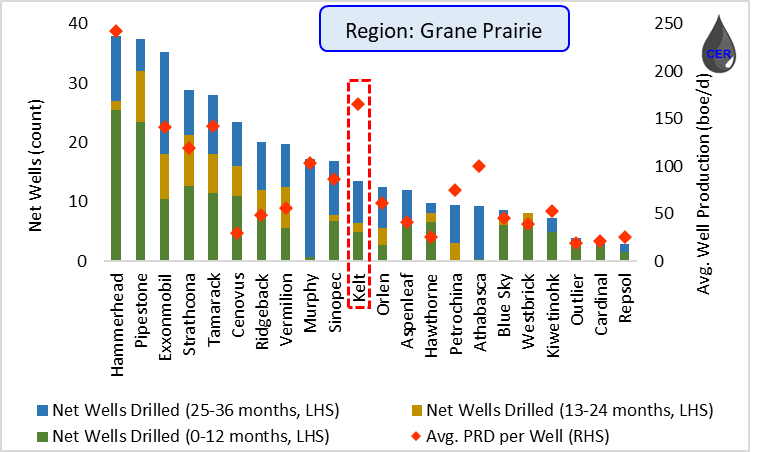
As illustrated by the plots below, Kelt has remained active in its drilling activity this year and aims to keep a stable drilling schedule with two rigs in order to offset inflationary pressures. During the first quarter, capital expenditures totalled C$84 million including C$53 million on drilling and completion and another C$30 million on new facilities, pipelines and equipment. During the quarter, Kelt brought two wells online in Pouce Coupe, two wells in Progress, and two wells from the Wembley areas. Furthermore, and as illustrated below, Kelt also demonstrates to have a higher-than-average production per well. Indicative of successful drilling and well stimulation activities in its core areas. This further supports a bullish outlook.
Figure 5: Production (LHS) and Average Annual Decline (RHS) by Operator (Source: XI technologies, geoSCOUT, generated and formatted by CER) Figure 6: Production (LHS) and Average Annual Decline (RHS) by Operator (Source: XI technologies, geoSCOUT, generated and formatted by CER) Figure 7: Net new drills (LHS) and Avg. Production (RHS) by Operator (Source: XI technologies, geoSCOUT, generated and formatted by CER) Figure 8: Net new drills (LHS) and Avg. Production (RHS) by Operator (Source: XI technologies, geoSCOUT, generated and formatted by CER)

Reserves
Kelt holds meaningful reserves, with company-wide PDP volumes at 43.8 MMboe at year end 2021 and an impressive +48% increase from year end 2020, 1P volumes at 134 MMboe and 2P at 254 MMboe. Kelt also maintains healthy inventory counts at 1,787 total unrisked locations of which 201 (11%) have been booked and included in the company’s Future Development Capital. As such, Kelt is well positioned to sustain an aggressive production growth profile while maintaining healthy reserve volumes and Reserve Life Index. Further supporting a bullish outlook.
Figure 9: PDP Reserves (left) and Reserve Life Index (RHS) by Operator (Source: XI technologies, geoSCOUT, generated and formatted by CER)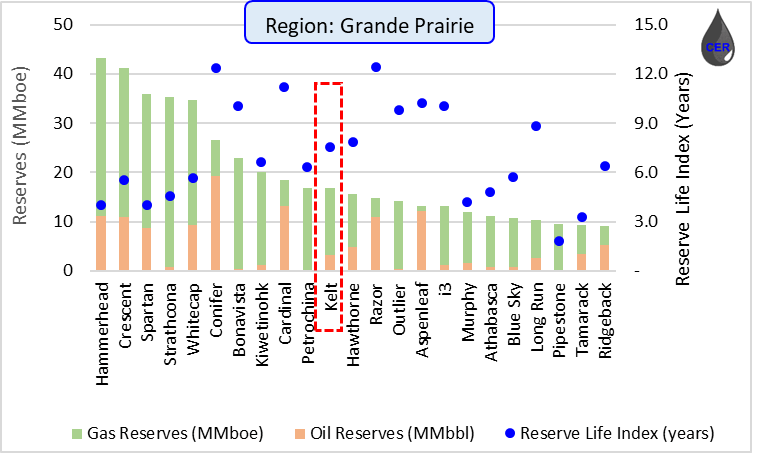
Figure 10: PDP Reserves (left) and Reserve Life Index (RHS) by Operator (Source: XI technologies, geoSCOUT, generated and formatted by CER)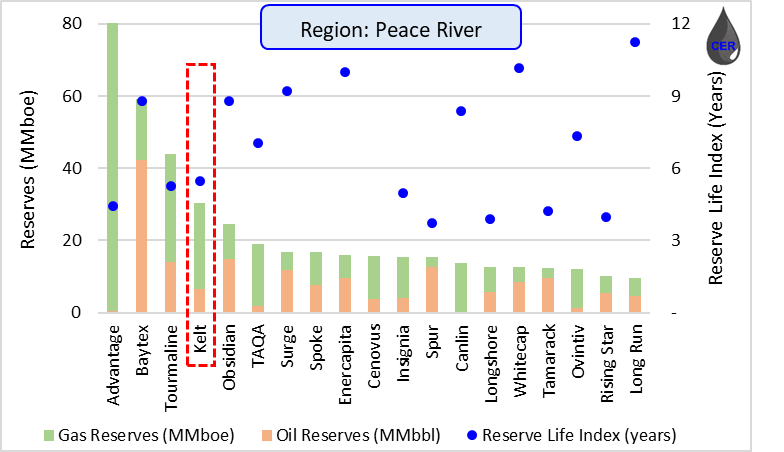
Economic Assessment
In the following five sections we consider Kelt’s latest earnings and breakdown its intrinsic valuation; starting with a commodity pricing outlook, production forecast, calculating field and corporate netbacks, and finally by discounting free cash flow back to present value.
Earnings
In Q1 2022 Kelt announced production volumes of 27,413 boe/d in-line with Wall Street estimates which drove AFFO of C$74 million or C$0.38 per share which was ahead of Wall Street estimates. Kelt also maintains a strong financial position, with C$35 million of net debt at the end of Q1 and is set to generate over ~C$150 million in FCF in 2022. With the long term goal of divesting assets in the future, and a strong balance sheet, any proceeds from a divesture is likely to be returned to shareholders through the form of a special dividend.
Pricing
Kelt’s production can be segregated into three main types: natural gas (63%), light oil (22%) and the balance as NGL. Overall, Kelt was able to sell its products at the relative benchmark pricing.
Figure 11: Commodity Price Outlook (source: McDaniels, generated and formatted by CER)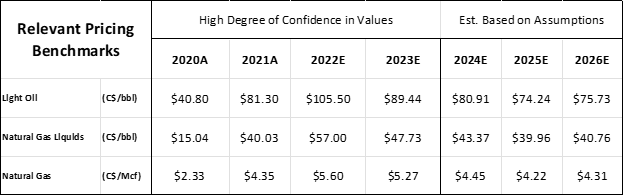
Production
Kelt’s management provided competitive guidance for 2022, and is on track for a meaningful (48%) production increase for 2022. To remain conservative we have reduced production growth meaningfully thereafter in our forecasts.
Figure 12: Production Outlook (source: 2022 Management Presentation, generated and formatted by CER)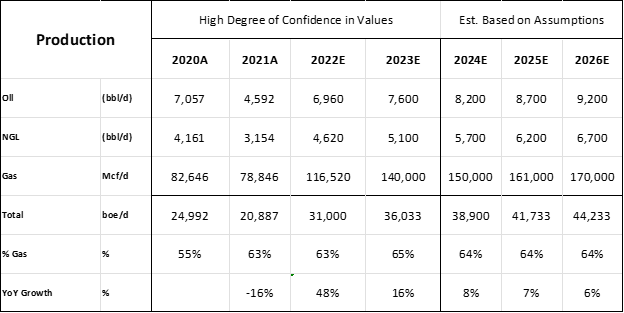
Netback
Given the current pricing environment, Kelt has incredibly strong netback. As with any oil and gas company, a major risk is a downturn in commodity prices. Kelt has partially mitigated this risk with physical sales to AECO, in addition to exposure to NYMEX Henry Hub through fixed price derivatives. Furthermore, albeit the relative higher (~C$4.20/boe) hedging costs this year, Kelt is on track to generate meaningful (~C$36.40/boe) netbacks at current prices.
Figure 13: Operational Netback (source: 2022 Management Presentation, generated and formatted by CER)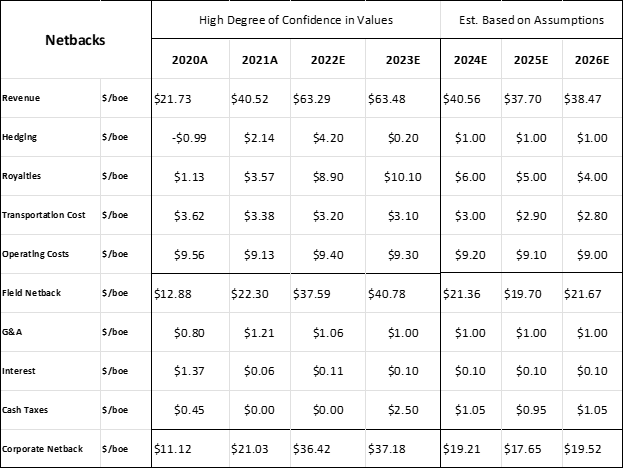
Cash Flow
Given the elevated gas prices, a consistently tight gas market and continually escalated geopolitical tensions Kelt is well positioned to outperform the overall market in the foreseeable future. Given its proven operational track record, drilling capital discipline and meaningful reserve inventory we believe a 10% long term discount rate is appropriate. As such, the present value of Kelt’s falls between C$8 and C$9 per share, implying only an impressive ~40% upside from the current pricing.
Figure 14: Free Cash Flow and Present Value (source: 2022 Management Presentation, generated and formatted by CER)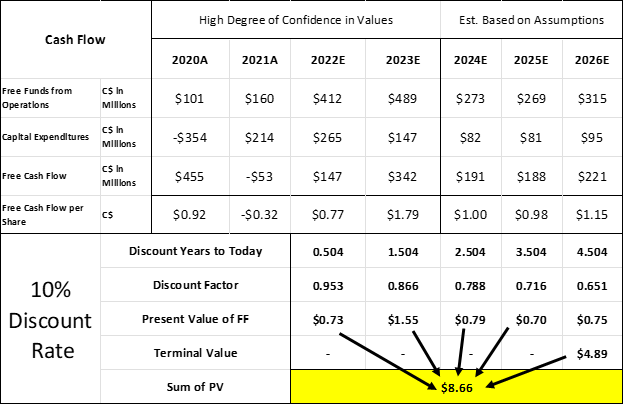
Comparables
Kelt also remains attractive across several trading multiple metrics compared to Canadian peers of comparable size, as illustrated by the summary table below. Given the implied intrinsic value upside and attractive trading multiple metrics, we believe Kelt exploration is a buy and we maintain a bullish outlook for the foreseeable future.
Figure 15: Trading Multiples of Various Comparable Peers (source: 2022 Management Presentations, generated and formatted by CER)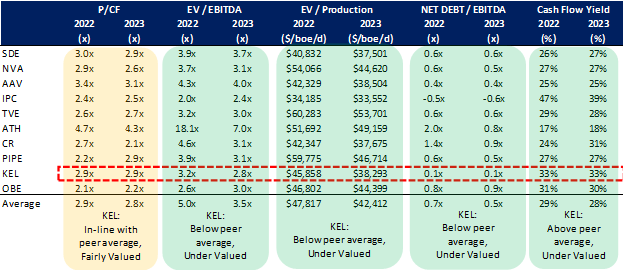
Conclusion
Kelt is a strong gas-weighted operator who is enjoying the high current gas pricing backdrop. Kelt has demonstrated superb land utilization in its core areas, strong capital discipline, and excellent drilling and completion activities resulting in above average production per well. Albeit not being immune to inflationary pressures, Kelt is well positioned to continue to grow production and maintain strong bottom line FCF generation. As far as intrinsic valuation, Kelt falls between C$8 and C$9 per share given current commodity, production and free cash flow outlook, implying an attractive 40% upside from the current valuation. Furthermore, Kelt continues to trade at attractive multiples relative to peers, and as such believe it is an excellent candidate for buy.
Be the first to comment