

vice_and_virtue
A guest post by Ovi
Below are a number of Crude plus Condensate (C + C) production charts, usually shortened to “oil”, for Non-OPEC countries. The charts are created from data provided by the EIA’s International Energy Statistics and are updated to July 2022. This is the latest and most detailed world oil production information available. Information from other sources such as OPEC, the STEO, and country-specific sites such as Russia, Brazil, Norway, and China is used to provide a short-term outlook for future output and direction for a few countries and the world. The US report has an expanded view beyond production by adding rig and frac charts.
Author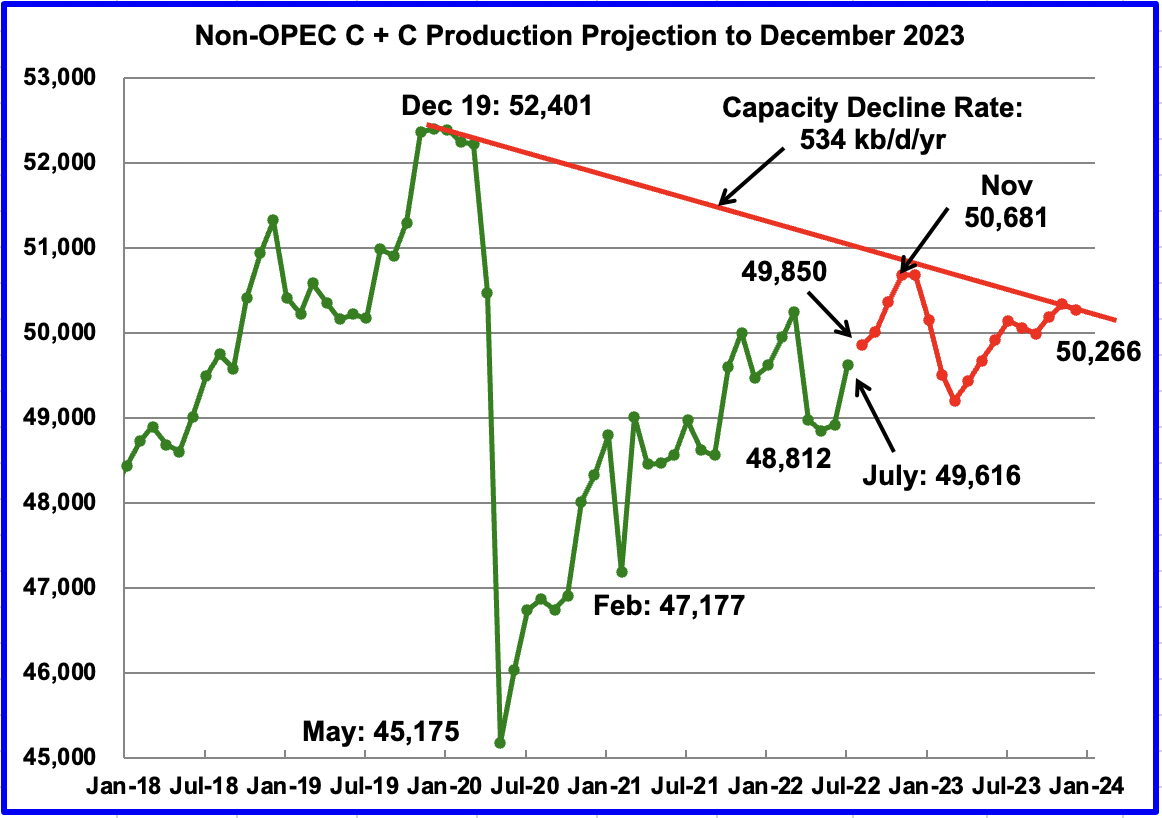
July Non-OPEC oil production increased by 697 kb/d to 49,616 kb/d. The largest increases came from Norway 311 kb/d, Kazakhstan 200 kb/d, and Canada 178 kb/d. The largest offsetting decrease came from China’s 153 kb/d.
Using data from the November 2022 STEO, a projection for Non-OPEC oil output was made for the time period August 2022 to December 2023. (Red graph). Output is expected to be 50,266 kb/d in December 2023.
Note that the November 2022 post-pandemic high of 50,681 kb/d is the high for all of 2022 and 2023.
The red capacity decline line represents a two-point average decline rate for Non-OPEC countries over the four years since December 2019 and is a combination of the natural decline rate plus a possible reduction in exploration and production investment.
Non-OPEC Oil Production Ranked by Country
Author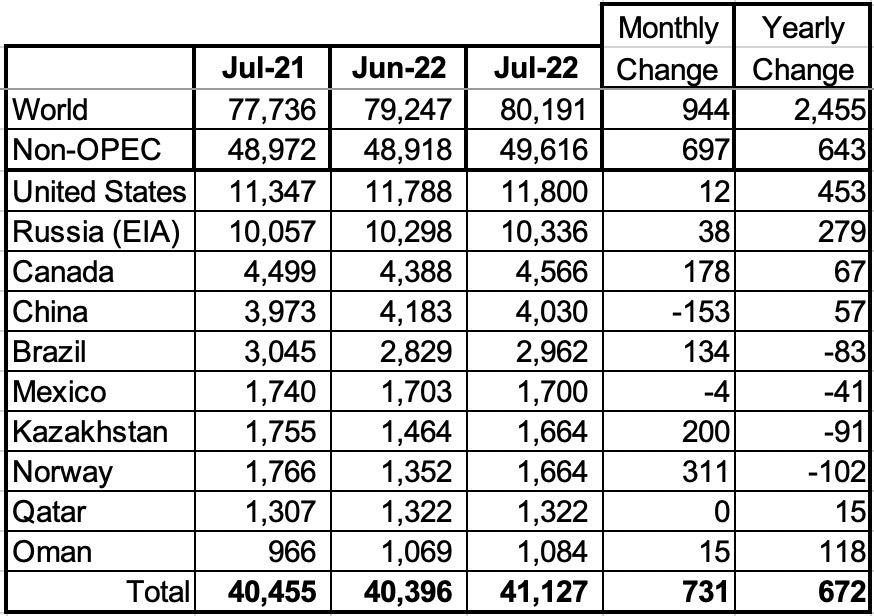
Listed above are the World’s 10th largest Non-OPEC producers. The criteria for inclusion in the table is that all of the countries produced more than 1,000 kb/d. Only China experienced a big loss in July. The July increase for all Non-OPEC countries was 697 kb/d.
In July 2022, these 10 countries produced 82.9% of the Non-OPEC oil. On a YoY basis, Non-OPEC production increased by 643 kb/d. World YoY July output increased by 2,455 kb/d.
Non-OPEC Production Charts
Author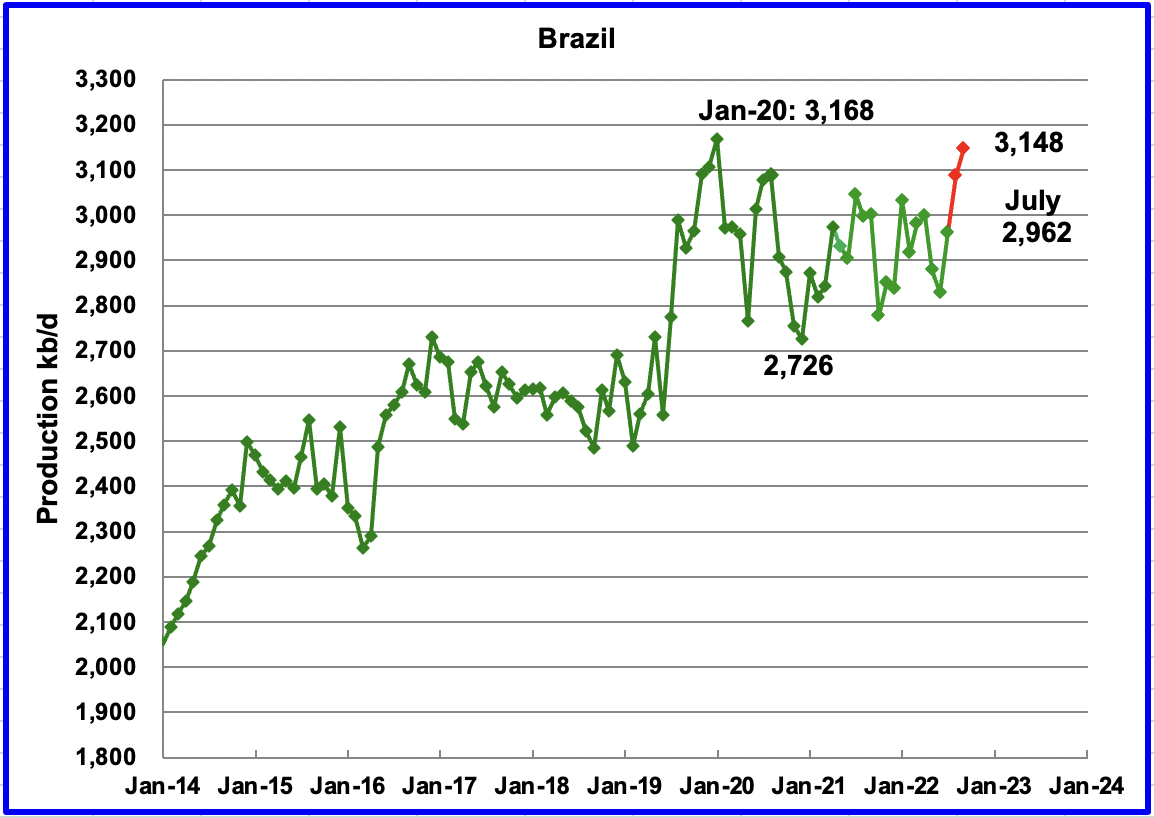
The EIA reported Brazil’s July production increased by 133 kb/d to 2,962 kb/d.
Brazil’s National Petroleum Association (BNPA) has resumed reporting Brazil’s monthly production. August’s output increased by 125 kb/d while September added an additional 61 kb/d to 3,148 kb/d. The overall increase from the June low was 319 kb/d.
According to OPEC: “Offshore maintenance eased slightly in July, allowing crude production to rise back above 2.9 mb/d for the first time since April.”
Author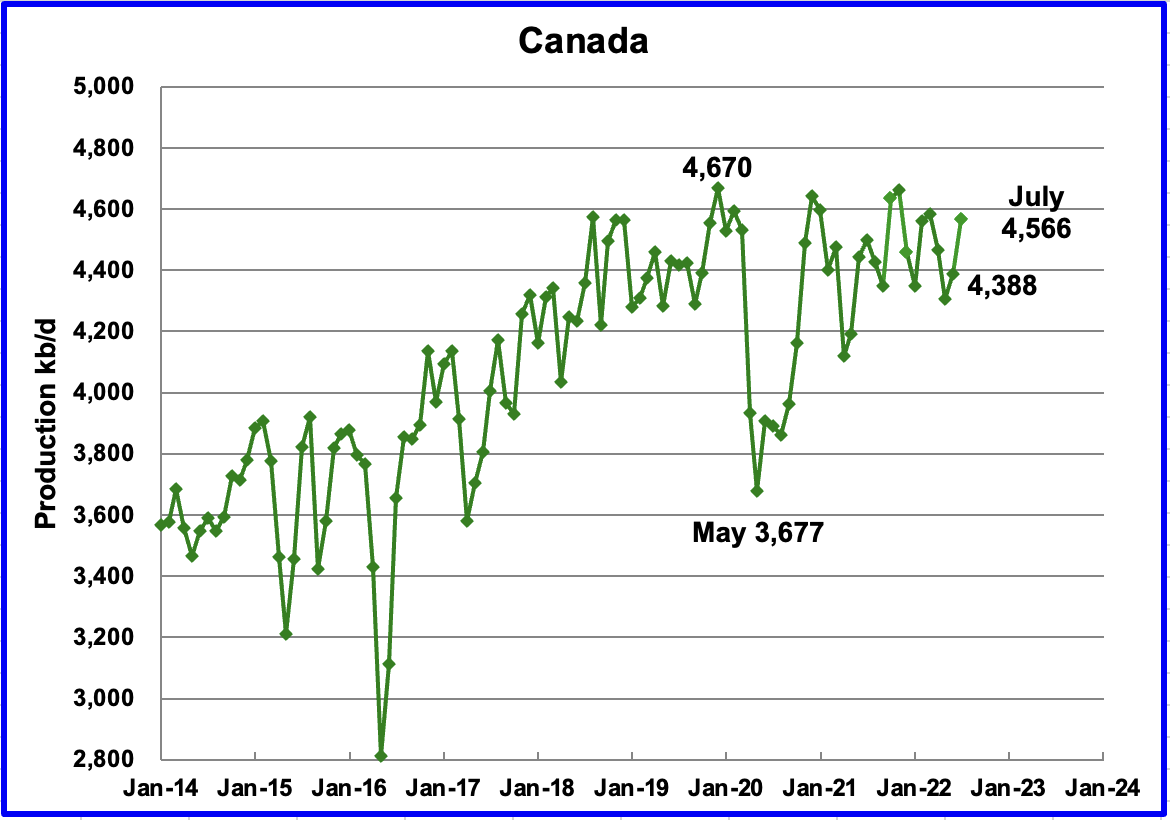
According to the EIA, Canada’s July output increased by 178 kb/d to 4,566 kb/d.
In the previous report, it was noted that preliminary data from the Canadian Energy Regulator (CER) indicated that July production was 4,802 kb/d. However since the EIA subtracts approximately 250 kb/d from the CER report, Canada’s projected July output was reduced and estimated to be close to 4,550 kb/d. The actual July output is 4,566, a difference of 16 kb/d.
Rail shipments to the US in August were essentially flat at 155 kb/d.
Author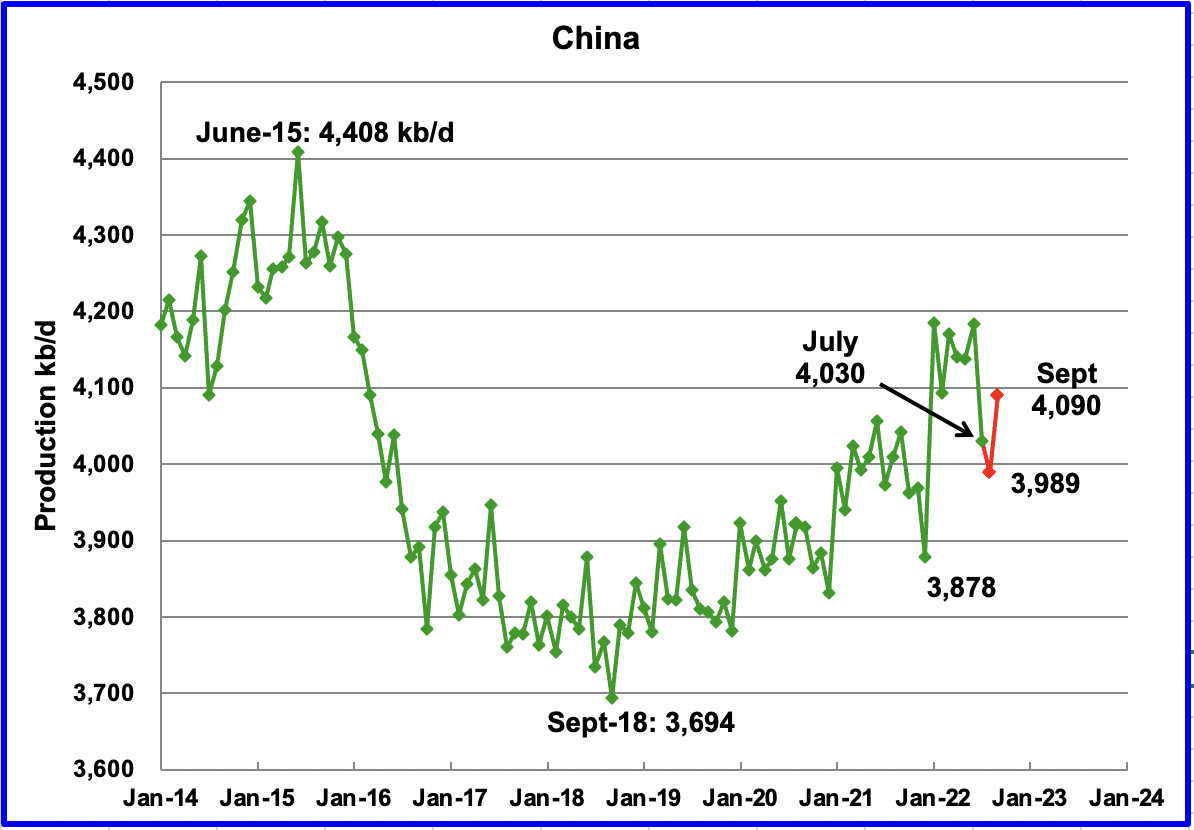
The EIA reported China’s output decreased by 153 kb/d to 4,030 kb/d in July.
China reported that its output decreased again in August to 3,989 kb/d, a drop of 45 kb/d. (Red markers). September added 101 kb/d.
China may be close to its current maximum production level of approximately 4,000 kb/d to 4,200 kb/d. To offset declines, the national oil company is investing in conventional wells and is also drilling for shale oil.
Author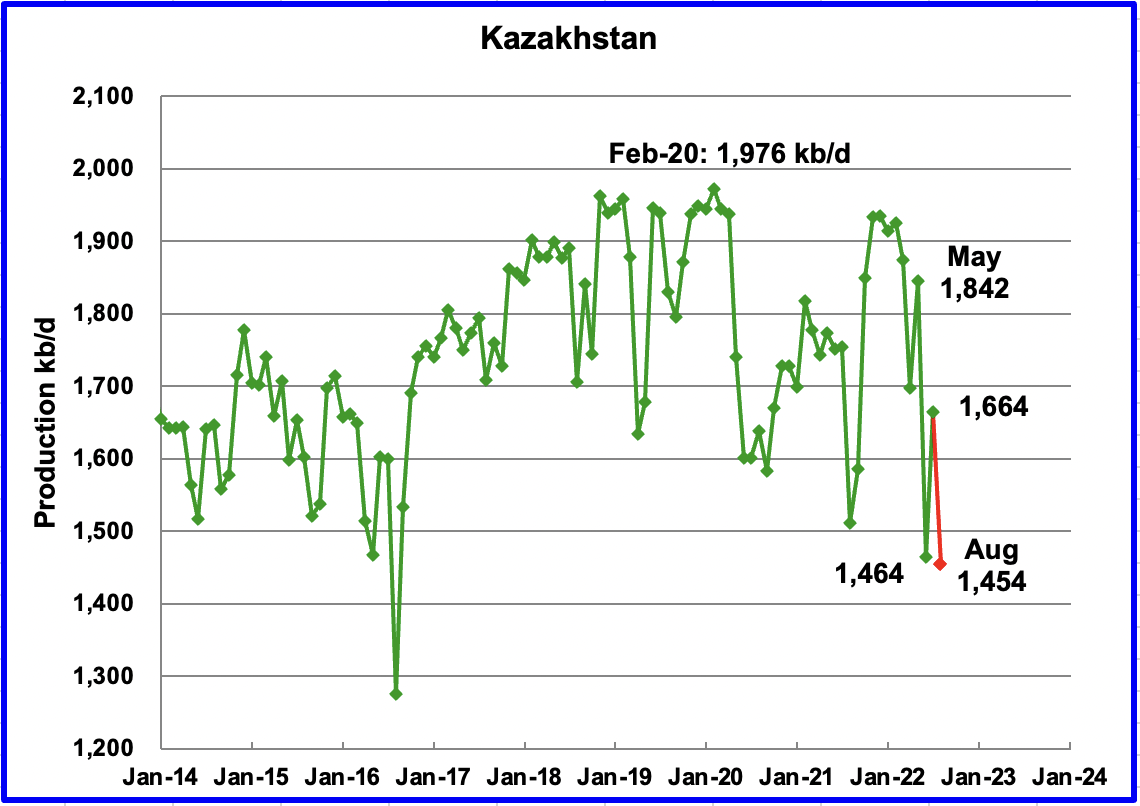
Kazakhstan’s output increased by 200 kb/d in July to 1,664 kb/d.
According to this source, August production fell to 1,454 kb/d. The article just reports crude oil production. Consequently, the August production number shown in the chart is an estimate based on the percentage drop and a typical C + C to C ratio using earlier EIA data.
“The fall in output was due to a sharp decline in production in the giant Kashagan oil field after a gas leak early in August, as well as planned output curbs in the Tengiz field due to regular maintenance.”
According to the this source, “production at Kashagan, one of the world’s largest oil fields, sharply declined on Aug. 3 due to a gas release. Kashagan had planned to boost output to 500,000 bpd after upgrades.”
Production is expected to recover in October.
Author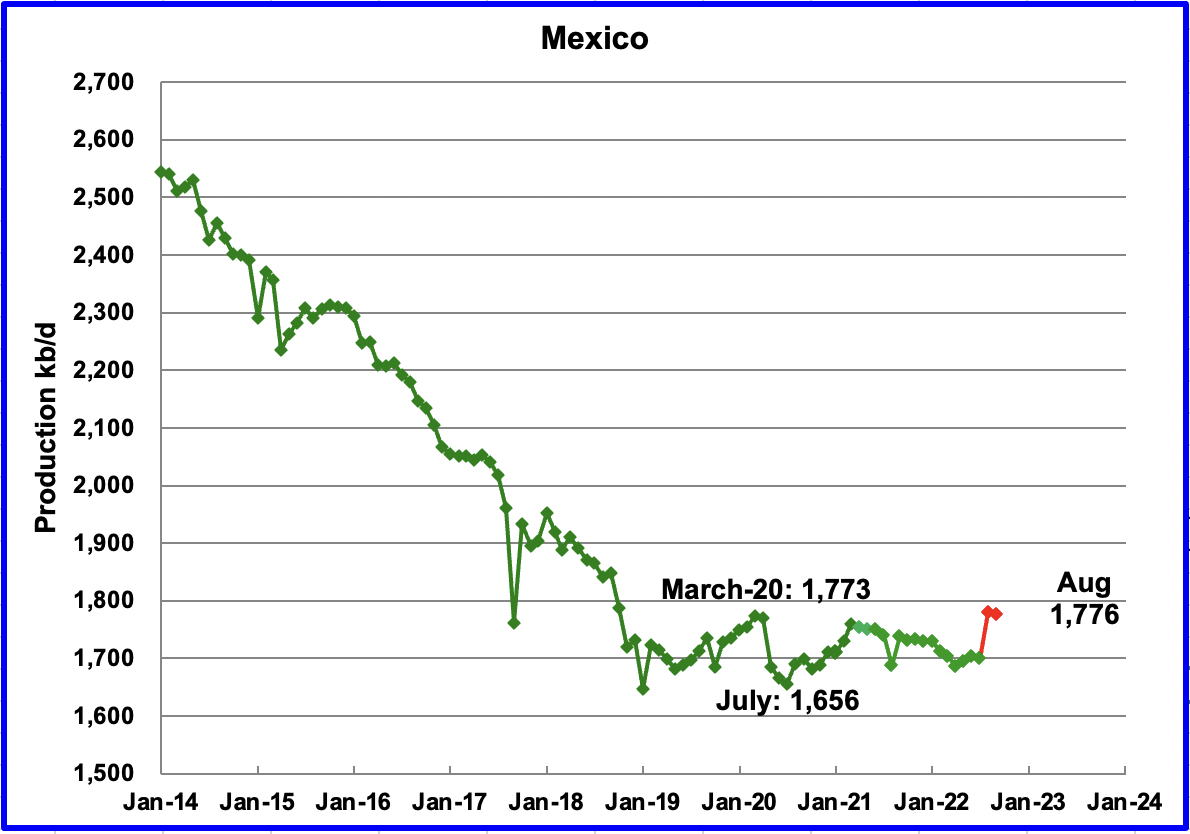
Mexico’s production as reported by the EIA for July decreased by 3 kb/d to 1,700 kb/d.
Data from Pemex showed that August’s output was 1,779 kb/d and September’s was 1776 kb/d. However, the EIA is expected to reduce Pemex’s August and September oil production by close to 85 to 90 kb/d due to a difference in the definition of condensate.
Author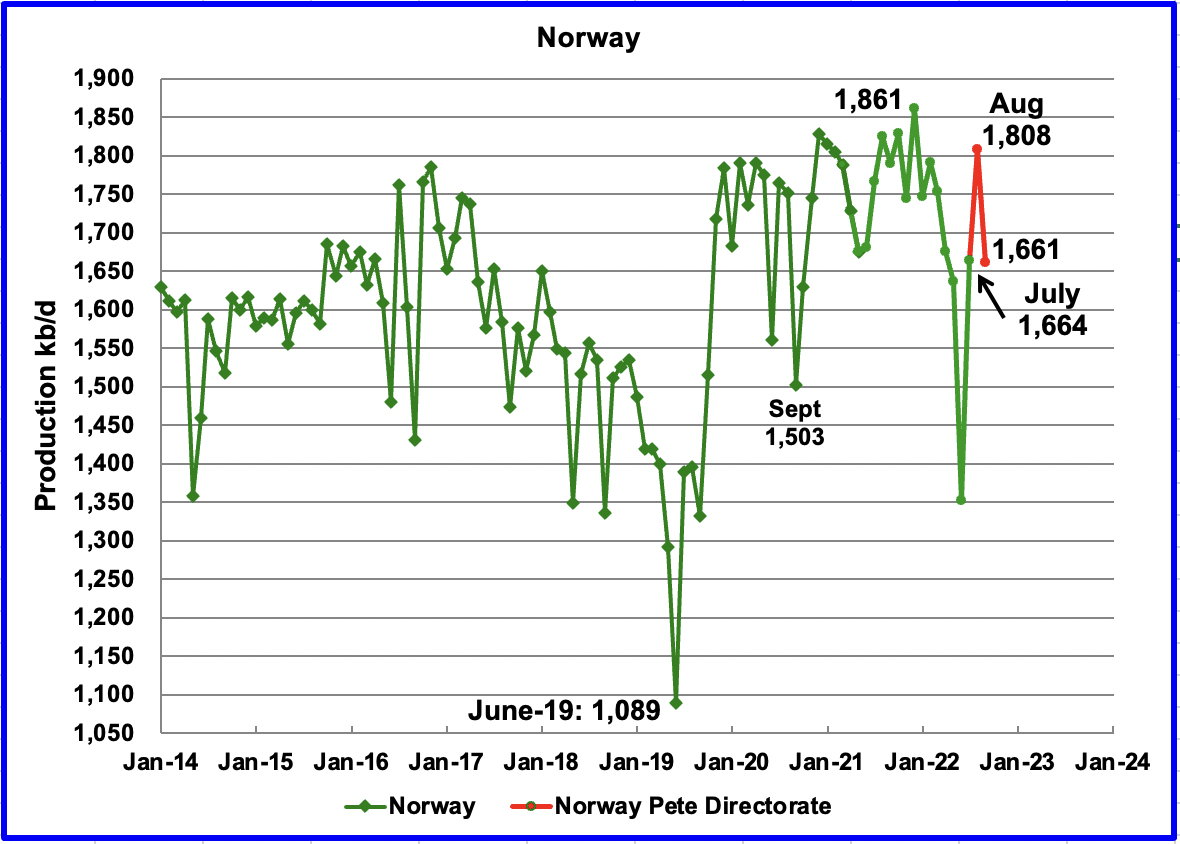
The EIA reported that Norway’s July production increased by 312 kb/d to 1,664 kb/d.
The Norway Petroleum Directorate (NPD) reported that production increased from July to August to 1,808 kb/d (Red markers). According to the NPD: “Oil production in August was 3.1 percent lower than the NPD’s forecast and 4.7 percent lower than the forecast so far this year.” September output dropped to 1,661 kb/d.
Growth is expected in late 2022 and into 2023 when the second phase of the Johan Sverdrup field development starts production and other small fields come online. According to OPEC “The Johan Sverdrup is projected to be the main source of increased output for the year. Neptune has also completed drilling at Fenja with the first oil on track for 1Q23. Fenja is expected to produce about 24 tb/d at peak production.”
Author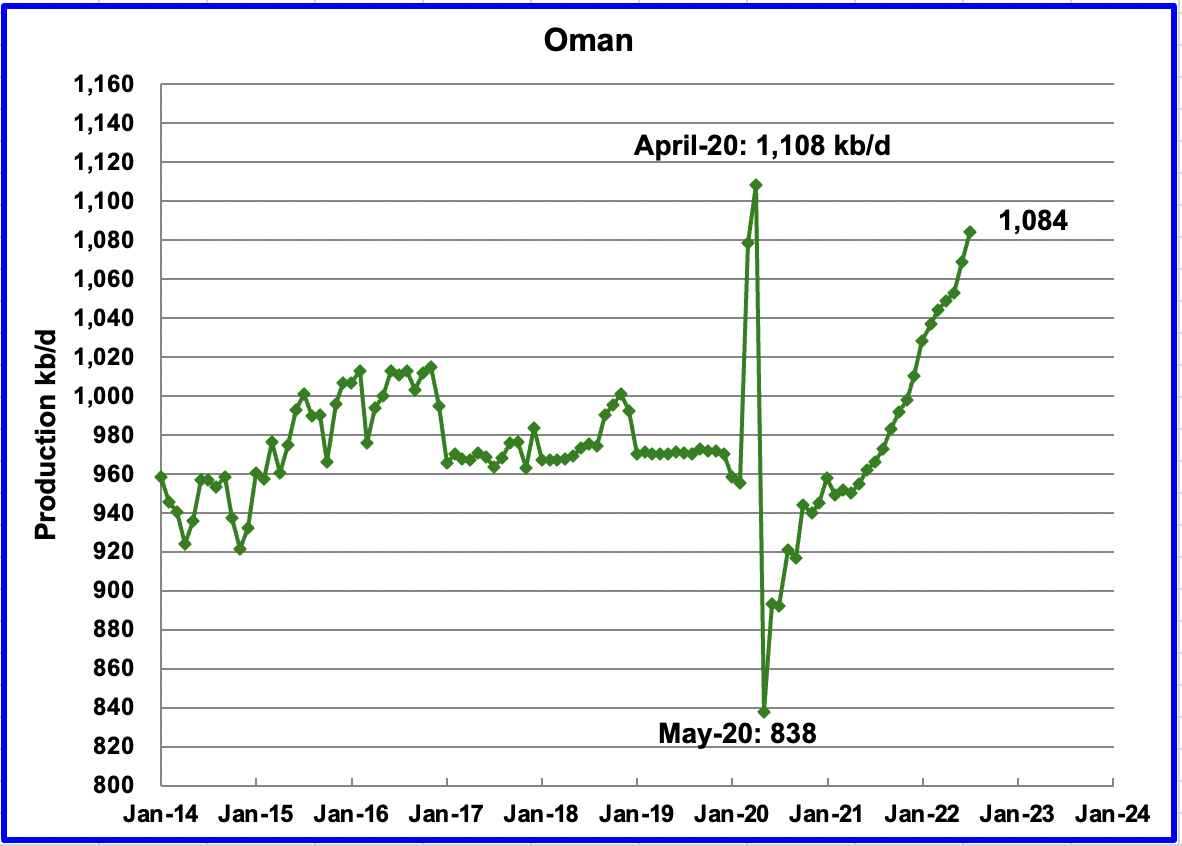
Oman’s production has risen very consistently since the low of May 2020. Oman’s July production increased by 15 kb/d to 1,084 kb/d. It is 24 kb/d short of its pre-pandemic high.
Author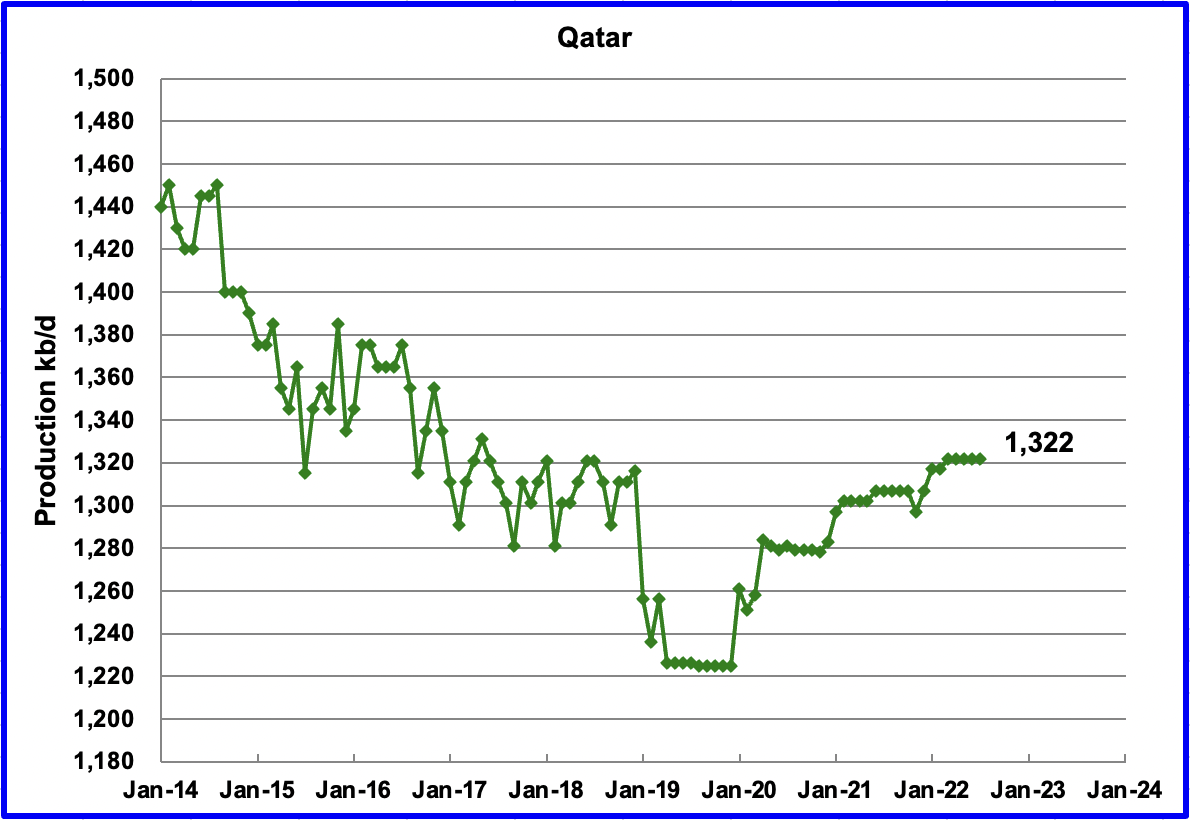
July’s output was unchanged at 1,322 kb/d.
Author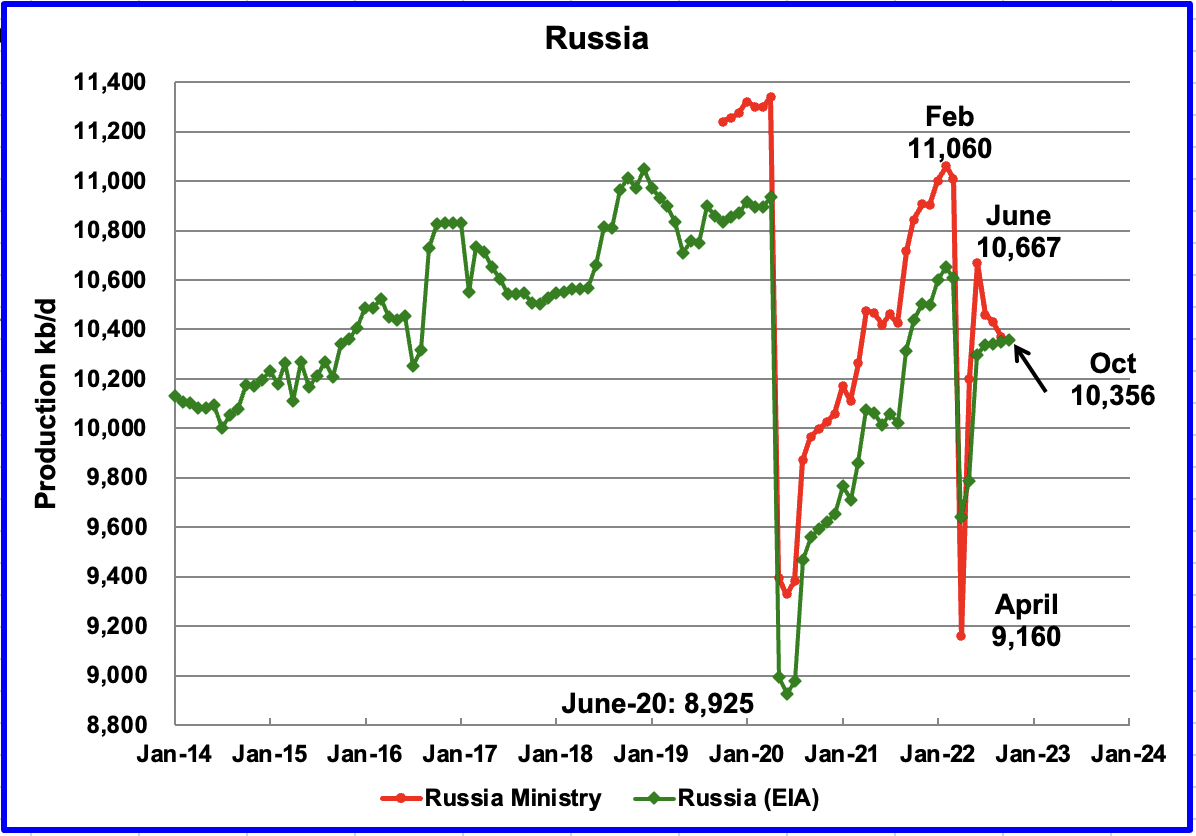
The EIA reported that Russian output increased by 38 kb/d in July to 10,336 kb/d.
According to this source, “Citing anonymous data, Kommersant said that Russia’s October oil production has been at 1.47 million tonnes of oil per day, which equates to 10.78 million barrels per day (bpd), down from September’s 10.8 million bpd reported by Russian statistics agency Rosstat last week.”
It is not clear if the above output is C + C or all liquids.
Another source provides a different perspective on the data provided above. According to this source:
MOSCOW – Russian oil production stood at 9.9 million barrels per day in October, Russian Deputy Prime Minister Alexander Novak said on Tuesday, according to Interfax news agency, well below the country’s quota within the OPEC+ deal.
That was in line with his previous forecast and production in September, but below Russia’s quota of 11 million bpd under the OPEC+ global accord.
The quota is set to fall to 10.5 million bpd from November, in accordance with the OPEC+ agreement.
The data excludes gas condensate, a type of light oil which usually accounts for some 8% of crude oil and gas condensate production.
Note that the reported data excludes gas condensate. If the missing 8%, as noted in the article, is added to the crude to account for the missing condensate, C + C would be 10,760 kb/d. This is very close to the previous source and makes it more likely that the previous output of 10,780 kb/d is really C + C, the Russian version. The EIA removes 404 kb/d from the Russian production numbers. So the EIA October estimate would be 10,356 kb/d, which is essentially the same as the July output shown in the chart. Note that the intermediate August and September numbers are linear interpolations.
Note that the red and green graphs are separated by 404 kb/d up to July 2022. When the EIA August Russian production is published, we will have a better idea if the earlier released Russian August data was all liquids, as previously assumed, or Russian C + C.
Author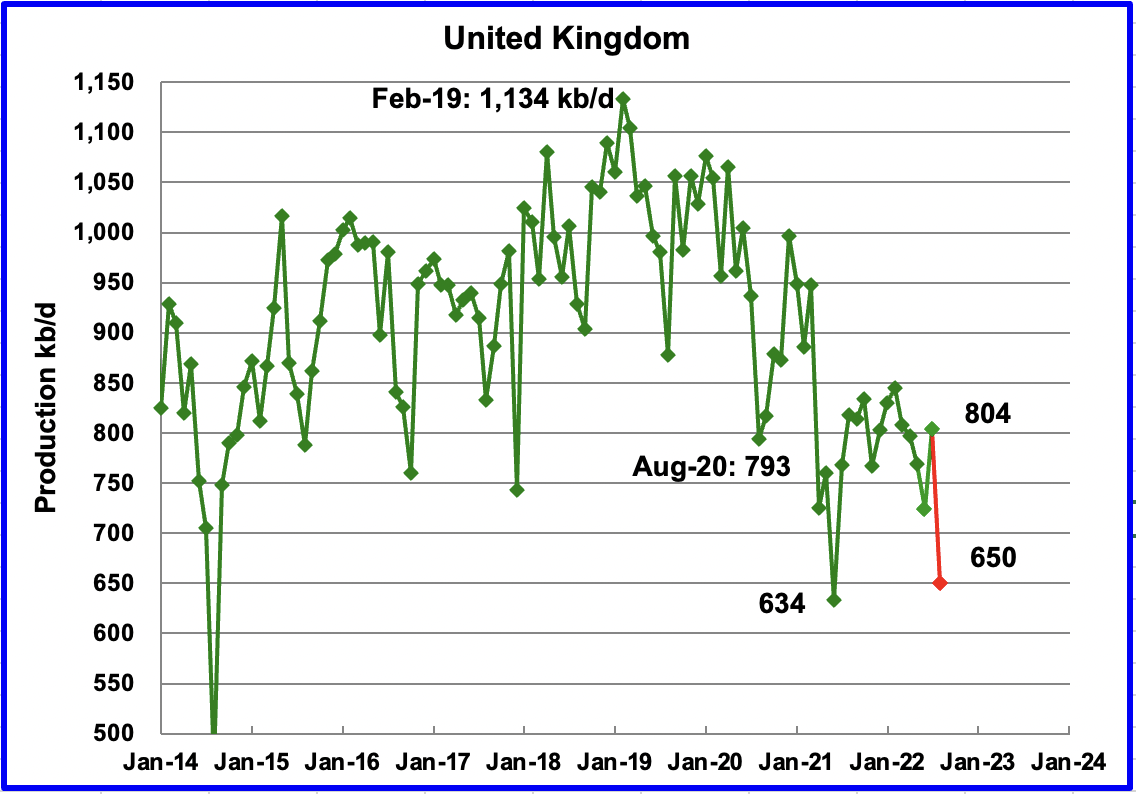
The EIA reported UK’s production increased by 80 kb/d in July to 804 kb/d. According to this source, August’s production decreased by close to 154 kb/d to 650 kb/d (Red Marker). Note that approximately 10% was added to the reported crude output to account for the missing condensate.
Author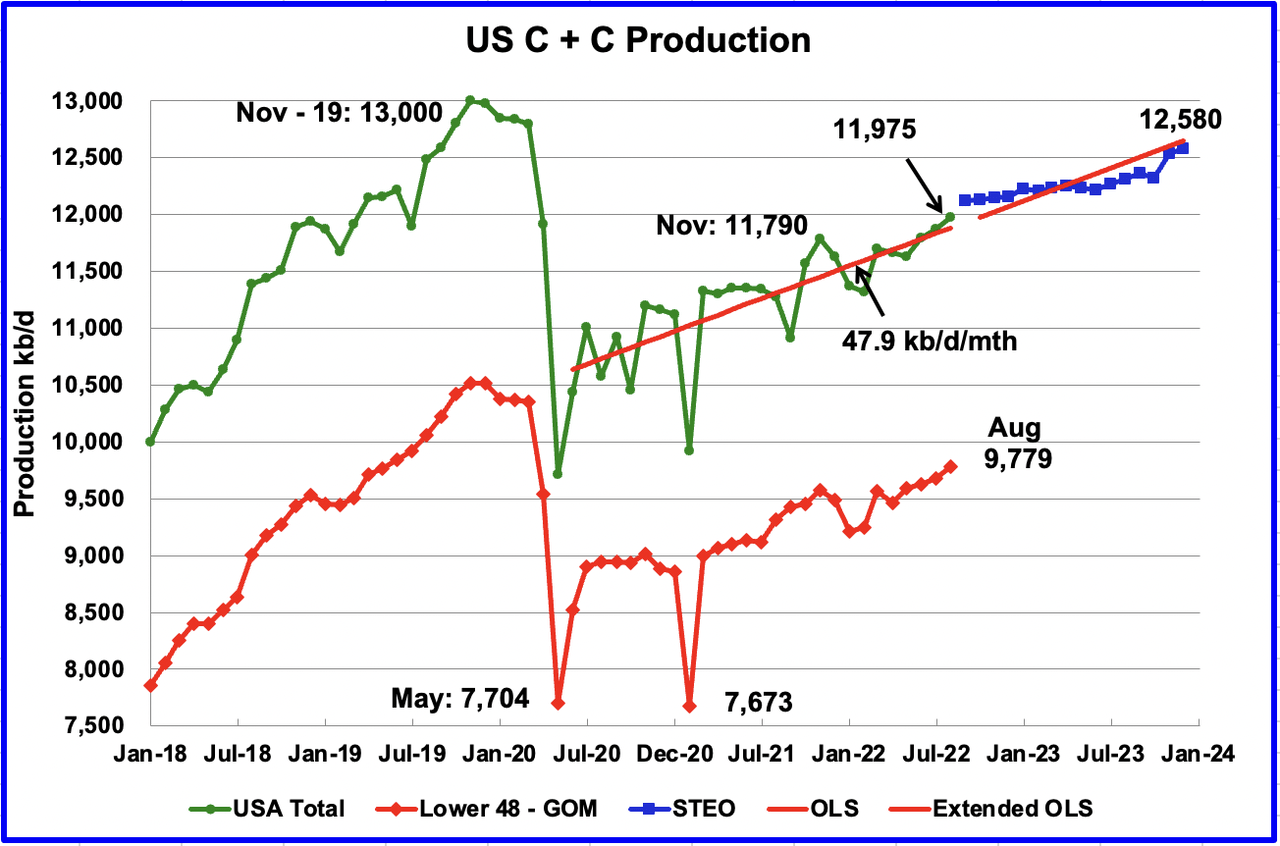
U.S. August production increased by 102 kb/d to 11,975 kb/d. While overall US oil production increased, a clearer indication of the health of US production can be gleaned by looking more closely at the Onshore L48 states. In the Onshore L48, August production increased by 100 kb/d to 9,779 kb/d. This means that all of the increase in US production came from the Onshore L48.
The blue graph, taken from the November 2022 STEO, is the production forecast for the U.S. from September 2022 to December 2023. Output for December 2023 is expected to be 12,580 kb/d, 21 kb/d lower than reported in the previous post.
The red OLS line from June 2020 to August 2022 indicates a monthly production increase of 47.9 kb/d/mth over that period. The first portion of the red line stops at August because that is the range covered by the OLS analysis. The second portion is the same OLS line extended to see how well it fits the STEO forecast.
Author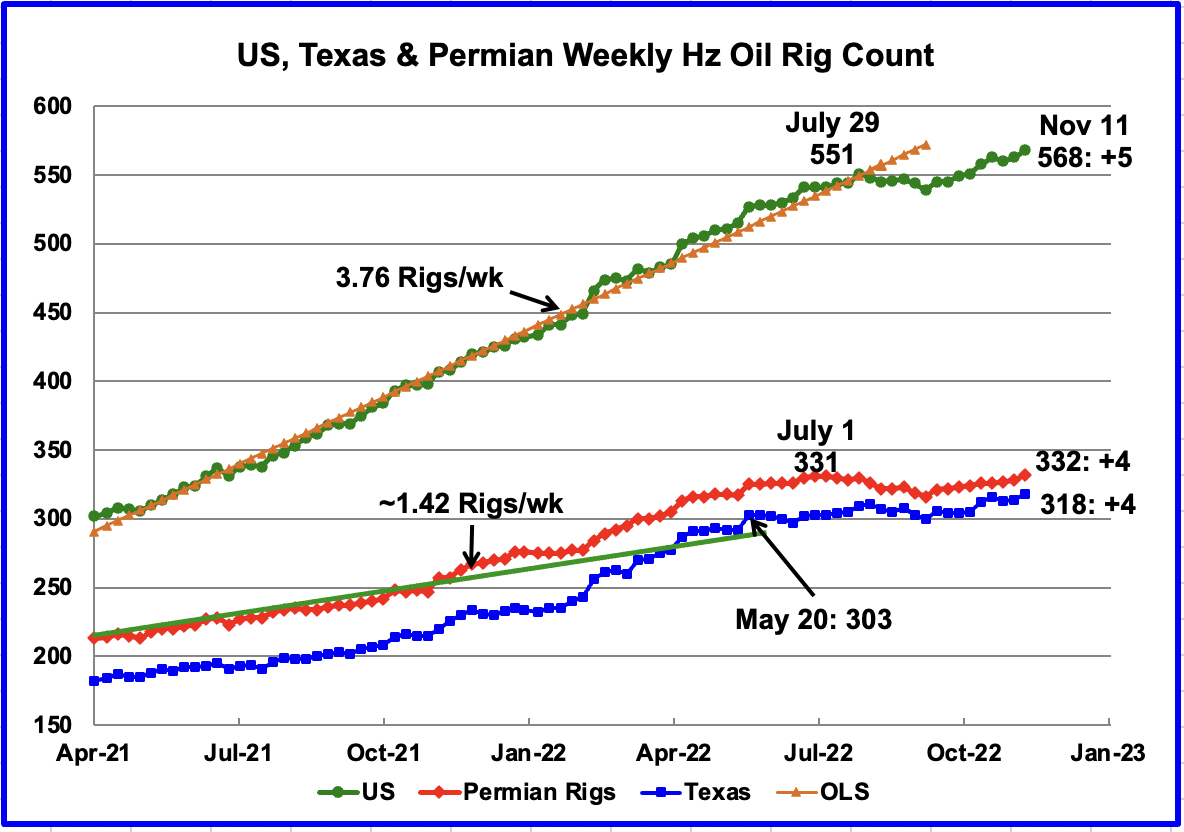
After the week ending July 29, the rate of rig additions slowed and dropped for eight weeks. However, since the low of 539 in the week of September 9, rig growth has returned. From the week ending September 9 to November 11, 29 rigs have been added for an average rate of 3.2 rigs per week.
In the week ending November 11, total Hz rigs increased by five, with 4 going to the Texas Permian.
New Mexico rigs have been steady at 97 for the last three weeks and are down from 105 in July. Is this an indication that drilling interest is shifting back to the Texas Permian?
Author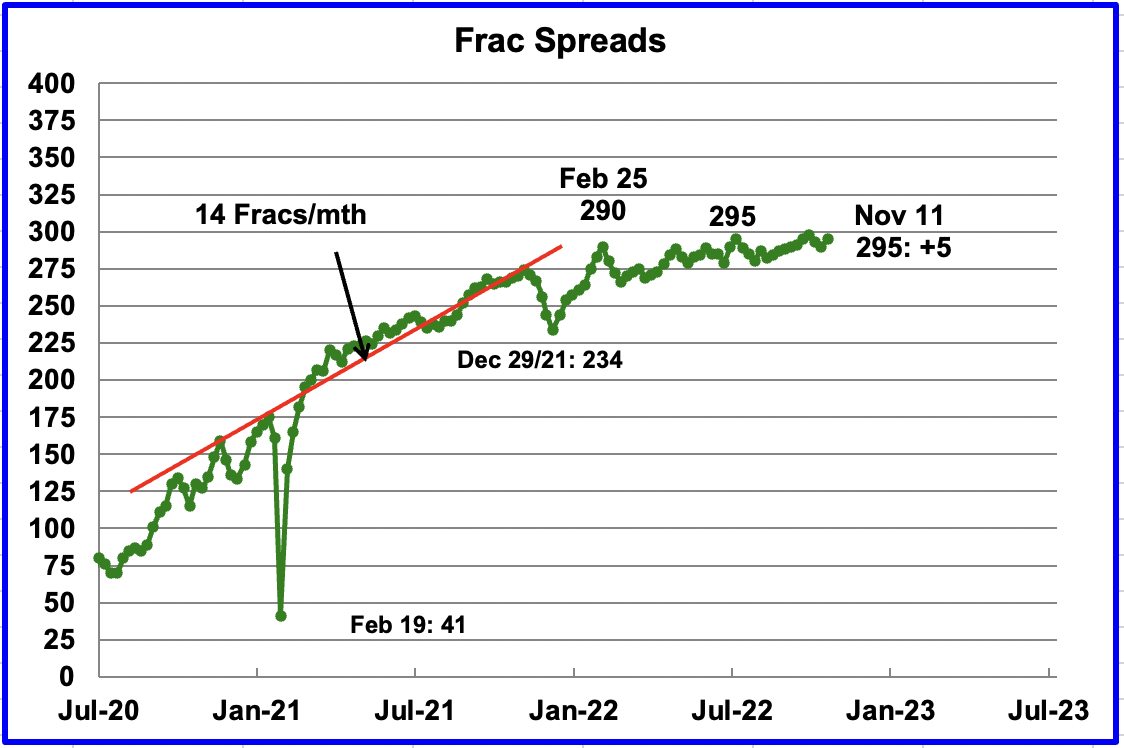
For frac spreads, the general trend since late February, when the count was 290, can best be described as essentially flat at around the 290 level. For the week ending November 11, the frac spread count increased by 5 to 295.
Last year, the frac count peaked in mid-November and then headed into the Thanksgiving and Christmas break the low of 234 in December 2021. So is this week’s count the beginning of another drop into December?
Note that these 295 frac spreads include both gas and oil spreads.
Author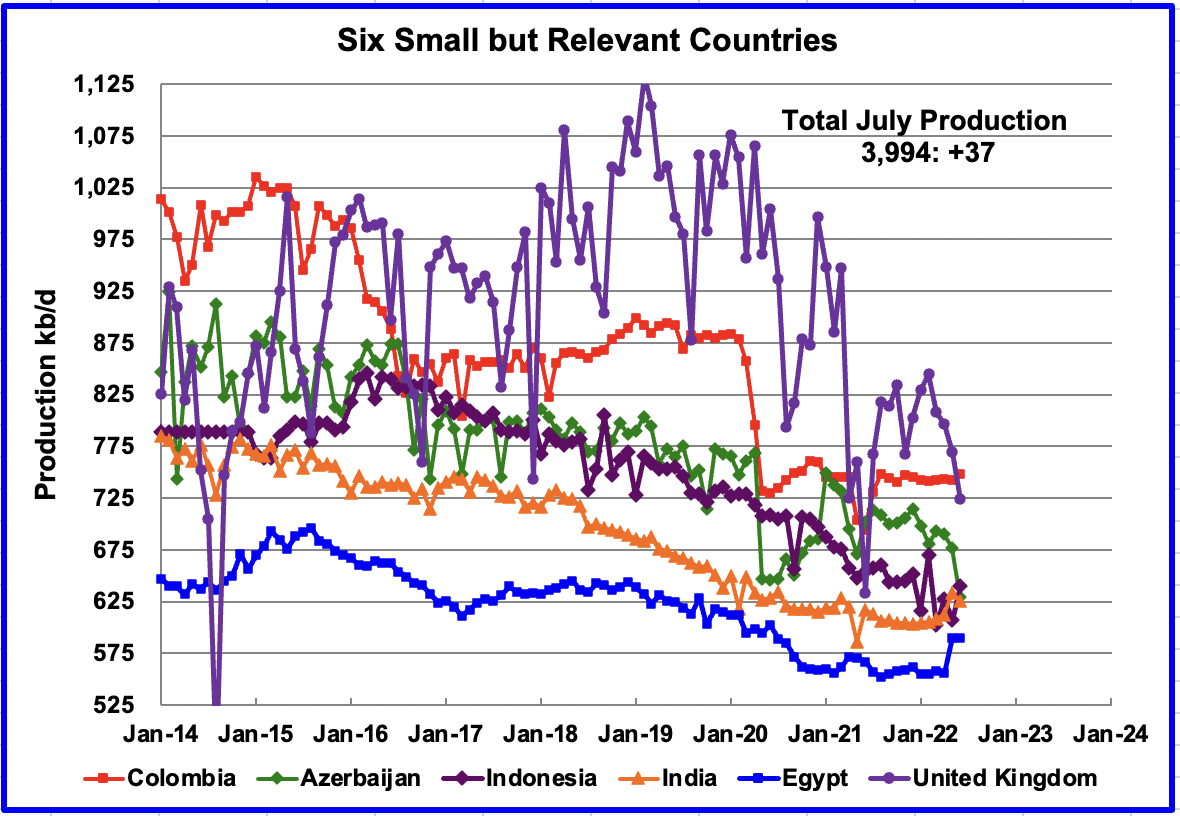
These six countries complete the list of Non-OPEC countries with annual production between 500 kb/d and 1,000 kb/d. Note that the UK has been added to this list since its production has been below 1,000 kb/d since 2020.
Their combined July production was 3,994 kb/d, up 37 kb/d from June’s 3,957 kb/d.
Author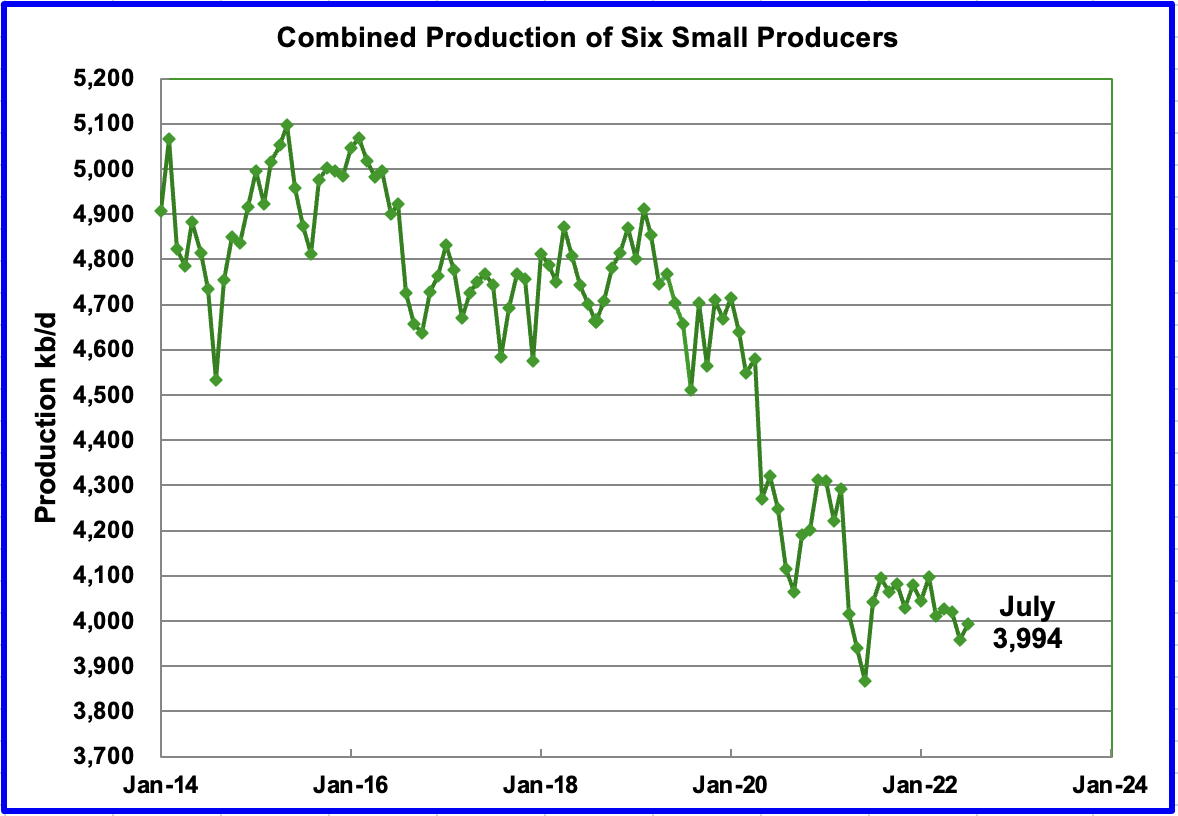
The overall output from the above six countries has been in a slow steady decline since 2014 and the decline continues.
World Oil Production Ranked by Country
Author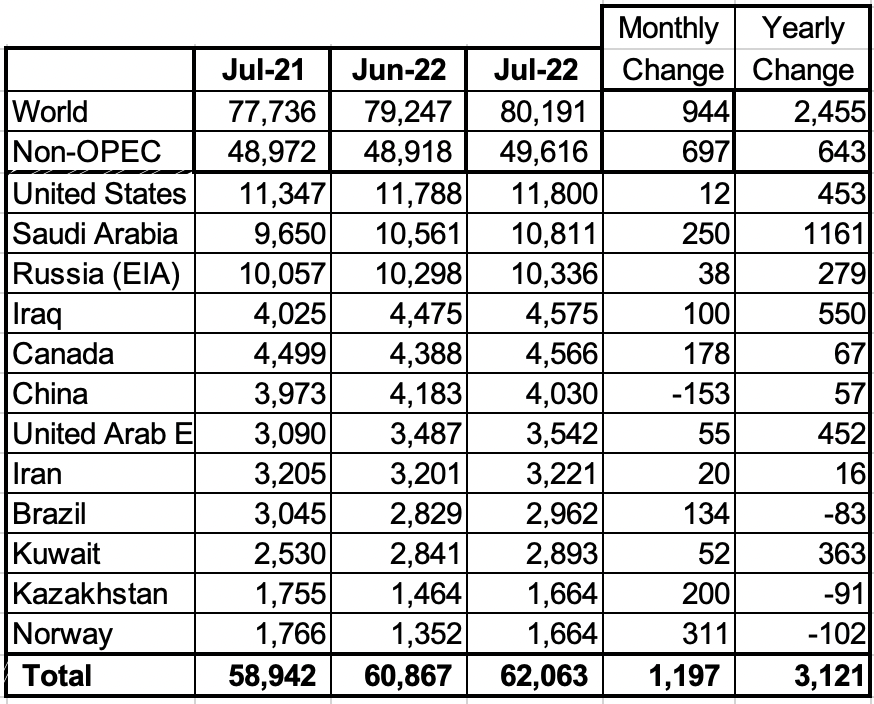
Above are listed the World’s 12th largest oil producers. The list has been expanded by one this month because Norway and Kazakhstan are tied.
In July 2022, these 12 countries produced 77.4% of the world’s oil. On a YoY basis, production from these 12 countries increased by 3,121 kb/d. Note that every country except China increases production in July.
The three largest increases came from Norway’s 311 kb/d. Saudi Arabia 250 kb/d and Kazakhstan 200 kb/d. Both Norway and Kazakhstan were recovering from maintenance.
World Oil Production Projection
Author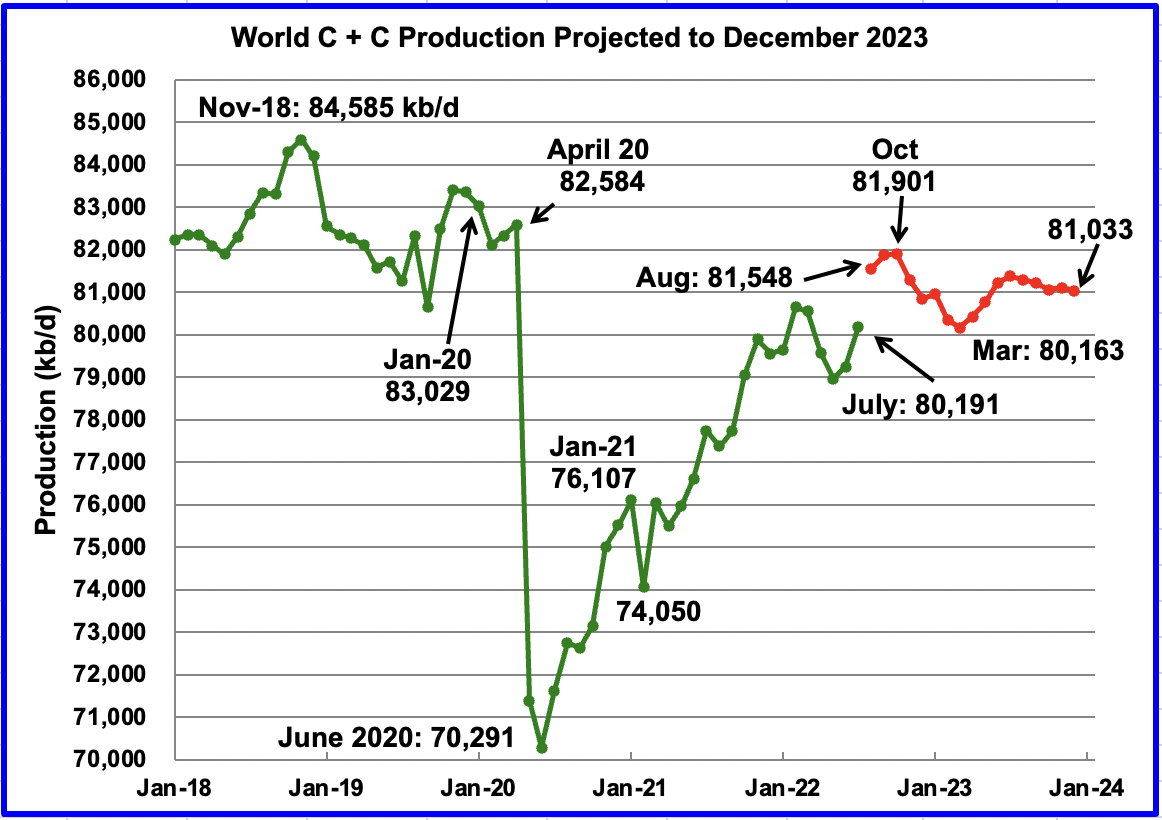
World oil production in July increased by 944 kb/d to 80,191 kb/d according to the EIA (Green graph).
This chart also projects World C + C production out to December 2023. It uses the November 2022 STEO report along with the International Energy Statistics to make the projection. (Red markers).
It projects that World crude production in December 2023 will be 81,033 kb/d, an increase of 207 kb/d from the projection in the October report.
August production is expected to increase by 1,357 kb/d to 81,548 kb/d. A post-pandemic peak of 81,901 kb/d will be reached somewhere in September/October 2022. After October 2022, World production decreases, and October 2022 will be the new post-pandemic high out to December 2023.
Note that the post-pandemic peak of 81,901 kb/d is 2,684 kb/d lower than in November 2018.
Editor’s Note: The summary bullets for this article were chosen by Seeking Alpha editors.
Be the first to comment