

Vertigo3d
Written by Nick Ackerman, co-produced by Stanford Chemist
Real estate is in the bottom half of performance in what has been a challenging year. The sector, as measured by the SPDR Real Estate ETF (XLRE), is off around 14.5% on a YTD basis.
Sector Performance (August 1st, 2022) (Seeking Alpha)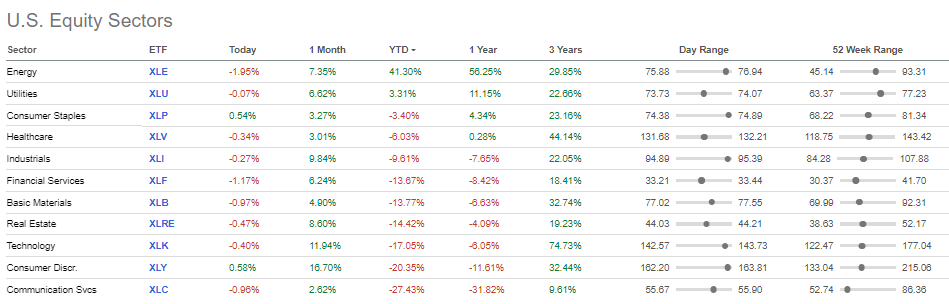
Nuveen Real Estate Income Fund (NYSE:JRS) is off even more. The downside here is more compounded due to leverage, which they run a rather high rate of leverage. Additionally, with a tilt towards preferred issues, that has been no place to provide any defense. As rates are rising due to an aggressive Fed, fixed-rate preferred have been taking a hit – along with all the other fixed-income types of investments.
Buying when something is cheaper is often a good thing. JRS could be providing such an opportunity as the fund is also attractively discounted. Since our last update, it would look like now the price is also more depressed to go alongside that discount.
JRS Performance (Seeking Alpha)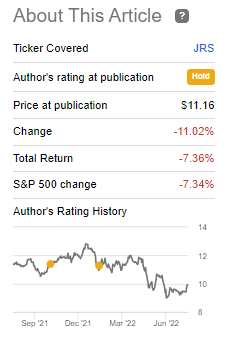
The results have shown that on a total return basis, the fund is down about the same as the S&P 500. That isn’t an appropriate benchmark for this REIT and preferred fund but does provide us some context of what is going on.
Despite these challenges, the fund interestingly bumped up its quarterly distribution since our last update, too.
The Basics
- 1-Year Z-score: -0.42
- Discount: 6.63%
- Distribution Yield: 8.45%
- Expense Ratio: 1.29%
- Leverage: 31.02%
- Managed Assets: $398 million
- Structure: Perpetual
JRS has an investment objective of “high current income and capital appreciation.” Their intention to achieve this is through investing “primarily in income-producing common stocks, preferred stocks, convertible preferred stocks and debt securities issued by real estate companies.” They also more specifically note that “at least 75% of the Fund’s managed assets will be in securities rated investment grade.”
The fund’s leverage has been creeping up. Unfortunately, it’s not because the fund is doing so well and adding more leverage. It is due to the declines since we last updated the fund. Previously, we were close to 27.4% leverage but are now seeing just over 31%. That’s as total managed assets declined from around $526 million to $398 million now.
In fact, it looks like they had to trim their borrowings from $144 million at the end of 2021 to $123.4 million. That could cause permanent damage due to not having the same amount of capital to rebound with when the market rebounds. As we saw through July, there was a strong rebound. That might not necessarily continue, but it already highlights the risk of a highly leveraged fund when they eventually have to cut back on its borrowings.
The other risk of their leverage is that it is based on 1-month LIBOR plus 0.61%. With higher interest rates, leverage expenses will be heading higher for this fund. This is partially offset by the interest rate swaps they have implemented. When including leverage expenses at this time, the total expense ratio comes to 1.68%.
Performance – Attractive Discount, But A Laggard To C&S
Deleveraging seems to be a fairly common characteristic of JRS and Nuveen equity funds. They just run too high of leverage in general. Of course, they are incentivized to do so as it means greater fees for them.
In the long run, it hasn’t served them or the shareholders well. Cohen & Steers REIT & Preferred Income (RNP), a fairly similar fund with a sizeable sleeve of preferred, has outperformed meaningfully over the last decade. That is actually with RNP having an even higher allocation to preferred. RNP has not appeared to have had to deleverage over the years, which seems to be due to the more moderate amounts of leverage being utilized.
Ycharts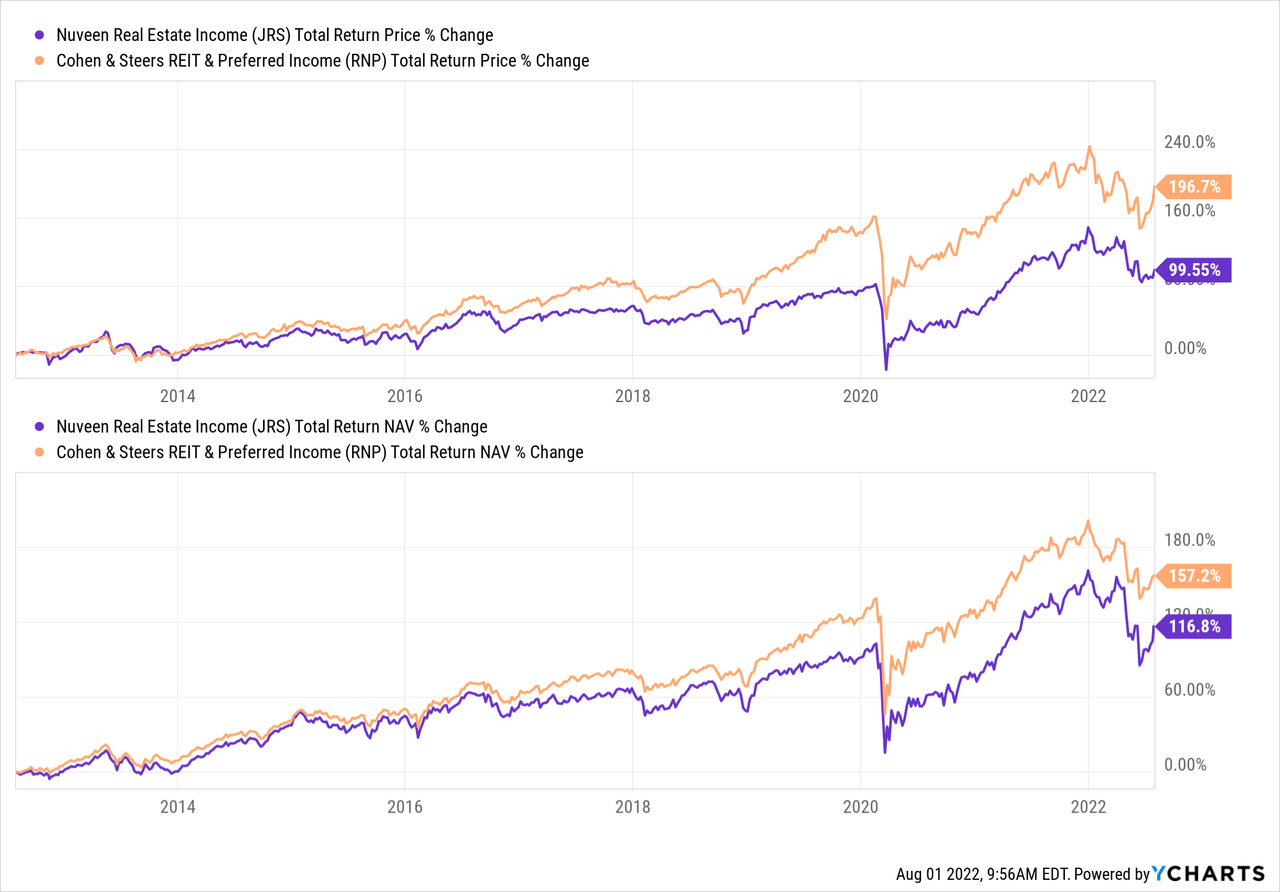
RNP outperforms in every standard timeframe except for the one year period. In that case, JRS has slightly outperformed. That was only a very recent trend shift, too, as JRS shot higher due to its top three holdings moving significantly higher.
Ycharts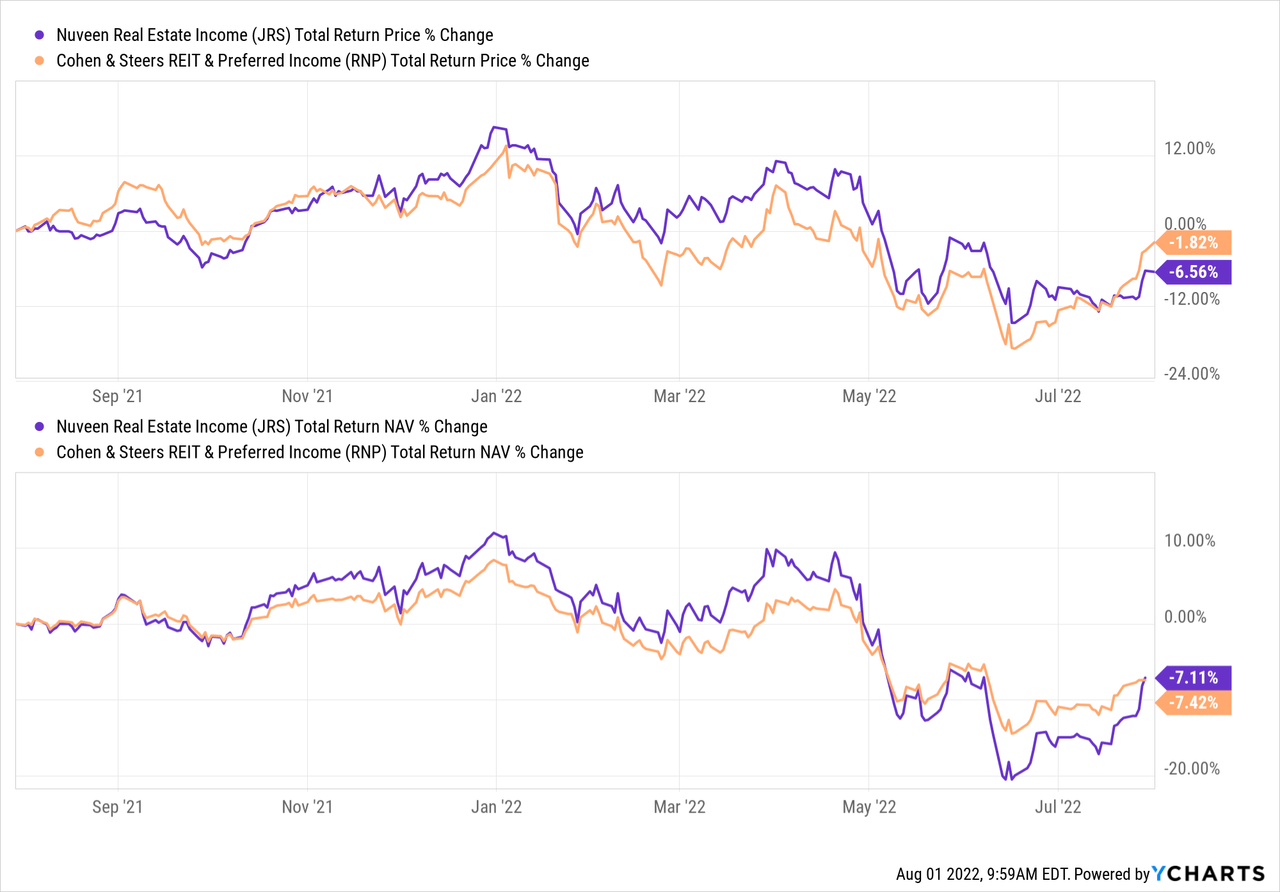
This isn’t to highlight JRS as a poor investment, even though it has been relative to RNP. I wanted to use it as a way to highlight what deleveraging can result in. Of course, it isn’t all deleveraging that is having this impact. It is a different portfolio too. That brings me to the point of why I hold JRS, to also gain some broader REIT exposure that RNP and its sister fund don’t invest in. It has shown to be a worse portfolio mix thus far, but that doesn’t mean it always will be.
On top of this, JRS’s discount is quite attractive, whereas RNP’s isn’t necessarily as appealing at this time. In fact, RNP is running quite rich. For RNP to outperform going forward, the portfolio must do meaningfully better or risk underperforming just simply due to valuation coming down.
Ycharts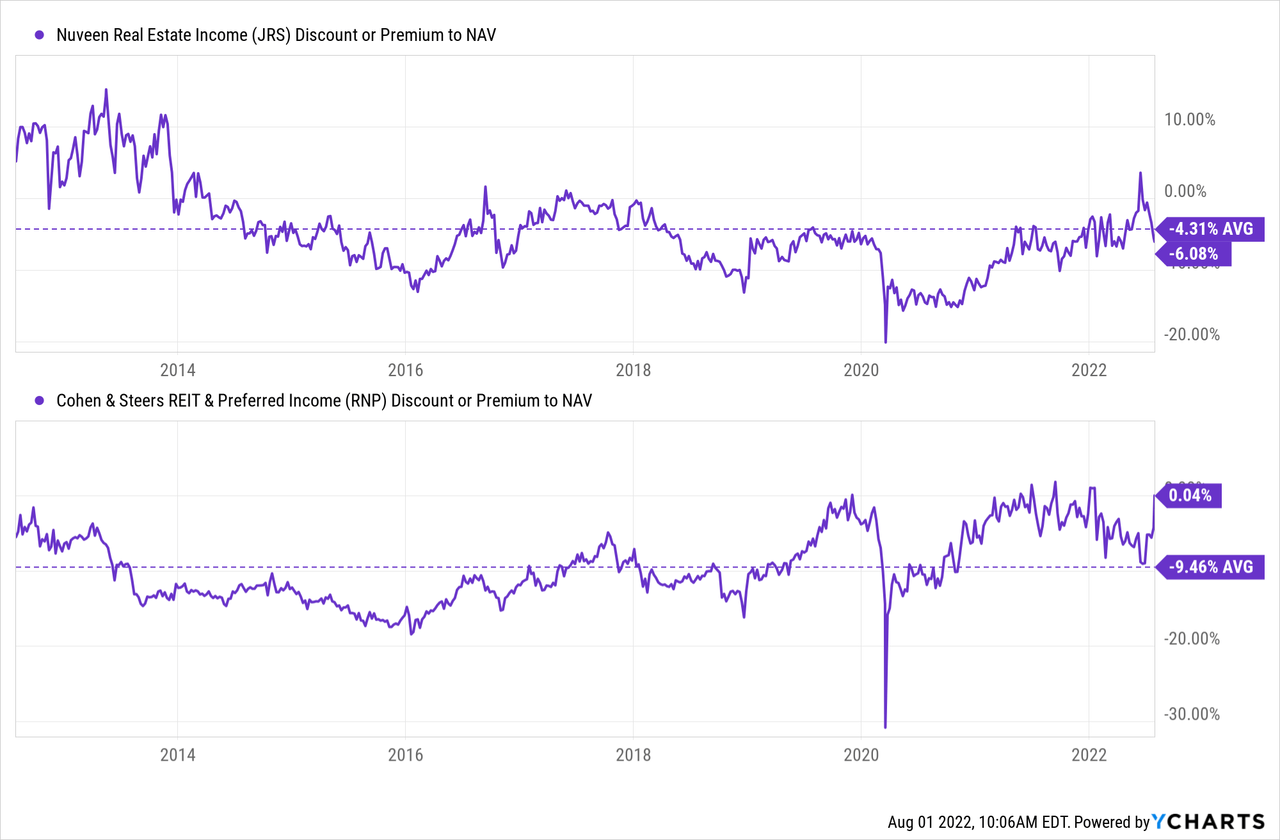
Distribution – Raised Distribution
Since our last update on the fund, JRS raised its distribution. That was announced at the beginning of March. The fund was doing better then and is likely before they had to deleverage as we ran into new lows in the following months.
However, it was still quite an interesting boost when it didn’t seem as if it was necessary. While the market turned weaker, it wasn’t exactly rosy in the first quarter, so the boost was quite unexpected. As a holder, the boost is welcomed, but I’m skeptical that it was a wise move in hindsight.
JRS Distribution History (CEFConnect)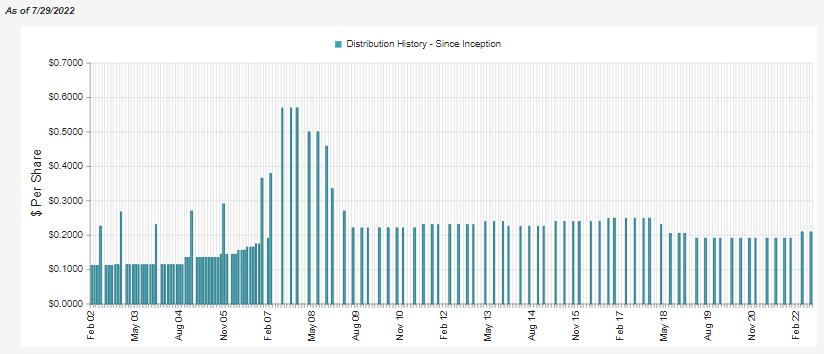
I had noted in our previous update that NII coverage had improved in their last report. At the same time, the fund will still rely significantly on capital gains to fund its distribution. This again highlights why the raise, in my opinion, was unusual. Even more unusual is that the full year showed that NII declined.
JRS Annual Report (Nuveen)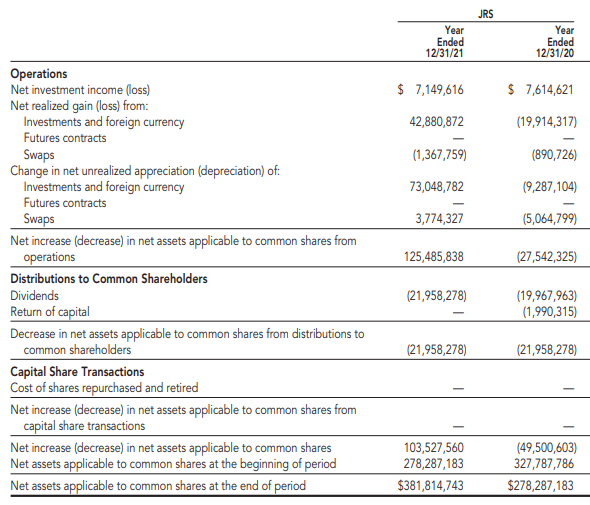
Most of the NII the fund had received was in the first half of the year. That’s one of the problems with trying to extrapolate out semi-annual periods to full twelve months. In the semi-annual period, they received $5,641,728 in NII. Now they only earned another $1,507,888 in the second half of the year. That’s a significant drop that I wouldn’t have anticipated.
The portfolio deleveraged and the higher interest costs on what debt they still have outstanding should result in an even lower NII next time. That is, all else being equal. With an actively managed fund, all else being equal is almost guaranteed NOT to be the case.
Ultimately, I’m skeptical that this raise was needed or beneficial to shareholders as it shows declining coverage with the forward outlook even more uncertain.
JRS’s Portfolio
JRS is split between investing in primarily common stocks but also a meaningful allocation to preferred shares. Primarily $25 preferred as they label it, but a small sliver in $1000 preferred.
JRS Asset Allocation (Nuveen)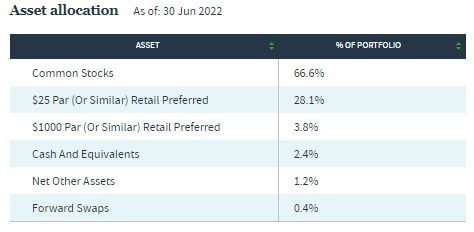
What is interesting here is that instead of the preferred being allocated to the financial sector, as other funds often do, it is invested in the real estate space. That seems rather appropriate given the name of the fund.
If we go back to RNP as an example again, their preferred allocation is heavily dedicated to the banking and insurance industries. Preferred exposure is almost split 50/50 in RNP between common and preferred too. So that fund has a sizeable allocation outside of the REIT or real estate market.
In this way, JRS is a more pure play on the real estate space relative to RNP.
JRS Top Five Industries (Nuveen)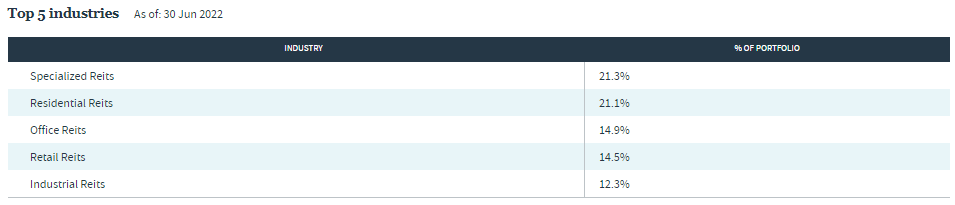
They run the portfolio with 89 different holdings. That’s diversified enough, but also on the more narrow end where each position gives a bit more of an impact on the actual outcome of the fund. If the managers choose the right holdings, the fund does better. If they pick incorrectly, then underperformance can really start to kick in.
In the industry allocation, we can also see that residential, office, retail and industrial REITs make up the bulk of JRS. These are fairly sensitive areas to the economy. That can help explain some of the fund’s weaker performance as well. I view it as a more aggressive fund relative to RNP.
JRS Top Ten (Nuveen)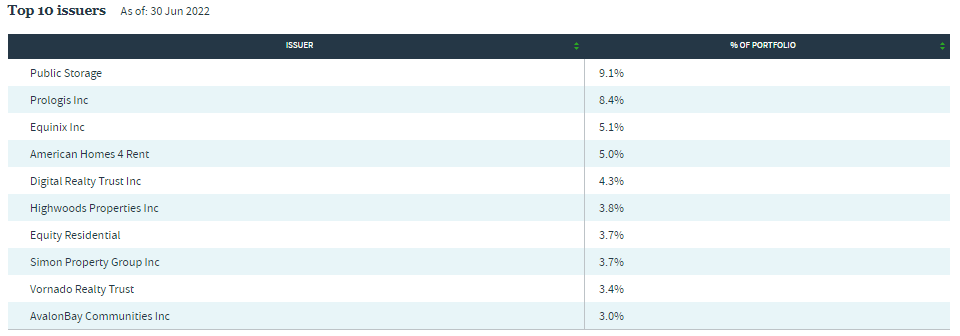
The top three holdings here, Public Storage (PSA), Prologis (PLD) and Equinix (EQIX), had a tremendous run more recently. That is what has popped up JRS’s NAV and price.
Ycharts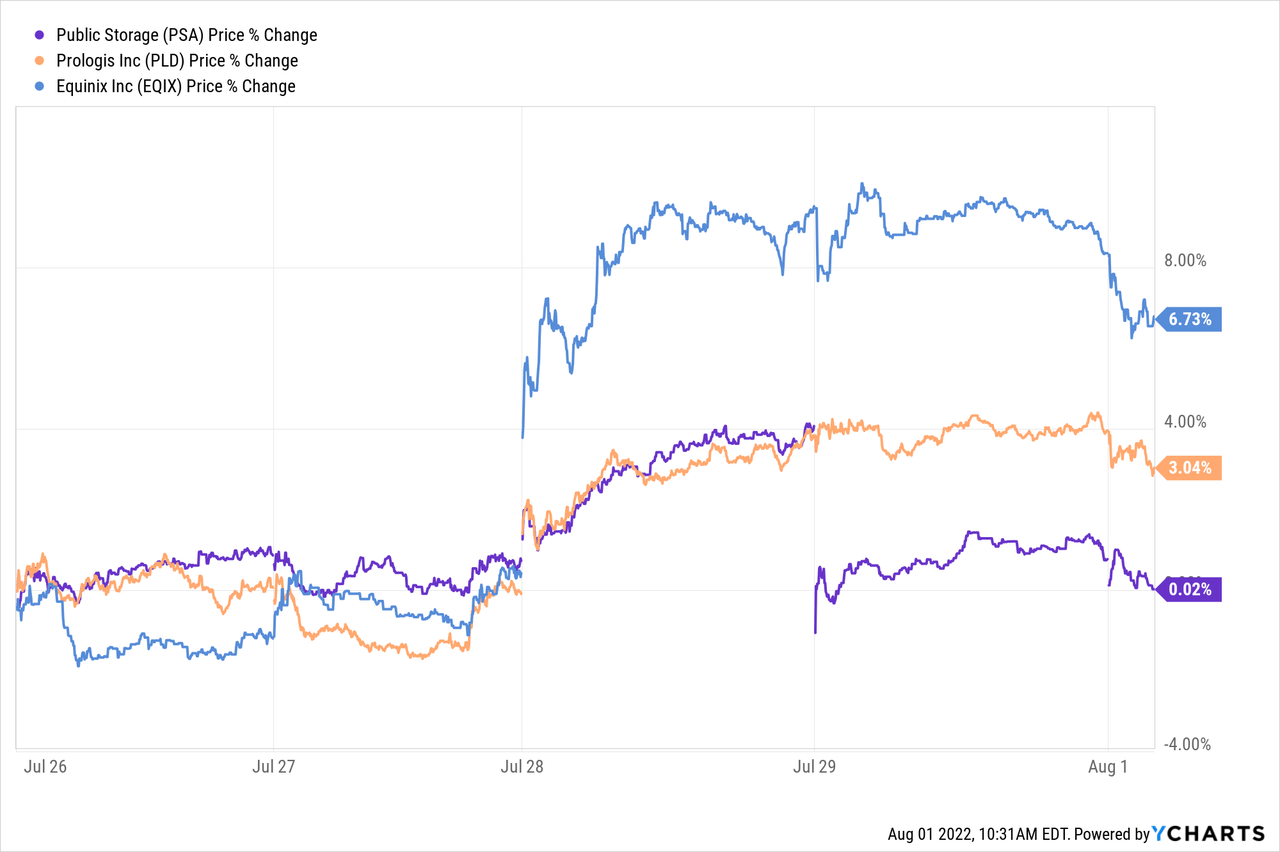
PSA looks like it had a big drop-off, but that simply reflects the $13.15 special that is being paid out due to the buyout of PS Business. They held a significant stake in PSB. That will show back up on August 4th, the dividend payment date.
PSA, PLD and EQIX are three names we also see show up in RNP’s top holdings. However, after that, the other names are different. That reiterates the point I had tried to make above: I hold both these REIT funds due to differentiated exposure.
Conclusion
JRS has been having a challenging year. This has been more a function of the overall down real estate market and broader markets. Of course, the leverage has only compounded the downside impact, working against the fund. Due to the higher leverage, it would appear the fund has deleveraged once again. That could see the fund’s rebound be quite muted. On the other hand, it is still fairly attractively priced. That could result in the fund performing relatively well compared to a peer such as RNP.
Be the first to comment