

Mark Wilson/Getty Images News
Introduction
We are upgrading our rating on JPMorgan Chase & Co. (NYSE:JPM) from Hold to Buy, after shares have fallen 27% from their peak, and following a review of Q1 2022 results released on Wednesday (April 13).
We downgraded JPM to Hold in April 2021 on valuation. Before that, JPM was Buy-rated in our coverage from April 2020, and also between February 2019 and January 2020, resulting in gains of 74.6% and 32.9% respectively:
|
Librarian Capital JPM Rating History vs. Share Price (Since 2019) 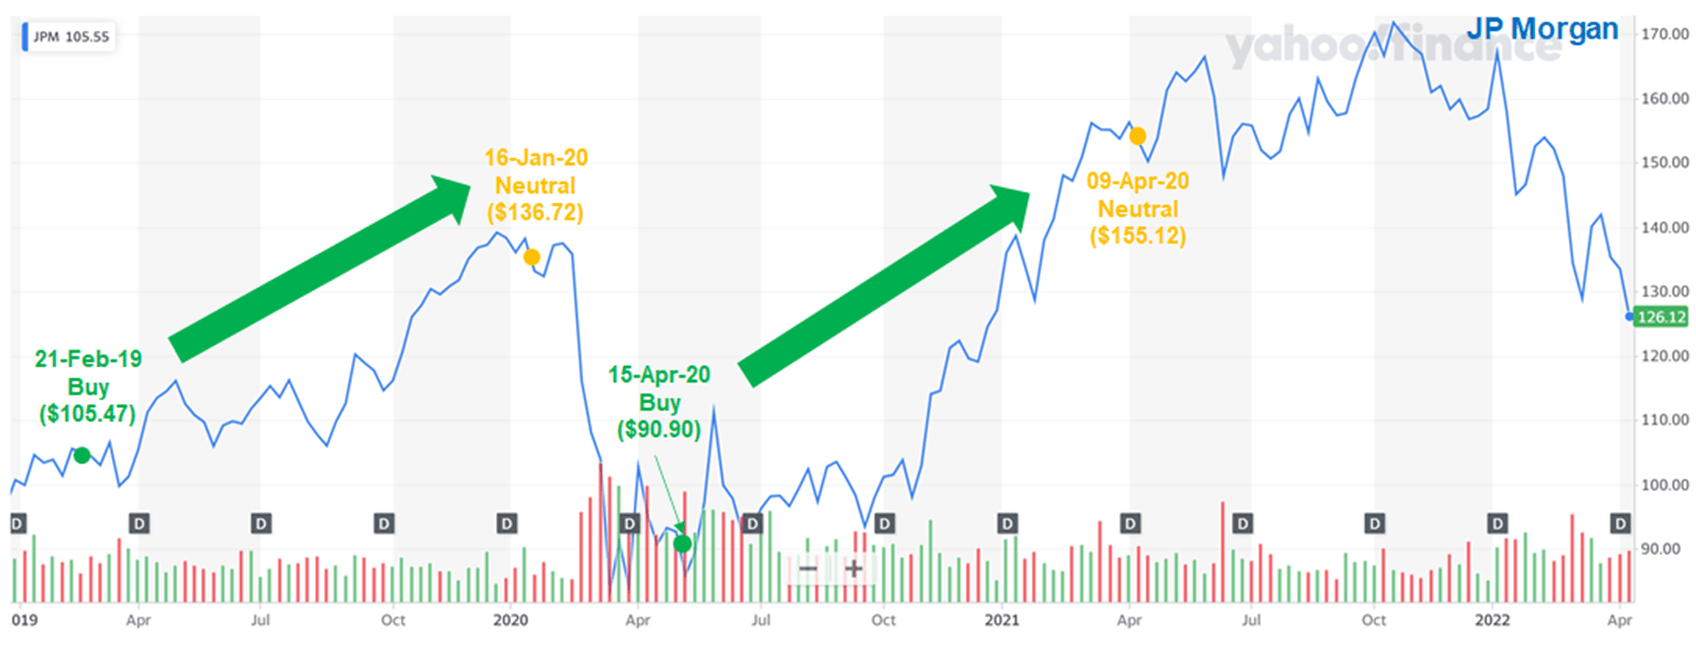 Source: Yahoo Finance (15-Apr-22). |
With JPM shares having fallen 18.7% in the 12 months since our downgrade, and trading at 1.8x Price / Tangible Book Value (“P/TBV”), we believe they are attractive again. Q1 results confirm our long-term views on the business. Our forecasts show a total return of 73% (16.8% annualized) by 2025 year-end, and the Dividend Yield is currently 3.2%.
Buy Case Recap
We believe large U.S. banks can grow their earnings at “GDP +”, thanks to their scale, diversified franchise and leading market positions:
- Large banks achieve Net Interest Income (“NII”) on favourable Net Yields, thanks to their cheap deposit funding; Net Yields had shrunk in recent years due to Quantitative Easing (“QE”), but this is now reversing
- They have large Non-Interest Revenues such as investment banking fees, which tend to become elevated during periods of QE as cheap money stimulates corporate and market activity, offsetting NII weakness
- Their cost ratios tend to be stable or improving, as economies of scale and use of technology help them become more efficient
- They are now far less impacted by economic downturns than in the past, thanks to QE policies and much larger capital buffers after the 2008 crisis
We believe JPM has the best franchise among large U.S. banks, though Bank of America (BAC) has similar advantages and is also Buy-rated.
With JPM, we assume a long-term, across-the-cycle average Return on Tangible Common Equity (“ROTCE”) of 16%, which is 1 ppt lower than management’s own target and supported by JPM’s track record (adjusted for differences in capital ratios before 2008 and the tax rate before 2018):
|
JPM ROTCE vs. Medium-Term Outlook (Since 2004) 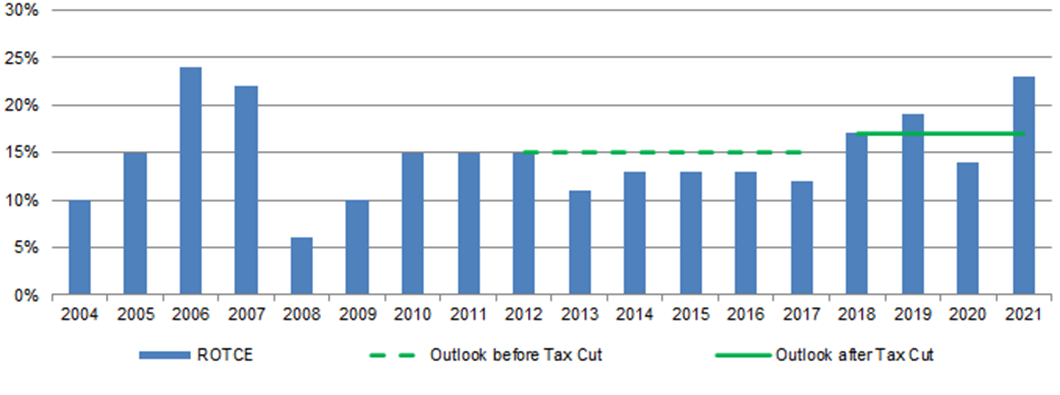 Source: JPM results supplements. |
We believe JPM shares should trade at a 15x P/E, which on a 40% Payout Ratio would mean a Dividend Yield of 2.7%. With a ROTCE of 16%, this implies JPM shares should trade at a P/TBV of 2.4x – they are at 1.8x at present.
Q1 2022 results support our investment case, though elevated investment banking revenues in 2021 and irregular credit reserve builds/releases mean headline year-on-year comparisons look much less favorable.
Earnings Normalizing in Q1 2022
JPM’s Q1 2022 EPS was 41.4% lower year-on-year and 21.0% lower sequentially, but the underlying trends were actually positive:
|
JPM Results Headlines (Managed Basis) (Q1 2022 vs. Prior Periods) 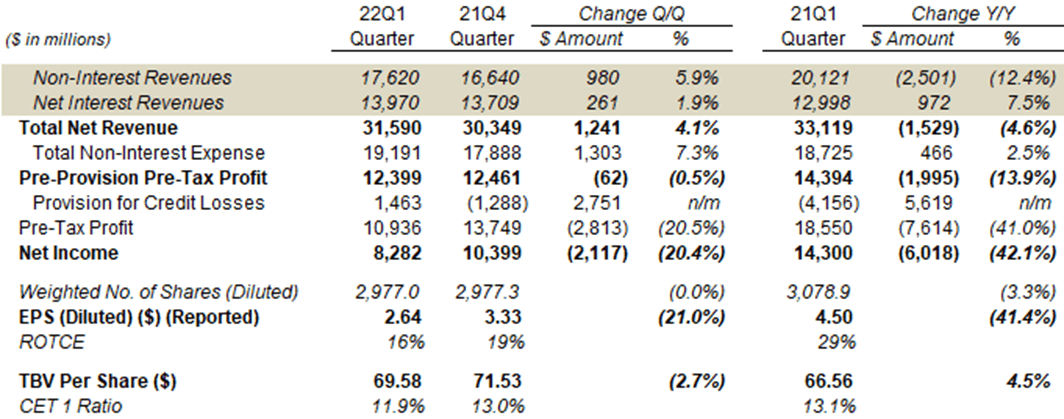 Source: JPM results supplement (Q1 2022). |
Non-Interest Revenues were down 12.4% year-on-year (though up 5.9% from Q4 2021), including double-digit declines in Investment Banking Fees, Principal Transactions, Investment Securities Gains, Mortgage Fees & Related Income and Card Income. The first four can be attributed to an exceptional prior year, while Card Income fell due to higher new account acquisition costs as JPM invests to grow its Card business:
|
JPM Non-Interest Revenues By Type (Last 5 Quarters) 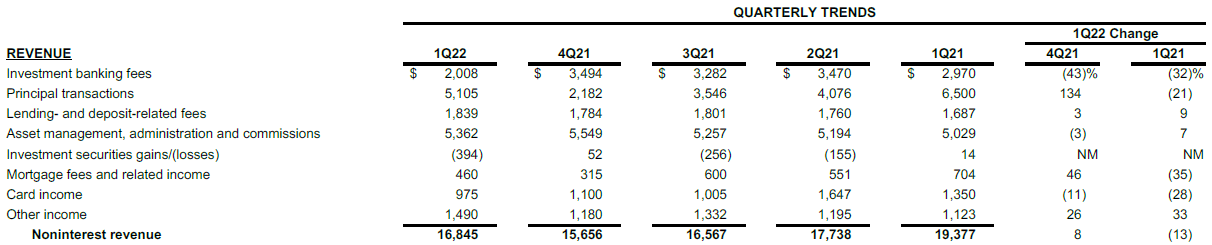 Source: JPM results supplement (Q1 2022). |
Net Interest Revenues grew 7.5% year-on-year and 1.9% from Q4 2021, with improvements in both loan balances and Net Yields (more below).
Non-Interest Expense grew 2.5% year-on-year, with structural growth and investments in the cost base offset by lower revenue-related costs.
Pre-Provision Pre-Tax Profit, which excludes one-off reserve builds/releases, was 13.9% lower than the prior year, but slightly higher than both the preceding quarter than the (mostly) pre-COVID Q1 2020:
|
JPM Earnings, Provisions & Pre-Tax Profit by Quarter (Since Q4 2019) 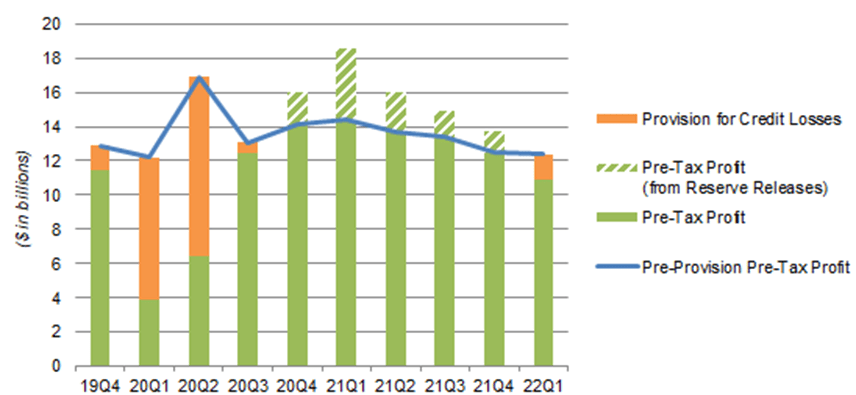 Source: JPM results supplements. NB. Figures on managed basis. |
Provision for Credit Losses was positive $1.46bn, compared to negative figures of $4.16bn in Q1 2021 and $1.29bn in Q4 2021. This consisted of $0.6bn of Net Charge-Offs, no worse than prior quarters, and a reserve build of $0.9bn, compared to large releases before:
|
JPM Provision for Credit Losses (Q1 2022 vs. Prior Periods) 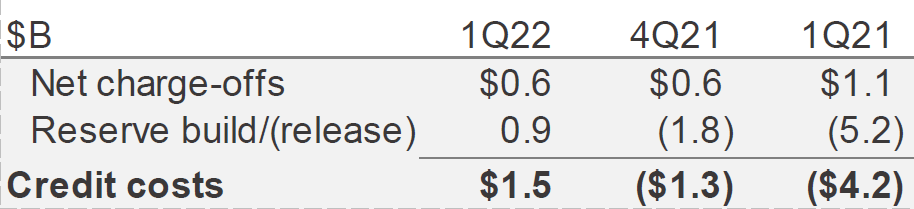 Source: JPM results presentation (Q1 2022). |
The change in reserve builds/releases was the main reason that Pre-Tax Profit was 42.1% lower year-on-year, and is mostly one-off in nature (including $0.3bn in name-specific builds, “primarily” on Russia-related exposure).
The number of shares was down 3.3% year-on-year but flat sequentially, due to Q1 being the quarter when share incentives are recorded. JPM spent $2.5bn to repurchase 18.1m shares in Q1, but this was offset by 11.0m shares issued for employee compensation.
Return on Tangible Common Equity was 16%, lower than prior periods but in line with our (long-term average) assumption.
The Common Equity Tier-1 (“CET1”) ratio was 11.9%, down from 13.0% in Q4, but near the top of management’s 11-12% target range. It was kept high in the preceding quarter to absorb anticipated charges.
Overall, JPM’s headline results were in line with our investment case, and their unfavourable comparisons with prior periods merely represent a normalization in credit provisions and wholesale revenues from a pandemic year.
Results from individual segments show the same pattern.
Segments Stable Excluding COVID Boost
JPM’s segments are stable, albeit with earnings normalizing from their elevated levels in 2021 and impacted by one-off credit reserve changes:
|
JPM Net Revenue & Net Income by Segment (Q1 2022 vs. Prior Periods) 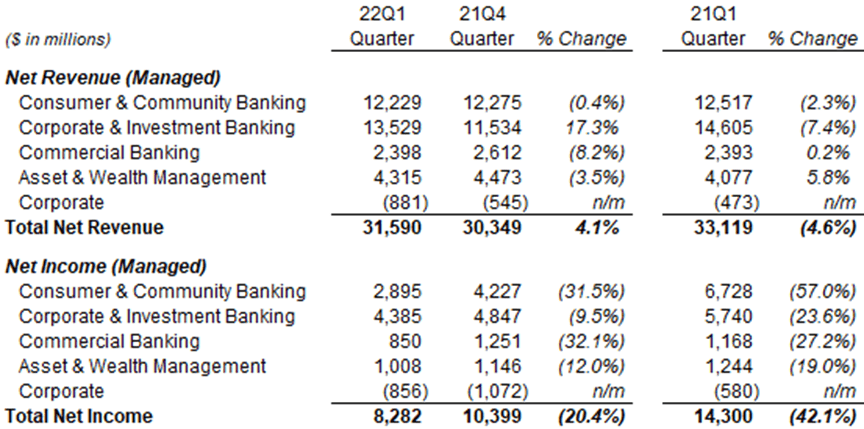 Source: JPM results supplement (Q1 2022). |
We focus on revenues as Net Income figures are hit by reserve changes.
Consumer & Community Banking revenues were down 2.3% year-on-year, as higher revenues in Consumer & Business Banking (from higher deposits and client assets) were offset by lower revenues in Home Lending (mortgage activity was high last year due to low rates) and in Card & Auto (higher Card account acquisition costs, lower Auto volumes due to vehicle shortages).
Corporate & Investment Banking revenues were down 7.4% year-on-year, primarily due to much lower Investment Banking (“IB”) fees for both Debt (down 20%) and Equity (down 76%) underwriting. IB Advisory fees were up, and Markets revenues were only 3% lower year-on-year. There was also a $524m loss in Credit Adjustments & Other, due to spreads widening and credit valuation adjustments (including on Russia-related exposure).
Commercial Banking revenues were up 0.2% year-on-year, with lower IB revenues being offset by higher payments revenue and deposits.
Asset & Wealth Management revenues were up 5.8% year-on-year, due to growth in deposits and loans, higher management and performance fees, and the absence of valuation gains in the prior year.
Net Interest Income Growth Accelerating
A key positive development is the acceleration in NII growth. Year-on-year NII growth was 7.6% in Q1, compared to 2.6% in Q4 2021 (sequential growth is less comparable due to seasonality in loan balances):
|
JPM Interest Revenue, Loans & Rates (Q1 2022 vs. Prior Periods) 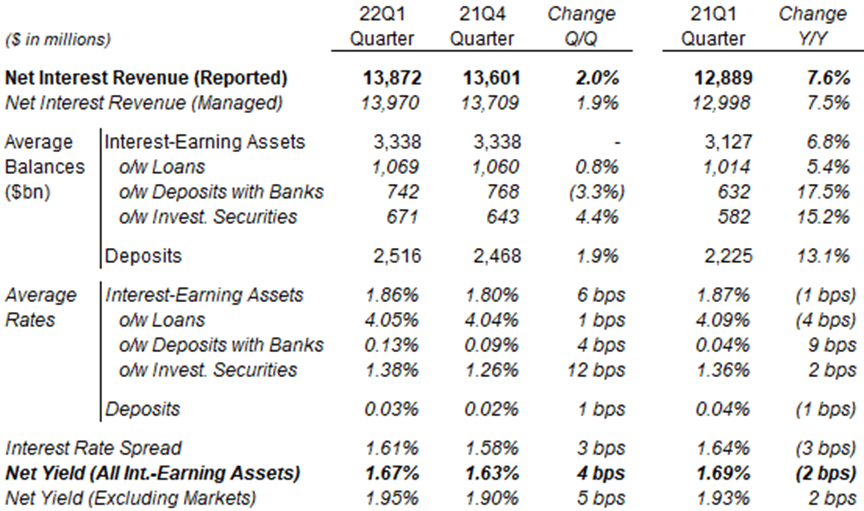 Source: JPM results supplement (Q1 2022). |
Year-on-year NII growth was primarily driven by a 6.8% growth in Interest-Earning Assets, which includes a 5.4% growth in Total Loans (measured on average balances; on period-end balances, Loans grew 6.2% year-on-year, or 8% excluding COVID-era Paycheck Protection Program loans). This represents a continuation of the loan growth since the Q3 2020 trough:
|
JPM Total Loans Balance (Since Q4 2019) 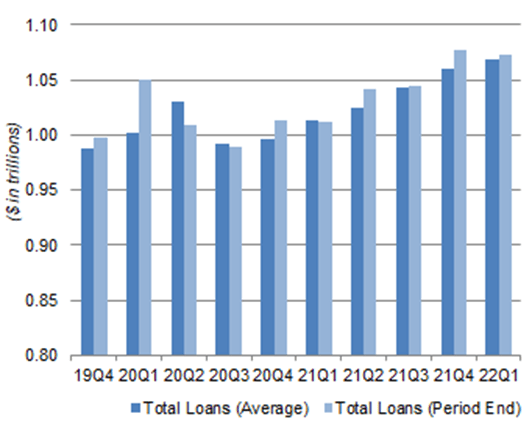 Source: JPM results supplements. |
Net Yield on all interest-earning assets was still 2 bps lower year-on-year, though it was up 2 bps excluding Markets. It was up 4 bps sequentially (or 5 bps excluding Markets):
|
JPM Rates & Yields By Quarter (Since Q4 2019) 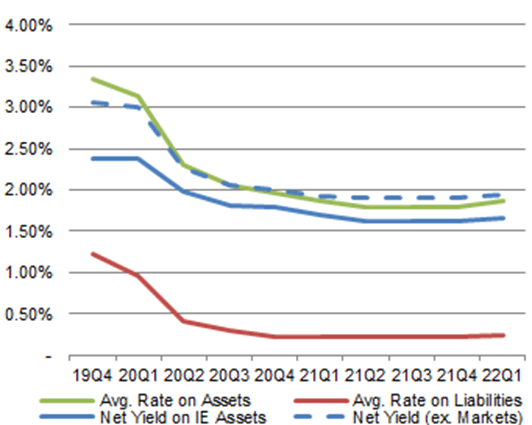 Source: JPM results supplements. |
JPM stands to benefit from the rise in rates expectations since the start of the year. CFO Jeremy Barnum stated on the call that NII outlook for 2022 has improved since February, though JPM is not formally raising its outlook:
We still expect NII ex Markets to be in excess of $53bn and adjusted expenses to be approximately $77bn … given what’s happened in terms of Fed hike expectations and what’s getting questioned into the front of the curve, we would actually expect the ‘excess’ part of ‘in excess of $53bn’ to be bigger than it was at Credit Suisse (Financial Services Forum in February).”
Management will provide “more color” on the NII outlook at the investor day scheduled next month.
Market Share Gains Enlarged Revenue Bases
One key question is how much Corporate & Investment Banking (“CIB”) revenues will fall back to pre-COVID levels; they remained substantially higher in Q1 2021 in NII and Principal Transactions (trading revenues in Markets):
|
JPM CIB Revenues by Type (Since 2019) 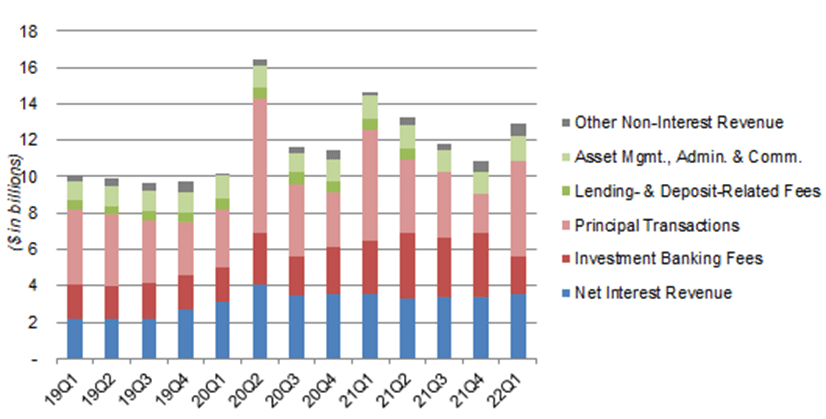 Source: JPM results supplements. Source: JPM results supplements. |
The transaction-based nature of much of these revenues makes them hard to predict, but there is hope that they will not fall back all the way to 2019 levels, due to market share gains permanently enlarging their bases. As the CFO opined on the call:
“If you define normalization as a return to kind of like 2019-type trading run rate levels, we never expected that because there’s been a bunch of organic growth in the background, some share gains.”
The same dynamics should apply to NII in CIB, due to share gains in lending.
Same 2022 and Medium-Term Outlook
Management’s outlook for 2022 and the medium term is unchanged.
For 2022, JPM is still expecting NII “in excess of” $53bn, though with a larger “excess” than before (as explained above), and expense of $77bn:
|
JPM 2022 Outlook 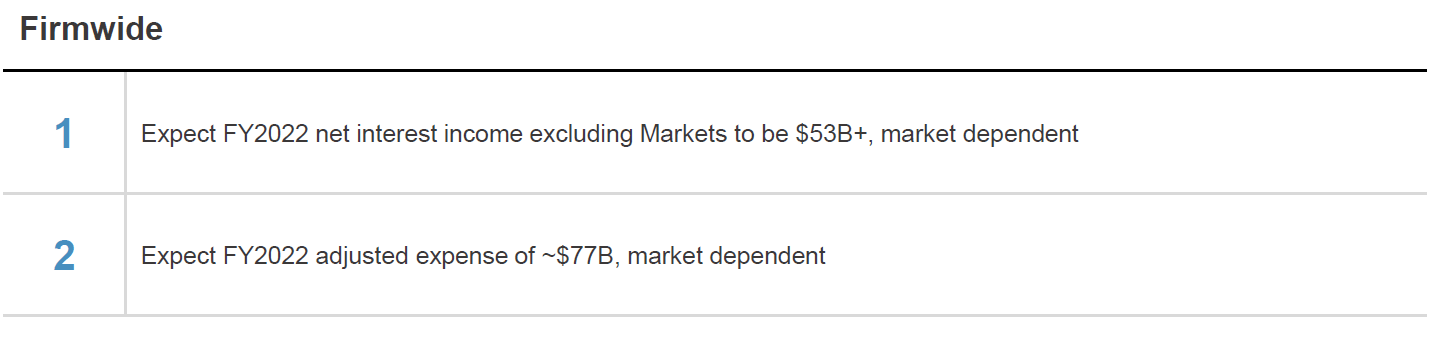 Source: JPM results presentation (Q1 2022). |
For the medium term, JPM continues to have “confidence” of achieving a “17% ROTCE through the cycle”, albeit with the same short-term headwinds that may push ROTCE below the target as articulated at Q4 2021 results.
We continue to assume a slightly lower 16% ROTCE, and note this was achieved in Q1 2022 even with one-off negatives such as on Russian exposure.
JPM Stock Key Metrics
With shares at $126.12, JPM shares are trading at 1.8x P/TBV (TBV is $69.58 per share). The P/E multiple is 10.7x if we apply management’s targeted ROTCE of 17%, or 11.3x if we apply our expected ROTCE of 16%.
(Relative to history, JPM shares are on 10.7x, 13.5x and 8.0x P/E relative to 2019, 2020 and 2021 earnings respectively, though 2020-21 earnings are distorted by credit reserve builds/releases and not representative.)
JPM stock pays a dividend of $1.00 per quarter ($4.00 annualized), having been raised 11% this year, and representing a Dividend Yield of 3.2%.
JPM Stock Forecasts
We maintain the same forecasts as before, but update our buyback assumption given the lower share price:
- Tangible Book Value to stay flat after dividends and buybacks
- ROTCE to be 15% in 2022, and 16% from 2023
- Dividend to be on a 40% Payout Ratio from 2022
- Net Income after dividends to be spent on buybacks
- Buybacks to be done at 2.0x P/TBV (was. 2.3x)
- P/E multiple to be 15x at 2025 year-end
The 15x P/E assumed is equivalent to a 2.3x P/TBV, based on our assumed ROTCE of 16%, and implies a Dividend Yield of 2.7%.
Our 2025 EPS forecast is 2% higher than before ($12.97):
|
Illustrative JPM Return Forecasts 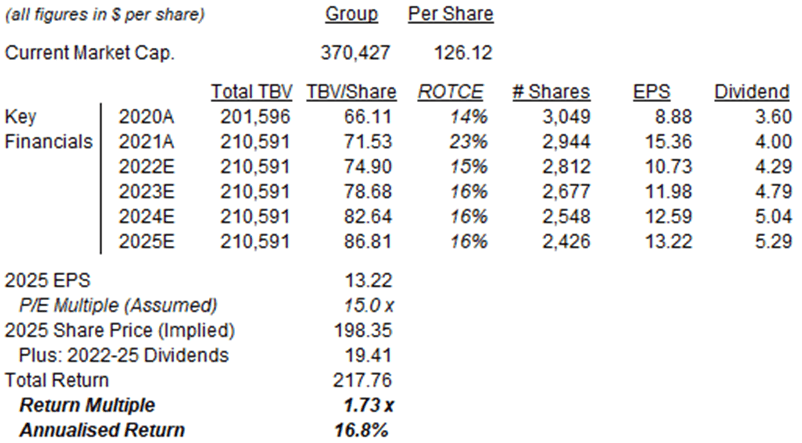 Source: Librarian Capital estimates. |
With shares at $126.12, we expect an exit price of $198 and a total return of 73% (16.8% annualized) by 2025 year-end.
Conclusion: Is JPM Stock a Buy?
Excluding one-off credit reserve builds/releases, profits were stable sequentially and similar to the level in pre-COVID Q1 2020.
Profits are normalizing after their COVID-year boost, but JPM’s businesses are otherwise stable, loan growth is accelerating and yields are rising.
Q1 results support the 16% Return on Tangible Common Equity we assume. With shares trading at 1.8x Tangible Book Value, this implies a 11.3x P/E.
With shares at $126.12, we expect an exit price of $198 and a total return of 73% (16.8% annualized) by 2025 year-end.
We upgrade our rating on JPMorgan Chase & Co. stock to Buy.
Be the first to comment