

gesrey
This article series aims at evaluating products regarding the relative past performance of their strategies and quality of their current portfolios. As holdings and their weights change over time, updated reviews are posted when necessary.
JOET strategy and portfolio
The Virtus Terranova U.S. Quality Momentum ETF (NASDAQ:JOET) has been tracking the Terranova U.S. Quality Momentum Index since 11/17/2020. It has a portfolio of 125 stocks, $86M in asset value, a distribution yield of 0.55%, and an expense ratio of 0.29%. JOET features an original strategy mixing quality factors and momentum.
As described by Virtus, quality and momentum scores are calculated for the 500 largest US securities in market capitalization. The momentum score is based on the 12-month return. The quality scores combine three factors: return on equity (ROE), debt to equity ratio, and three-year sales growth rate. The underlying index selects a set of 125 stocks determined as the better half regarding the quality score within the better half regarding the momentum score. The index is reconstituted and rebalanced in equal weight every quarter.
JOET invests mostly in companies based in North America (97%), in the large and mega-cap segment (64%).
Technology is the heaviest sector, not as heavy as in SPY though (22.8% vs. 27.3%). It is followed by healthcare (18.3%), financials (14.5%) and energy (10.7%). Other sectors are below 10% individually and 33% in aggregate. Compared to SPY, JOET underweights technology, communication, consumer discretionary, and ignores utilities. It overweights all other sectors.
Sector breakdown (chart: author, data: Fidelity)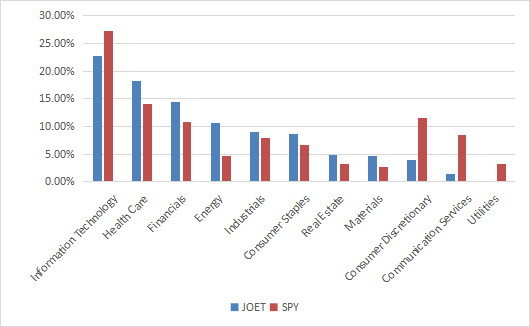
JOET is cheaper than the S&P 500 (SPY) in price-to-earnings and price-to sales. Other valuation ratios are similar.
|
JOET |
SPY |
|
|
Price / Earnings TTM |
17.01 |
19.63 |
|
Price / Book |
3.78 |
3.72 |
|
Price / Sales |
1.82 |
2.4 |
|
Price / Cash Flow |
13.75 |
14.98 |
Holdings are in equal weight on rebalancing dates, but position sizes may drift with price action. The next chart lists the top 10 holdings as of writing. They represent 9.7% of asset value and the heaviest position weighs less than 1.1%, so risks related to individual stocks are low.
|
Ticker |
Name |
Weight |
EPS growth %TTM |
P/E TTM |
P/E fwd |
Yield% |
|
Enphase Energy, Inc. |
1.08 |
12.78 |
199.63 |
69.98 |
0.00 |
|
|
Regeneron Pharmaceuticals, Inc. |
1.03 |
-10.04 |
14.67 |
17.53 |
0.00 |
|
|
ConocoPhillips |
1.02 |
944.95 |
9.06 |
7.32 |
4.04 |
|
|
Devon Energy Corp. |
0.96 |
4028.60 |
8.32 |
7.05 |
6.18 |
|
|
EOG Resources, Inc. |
0.96 |
202.29 |
12.31 |
7.87 |
2.50 |
|
|
The Charles Schwab Corp. |
0.96 |
28.64 |
24.07 |
18.72 |
1.20 |
|
|
Archer-Daniels-Midland Co. |
0.93 |
54.69 |
13.09 |
12.06 |
1.93 |
|
|
Diamondback Energy, Inc. |
0.92 |
346.28 |
6.05 |
5.06 |
2.32 |
|
|
The Allstate Corp. |
0.91 |
-87.11 |
38.80 |
23.36 |
2.65 |
|
|
Gartner, Inc. |
0.91 |
36.60 |
32.08 |
31.09 |
0.00 |
Performance
The next chart compares JOET and SPY since JOET inception on 11/17/2020. JOET is close behind the large cap benchmark, lagging it by 1.5 percentage points in 1 year and 11 months. It is a little bit more volatile.
JOET vs. SPY (Trading View on Seeking Alpha)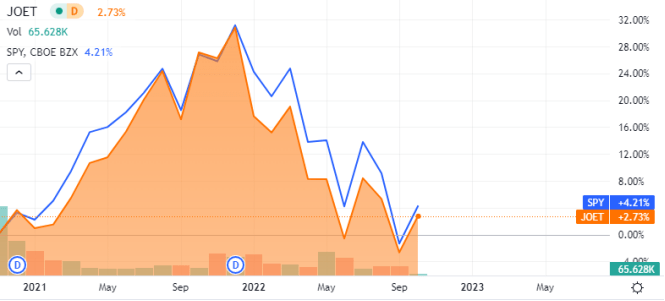
This period of time is too short to assess the strategy. It may not be representative of long-term performance. I have tried to simulate the strategy as I understand it since January 2000 to June 2021: the results are below. It needs a note of caution: the methodology is not 100% disclosed in the prospectus, letting a few points to my interpretation when I coded it.
|
1/1/2000-1/1/2021 |
Total Return |
Annual Return |
Max Drawdown |
Sharpe ratio |
Volatility |
|
simulated JOET – my interpretation |
510.01% |
8.99% |
-50.91% |
0.56 |
15.19% |
|
S&P 500 (SPY) |
278.67% |
6.55% |
-55.42% |
0.41 |
15.33% |
|
Equal-weight S&P 500 (RSP) |
531.28% |
9.17% |
-59.90% |
0.51 |
17.70% |
Data calculated with Portfolio123
ETF management fees are included in SPY performance, but must be subtracted from the simulation result. With JOET’s 0.29% expense ratio, my interpretation of the strategy would have outperformed SPY by 2.15 percentage points annualized. It also shows a slightly lower risk measured in maximum drawdown and standard deviation of monthly returns (named “volatility” in the table).
As the fund’s underlying index is equal-weighted, it also makes sense to compare it with the Equal Weight S&P 500 (RSP). The difference in return is immaterial, but risk reduction in drawdown and volatility is significant.
JOET strategy vs. my quality subset
In previous articles, I have presented my preferred quality metrics: Return on Assets, Piotroski F-score, Altman Z-score.
The next table compares “simulated JOET” from 2000 to June 2021 with a subset of the S&P 500: stocks with an above-average ROA, a good Altman Z-score, and a good Piotroski F-score. The subset is rebalanced quarterly to make it comparable with JOET strategy.
|
1/1/2000-1/1/2021 |
Total Return |
Annual Return |
Max Drawdown |
Sharpe ratio |
Volatility |
|
JOET Simulation |
510.01% |
8.99% |
-50.91% |
0.56 |
15.19% |
|
Quality subset |
672.77% |
10.23% |
-48.43% |
0.63 |
15.26% |
Past performance is not a guarantee of future returns. Data Source: Portfolio123
My quality subset is a bit better than JOET simulation in return, drawdown, and risk-adjusted performance (I pick 14 stocks of my real portfolio in this subset, more info at the end of this post).
Scanning JOET with quality metrics
JOET holds 125 stocks. According to my calculations, the average ROA of the portfolio is far above the S&P 500: 11.33% vs. 7.49%. The Altman Z-score is also better: 4.98 vs. 3.30. There is no significant difference in Piotroski F-score. These metrics, which are more comprehensive than the factors used for the index constitution, point to an excellent portfolio quality relative to the large cap benchmark.
|
Altman Z-score |
Piotroski F-score |
ROA % TTM |
|
|
SPY |
3.30 |
5.94 |
7.49 |
|
JOET |
4.98 |
6.21 |
11.33 |
Moreover, there is no company in the portfolio with more than one red flag among: bad Piotroski score, negative ROA, bad or dubious Altman Z-score, excluding financials and real estate where these metrics are unreliable. This is extremely rare in my ETF reviews.
Takeaway
JOET is designed for investors seeking an equal-weight allocation in high quality large caps with above-average momentum. It picks 125 stocks in a large and mid-cap universe using a ranking system with four factors: 12-month momentum, return on equity, debt to equity, and 3-year sales growth. Aggregate metrics confirm JOET has a high-quality portfolio, and valuation is also a bit cheaper than the S&P 500. Price history is too short to assess performance. A two-decade simulation of my interpretation of the strategy slightly beats SPY, but it is on par with the Equal Weight S&P 500. Considering dividend growth as a quality factor, the Vanguard Dividend Appreciation (VIG) and the WisdomTree U.S. Dividend Growth (DGRW) are competitors with proven performances. JOET is not very liquid: using limit orders is always recommended. For transparency, my equity investments include a quality-oriented managed portfolio of 14 stocks (Stability model), which currently holds several constituents of JOET.
Be the first to comment