

Darren415
It’s been a brutal year for investing, and pessimism is at significantly high levels. While looking back over 5 years, the markets have generated substantial gains, but the past year has created elevated levels of bearishness. The S&P is off its highs by more than -22% falling from 4,818.62, and the Nasdaq has declined by more than -31.8% from its peak of 16,212.23. The S&P is more than 1,000 points off its 52-week high, while the Nasdaq has declined more than 5,000 points. The euphoria that captivated investors has left the market, and uncertainty has replaced it. You’re either a glass half full or half empty person, and investing is all about perspective. Nobody knows if the June lows will stay intact or if the markets will form a lower bottom going into the winter. I see volatility as an opportunity to allocate capital strategically for the future.
Actively managed high-yield funds have become increasingly popular among income investors. The large monthly distributions continue to look better and better as nothing seems to get the markets moving upwards. Global X has 3 of the most popular covered-call ETF products, but JPMorgan Chase (JPM) has an alternative option, JPMorgan Equity Premium Income ETF (NYSEARCA:JEPI), which has a 10.58% yield and more than $12 billion in assets under management. Everybody has a different investment philosophy, but JEPI could help investors mitigate downside risk, generate a high yield through monthly distributions, and provide future upside opportunities for those with a long time horizon.
JEPI is outperforming the major indices, and Global X’s Covered Call ETFs
For me, the allure of Global X’s Covered Call ETFs was the large monthly distributions they generated while seeming to fall less than their respective indexes during market downturns. In full transparency, before the disclosure section, I want to state that I own the Global X Nasdaq 100 Covered-Call ETF (QYLD), Global X S&P 500 Covered-Call ETF (XYLD), and Global X Russell 2000 Covered-Call ETF (RYLD), in addition to JEPI, and I am planning on adding to all 4 funds. I like diversification, and I don’t want anyone coming to a conclusion that I am biased toward JEPI as I am invested in all 4 funds.
Putting yield aside for a moment, from a pure capital perspective, JEPI is outperforming QYLD, XYLD, RYLD, SPDR S%P 500 Trust (SPY), Invesco QQQ ETF (QQQ), and the Vanguard Russell 2000 ETF (VTWO) in both YTD and 1-year periods. Staying out of the market isn’t a choice many people make, as investing in the market is one of the greatest opportunities to generate an ROI on your capital.
The past year hasn’t been optimal for investors, but income investors are still generating dividends, and investors are building long-term positions in equities and funds. From an income investor perspective, JEPI is where you would have wanted to be in 2022. JEPI has declined by -15.61% in 2022, compared to -21.57% in the S&P, -30.29% in the Nasdaq, -22.36% with XYLD, and -27.86% with QYLD. JEPI may not have the highest yield, but from an overall annualized gain perspective, what JEPI has saved investors in downside mitigation has more than made up for the additional income generated by the Global X funds.
Seeking Alpha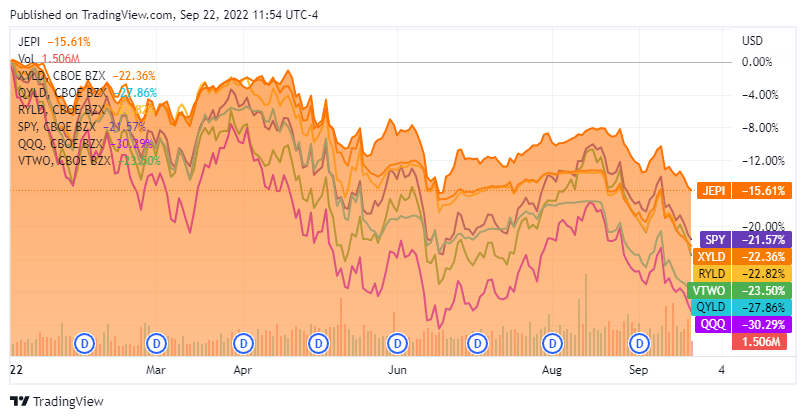
Seeking Alpha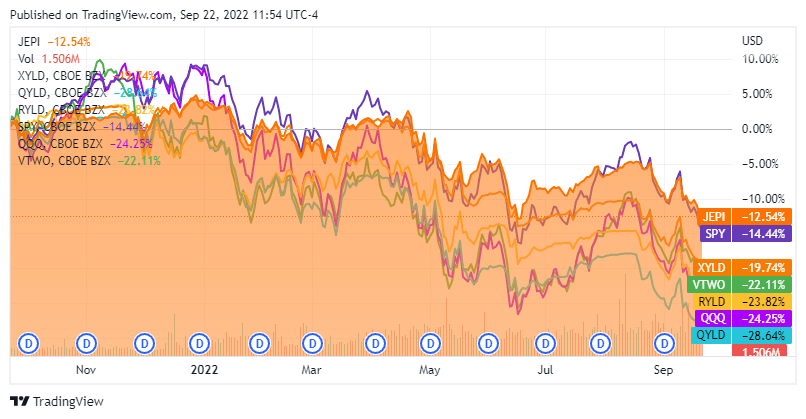
Comparing JEPI to XYLD from an income perspective in 2022
XYLD has proven to be the least volatile among the high-yielding Global X Covered-Call ETFs. I will compare XYLD and JEPI over the course of 2022 to see which ETF has been better for income investors. The initial investments will be 100 shares of each ETF on 1/3/22. The models will show how much distributable income investors would have received and where their investment would be today. After the two tables are built, I will compare JEPI to XYLD and show which has been the superior income investment in 2022.
Seeking Alpha, Steven Fiorillo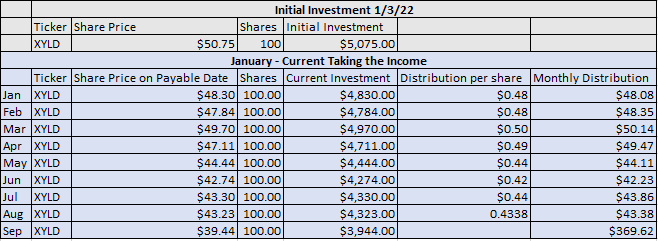
The initial investment in XYLD would have cost $5,075 and today would be worth $3,944. Over the previous 8 months, XYLD has paid $369.62 in distributions for a 7.28% yield on investment.
Seeking Alpha, Steven Fiorillo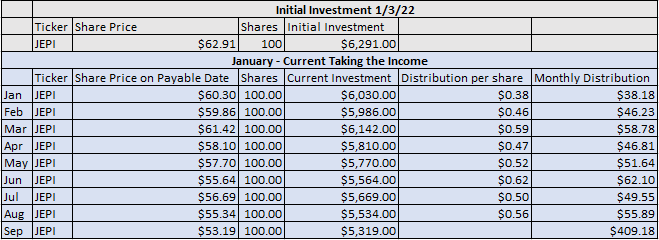
An initial investment of 100 shares on 1/3/22 in JEPI would have cost $6,291. Today the initial investment would be worth $5,319. Over the past 87 months, JEPI has generated $409.18 in distributions which is a 6.5% yield on investment.
|
XYLD vs. JEPI |
XYLD |
JEPI |
|
Initial Investment |
$5,075.00 |
$6,291.00 |
|
Current Investment |
$3,944.00 |
$5,319.00 |
|
Profit |
-$1,131.00 |
-$972.00 |
|
Initial Investment ROI |
-22.29% |
-15.45% |
|
Current Distributions Paid |
$369.62 |
$409.18 |
|
Yield on Investment |
7.28% |
6.50% |
|
Total Profit |
-$761.38 |
-$562.82 |
|
Total ROI |
-15.00% |
-8.95% |
|
Initial shares |
100.00 |
100.00 |
|
Current Shares |
100.00 |
100.00 |
|
Share Increase |
0.00 |
0.00 |
|
Additional Annual Income |
$0.00 |
$0.00 |
|
TTM Distributions |
$5.17 |
5.64 |
|
FWD Projected Annual Income |
$517.27 |
$564.00 |
|
Forward Yield on Initial Investment |
10.19% |
8.97% |
Now the question is, which has been the better investment? The initial allocated capital in XYLD declined by -22.29%, while investors in JEPI saw their capital decline by -15.45%. XYLD had a 0.78% higher yield on investment. When the decline in capital and income generated were looked at together, XYLD had a -15% ROI while JEPI had a -8.95% ROI. The additional yield generated by XYLD wasn’t enough to offset the additional capital depreciation as XYLD fell further in 2022 compared to JEPI. Going back 12 months, XYLD has a 10.19% forward yield on invested capital while JEPI’s is 8.97%. If I had to choose, the slightly additional yield isn’t worth sacrificing the downside protection JEPI has offered. I believe JEPI has been a better investment as it’s generating a larger ROI than XYLD and a monthly income that is similar.
JEPI’s investment thesis and how it looks to achieve its goals
JEPI is an exchange-traded fund (ETF) managed by J.P Morgan Asset Management which falls under JPM. JEPI is a hybrid fund that looks to generate large amounts of income through monthly distributions while delivering capital appreciation. The fund managers have a focus on creating a fund with less volatility than the market and have selected positions they believe will offer less downside than the average companies found within the S&P 500. I would speculate that JEPI’s managers have succeeded in creating a less volatile fund as it outperformed the S&P 500 index over the past year and YTD in 2022.
JEPI’s primary structure includes investing at least 80% of its assets in equity securities. To generate income, JEPI can allocate 20% of its assets to ELNs. ELNs are structured as notes issued by counterparties, including banks, broker-dealers, or their affiliates, and designed to offer a return linked to the underlying instruments within the ELN. By investing 20% of its assets in ELNs, JEPI is able to create monthly income for its investors. Instead of writing covered calls on its positions, JEPI generates recurring cash flow from the premiums on the call options the ELNs write. This allows JEPI to generate income without sacrificing upside potential when the markets rise, as its 80% base of equities is not capped by covered calls. This is a different methodology than the Global X funds, as JEPI’s upside potential isn’t limited.
Why I think JEPI is a good option for both capital appreciation and income
I took a small sample consisting of the top 10 holdings from the Vanguard S&P 500 ETF (VOO) and looked at their 2022 EPS estimates, and compared this to the 2023 consensus estimate. I found that there is an 11.09% projected EPS increase YoY in these positions, with only Exxon Mobil (XOM) declining YOY.
The largest positions within VOO are:
- Apple (AAPL) 7.16%
- Microsoft (MSFT) 5.79%
- Amazon (AMZN) 3.29%
- Tesla (TSLA) 2.05%
- Alphabet Class A (GOOGL) 1.92%
- Alphabet Class C (GOOG) 1.79%
- Berkshire Hathaway (BRK.B) 1.5%
- UnitedHealth Group (UNH) 1.44%
- Johnson & Johnson (JNJ) 1.26%
- Exxon Mobil Corp 1.19%
The top ten positions of VOO make up 27.39% of the fund. I am going to look at their future projected earnings to determine the likelihood of the orange line in the chart above continuing to ascend in 2023.
|
2022 EPS Estimate |
2023 EPS Estimate |
YoY change |
% Increase |
|
|
AAPL |
$6.10 |
$6.44 |
$0.34 |
5.57% |
|
MSFT |
$10.19 |
$11.98 |
$1.79 |
17.57% |
|
AMZN |
$0.05 |
$2.29 |
$2.24 |
4480.00% |
|
TSLA |
$4.26 |
$5.83 |
$1.57 |
36.85% |
|
GOOGL |
$5.22 |
$5.94 |
$0.72 |
13.79% |
|
GOOG |
$5.22 |
$5.94 |
$0.72 |
13.79% |
|
BRK.B |
$14.34 |
$15.57 |
$1.23 |
8.58% |
|
UNH |
$21.83 |
$24.78 |
$2.95 |
13.51% |
|
JNJ |
$10.08 |
$10.61 |
$0.53 |
5.26% |
|
XOM |
$12.74 |
$10.63 |
-$2.11 |
-16.56% |
|
Total |
$90.03 |
$100.01 |
$9.98 |
11.09% |
This data leads me to believe that 2023 is setting up for a year of easy comps as expectations are low, and many of the largest companies are expecting to grow their EPS YoY. Since JEPI isn’t writing calls on its positions, if the markets do turn in 2023, it could just as easily outperform other high-yielding funds such as XYLD as its upside isn’t capped.
Conclusion
JEPI is a quality hybrid fund that offers large yielding distributions while having a structure that doesn’t mitigate its upside potential. 2022 has shown that JEPI is less volatile than other high-yielding covered-call ETFs and that it can provide additional downside mitigation than a standard S&P 500 ETF. If you’re looking for large yields, downside mitigation, and the ability to generate capital appreciation when the markets turn, JEPI is an interesting choice. Currently, JEPI has a yield that exceeds 10%, and with the markets trying to establish a bottom, I think it’s a great time to consider JEPI. Even if there is still further downside in our future, JEPI will continue to produce monthly income, and when the markets rebound, JEPI will continue to produce large amounts of income and should generate a larger ROI than XYLD.
Be the first to comment