

Japanese Yen Talking Points:
The Japanese Yen has finally started to stage some element of recovery after an aggressive 2.5 week spurt of weakness. While the currency was somewhat calm coming into the month of March, at least on a relative basis, a strong trend developed in USD/JPY, EUR/JPY and AUD/JPY. The big culprit was rate divergence as the Bank of Japan is sticking out as one of the few major Central Banks that’s not looking at rate hikes in response to inflation. And as we’ve discussed multiple times in these pieces, when carry trade themes start to come back, divergence potential with the Japanese Yen can spell for big moves. This was the reason that I was looking for bullish GBP/JPY setups coming into Q4, and that theme has continued to play-out as we now move into Q2, 2022.
But, now that the pair is going the other way – does that mean that rate hike prognostications are, too? Not necessarily. Price discovery is taking place in both of these markets at the same time and that’s why fx rates and spot prices aren’t always perfectly correlated. In JPY, this pullback seems to be more of a technical event after USD/JPY ran into the psychological level at 125, which has had a tendency to produce similar themes when coming into play over the past 20 years.
This same zone was resistance in USD/JPY in 2002 and 2007, followed by an inflection in 2015 after Shinzo Abe and Abe-nomics drove a 3-year pattern of weakness into the pair before finally topping out. But, around that episode is when Governor Kuroda had called out the 125.00 level in the pair as being significant and, ultimately, that helped to carve-out the top.
USD/JPY Monthly Price Chart
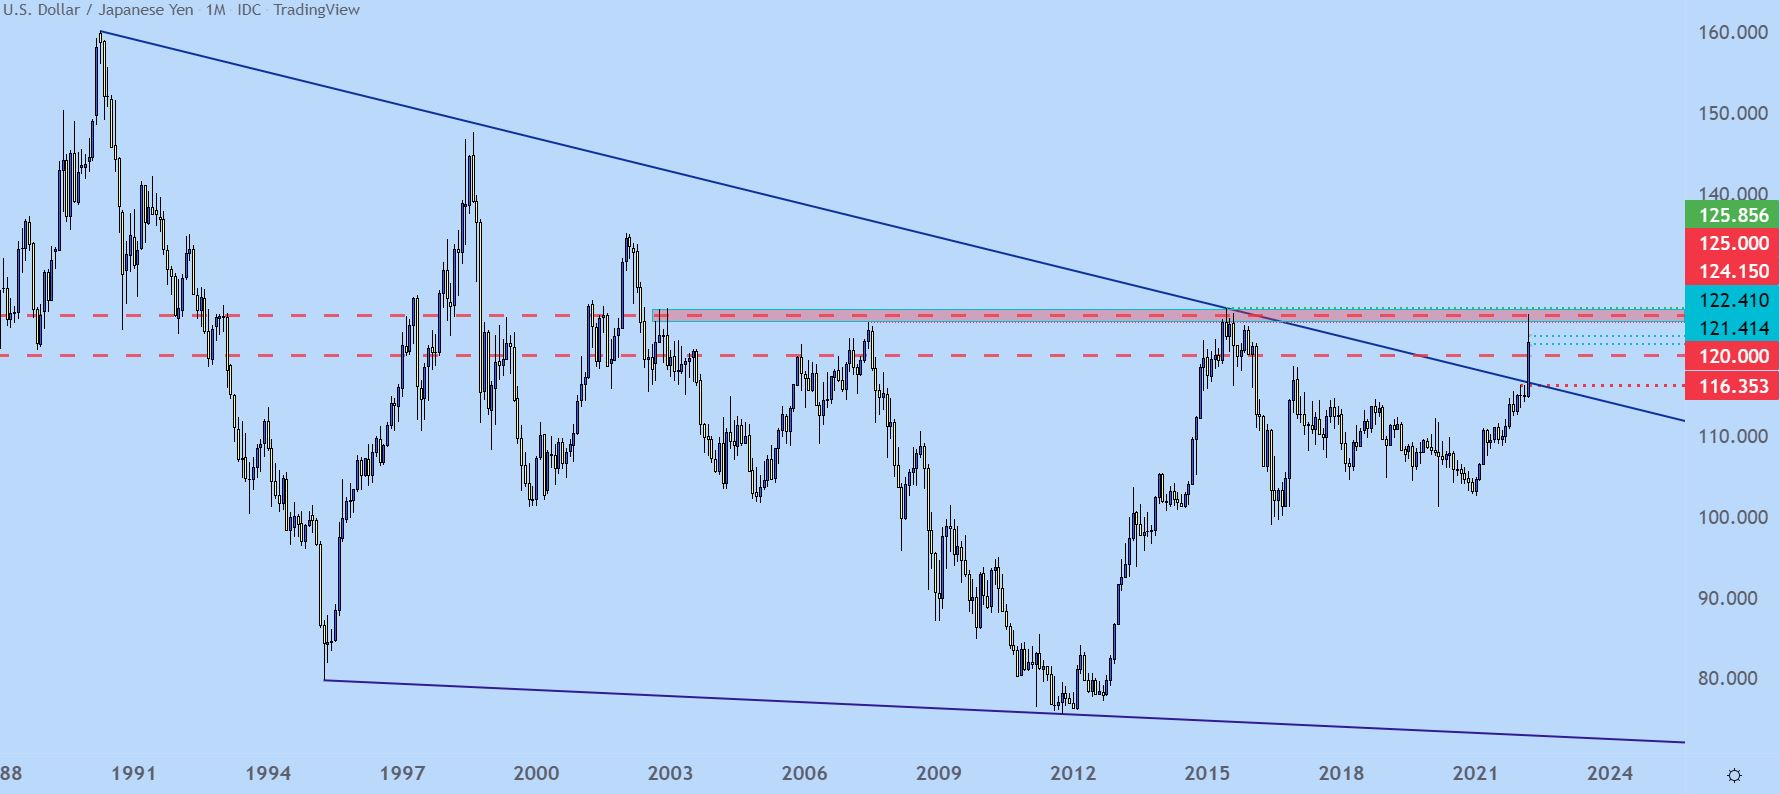
Chart prepared by James Stanley; USD/JPY on Tradingview
When Vol Picks Up, So Does the Magnitude of Price Swings
Given how aggressively USD/JPY had broken out, it makes sense that we finally reached a point that became difficult to draw fresh buyers in, and that’s what will often lead to a pullback as the supply/demand equilibrium shifts on the basis of price action.
The big question then is where do bulls re-load for the next trend side move, and there’s a couple of factors at play here, key of which will be tomorrow’s NFP report which can set risk trends in USD along with stocks and commodities. A strong employment reading may push the Fed further into the corner, forcing their hand even more with hawkish policy shifts later in the year.
As far as the longer-term trend, fundamentals still favor the long side but the question mark now is possible impact to BoJ intervention with USD/JPY testing a significant inflection point on the longer-term chart.
Shorter-term, the levels that I’ve been sharing over Twitter continue to apply. The 121.41 spot has held the lows on two separate occasions already, and prior support at 122.41 has been re-purposed as resistance. On a short-term basis, this appears to have a head and shoulders formation in here which could lead to a deeper pullback in that trend, possibly even targeting a re-test of the 120 psychological level.
USD/JPY Four-Hour Price Chart
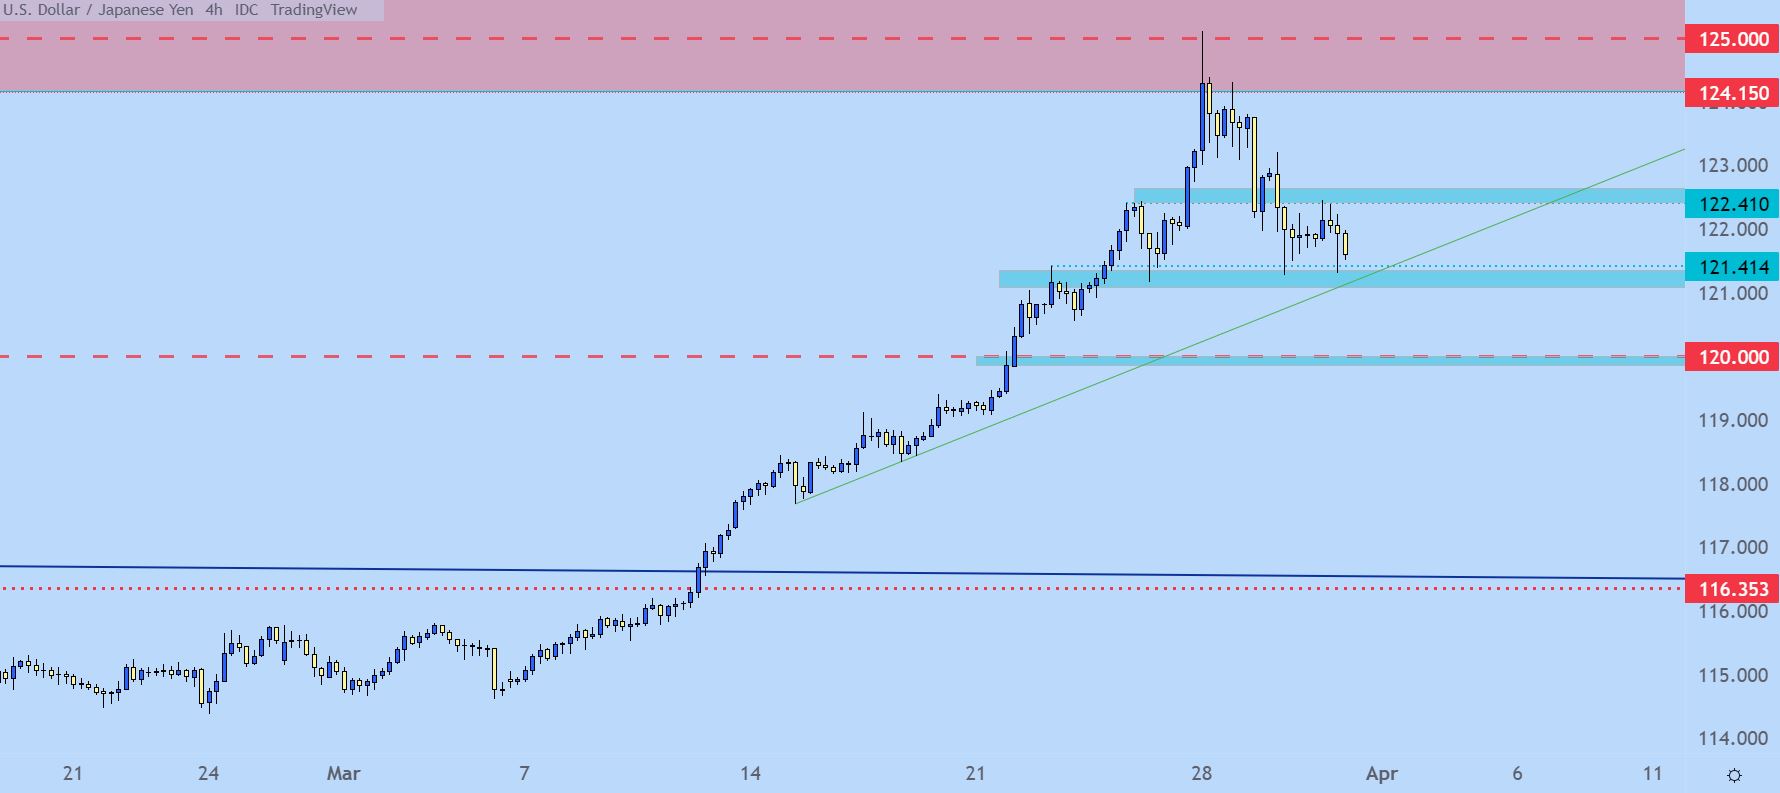
Chart prepared by James Stanley; USD/JPY on Tradingview
EUR/JPY Famine to Feast
The month started off terribly for EUR/JPY, with the pair breaking below the 125.00 level. But what started as a pullback soon turned into a reversal, and the pair launched higher as the month progressed and that JPY weakness theme took centerstage.
At this point, there’s building hopes for rate hikes out of the ECB. I’m skeptical that the bank will get too hawkish here and that could, possibly, reset the tables from a fundamental vantage point if/when those ECB rate hikes begin to get priced-out of the market. And that could lead to a greater reversal in the pair.
From a technical point of view it’s of interest that the incline stalled right at the 2017 swing high, plotted at the psychological level of 137.50. There has been a vigorous reaction since that level came into play but, at this point, the backdrop would remain as bullish for now. At this stage price is testing the 88.6% retracement from the 2018-2020 major move, and there would be support potential around prior swing-highs at 134.12 or 133.17.
EUR/JPY Daily Price Chart
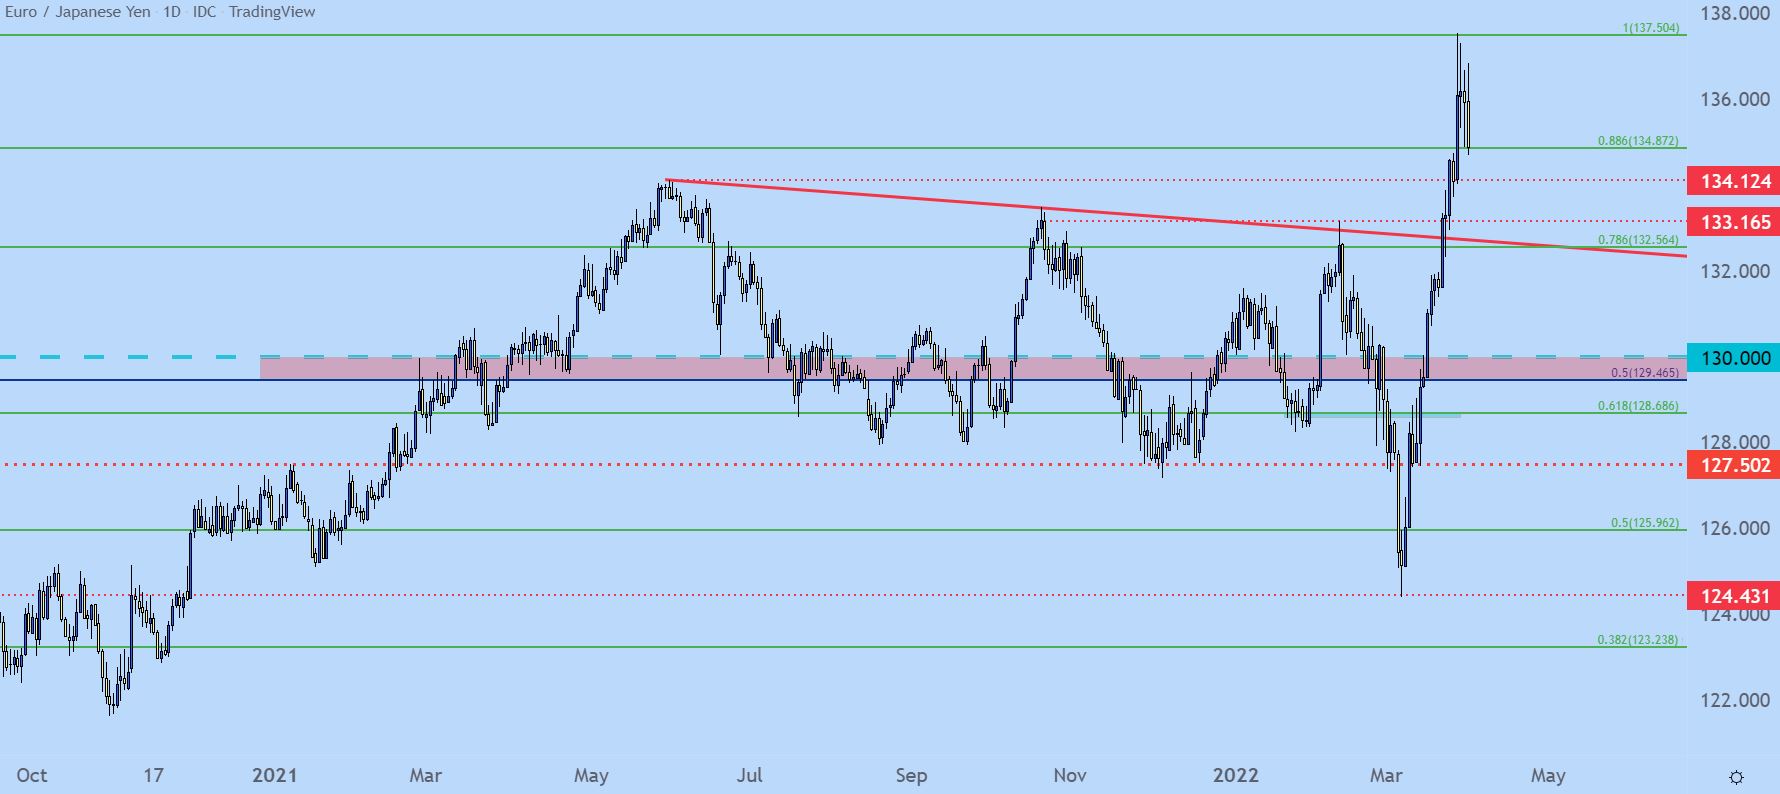
Chart prepared by James Stanley; EUR/JPY on Tradingview
EUR/JPY Longer-Term
The longer-term chart is where some bearish potential may be showing, as the hold of resistance at the six-year high opens the door for double top potential. But, this is a very long-term scenario so for the double top to fill-in, we’d need a test through the neckline of the formation which would plot around the 2020 low of 114.20. This is more than 2,000 pips away from current price and if it fills in, the formation would offer a projected target of another 2,000 pips, which would place spot prices at an all time low of approximately 94.20.
Perhaps coincidentally that’s right around the current 20 year low in the pair.
EUR/JPY Monthly Chart
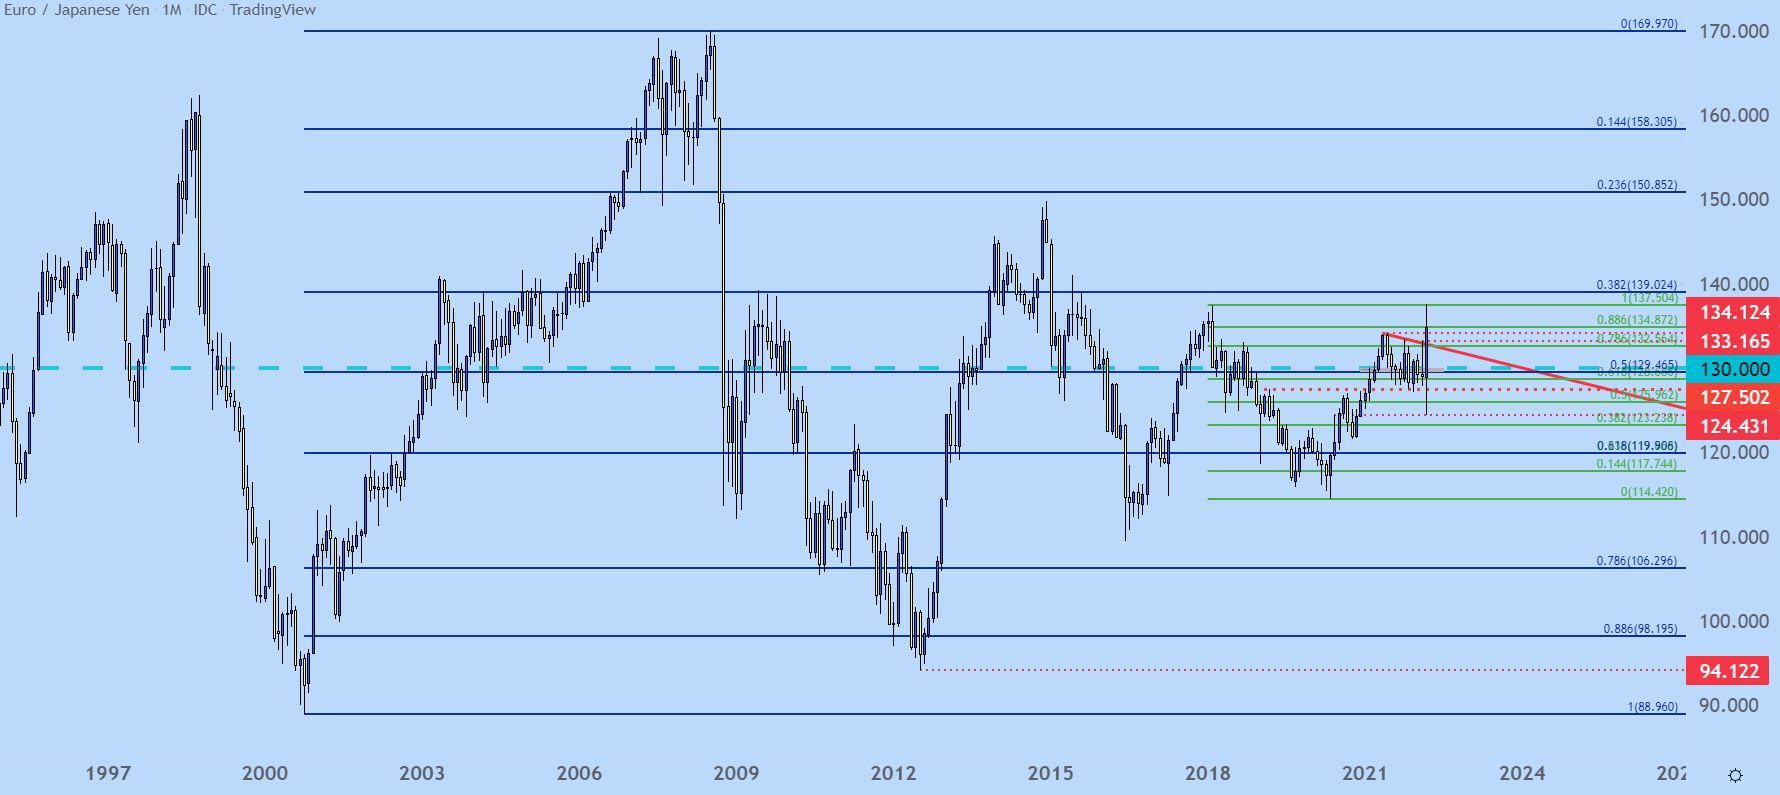
Chart prepared by James Stanley; EUR/JPY on Tradingview
GBP/JPY
I remain bullish on GBP/JPY on a longer-term basis and the rationale mentioned at the top of this article applies, looking for policy divergence to continue between the BoE and the BoJ.
But, from a technical basis this one appears to retain bullish potential, at least to a greater degree than EUR/JPY above. The pair broke out to a fresh six year high on Monday. And as Yen trends started to pullback, so did GBP/JPY. And, at this point, price is back to a spot of prior resistance, around the 160 psychological level.
There’s another spot of possible support around prior resistance, which was a previous five-year high set in October of last year. That spans all the way down around the 158 level, so timing bullish continuation on this pullback could be of challenge. But, there could be an opportunity off of current support and if that doesn’t hold, another possibility a little-lower.
GBP/JPY Weekly Price Chart
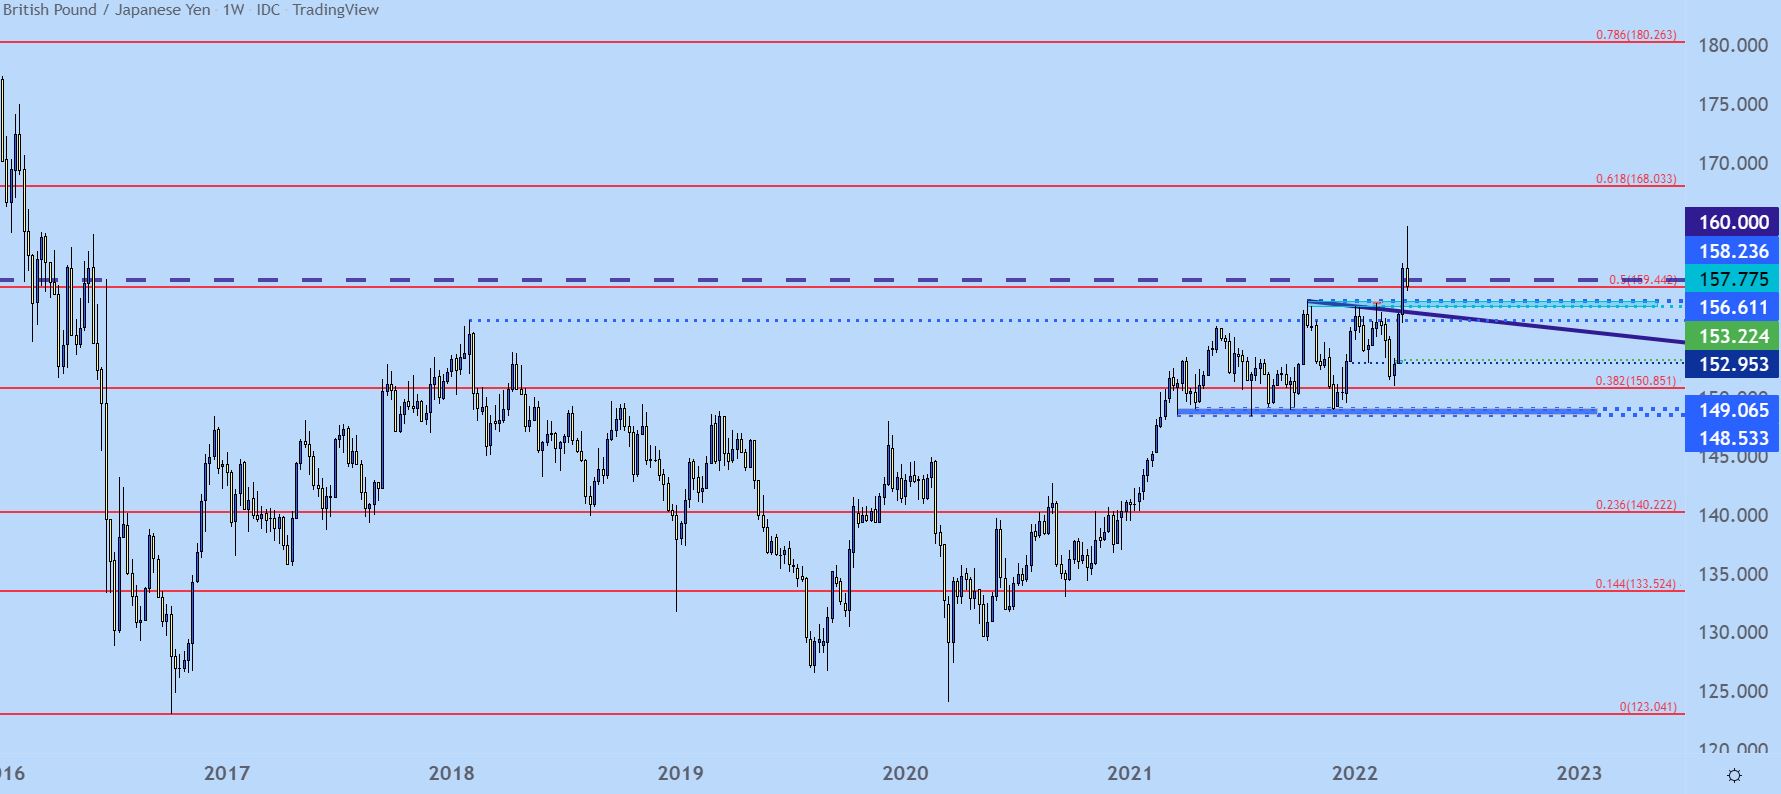
Chart prepared by James Stanley; GBP/JPY on Tradingview
GBP/JPY Shorter-Term
The daily chart below highlights possible support structure well, with the big zone around 160 currently being tested and another key zone below, around the 158 level.
GBP/JPY Daily Price Chart
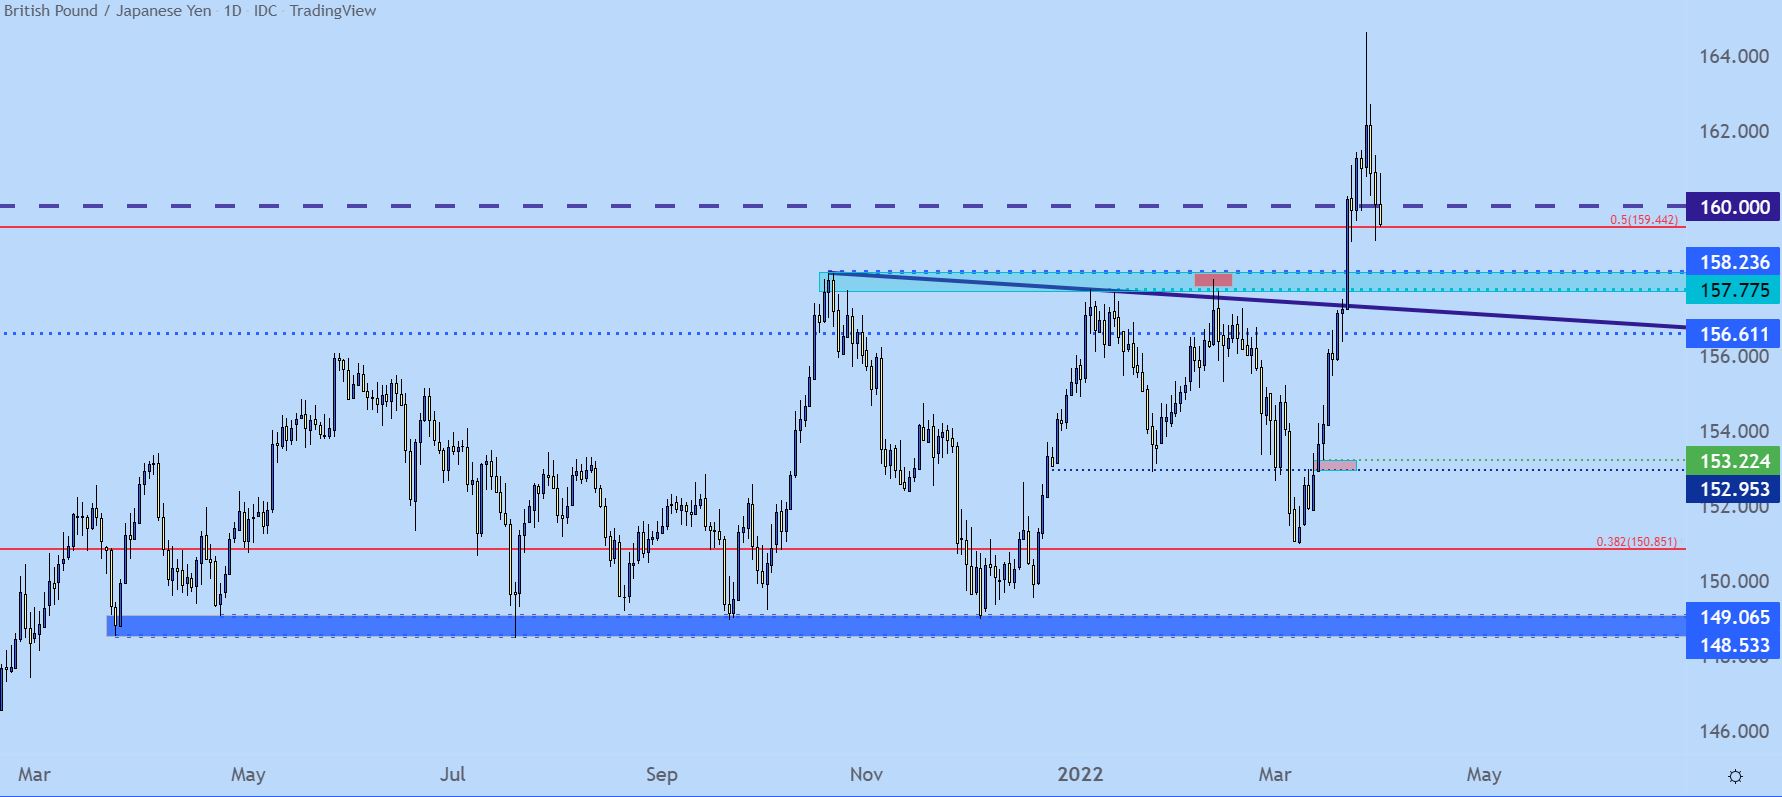
Chart prepared by James Stanley; GBP/JPY on Tradingview
— Written by James Stanley, Senior Strategist for DailyFX.com
Contact and follow James on Twitter: @JStanleyFX
Be the first to comment