Serge Cornu/iStock Editorial via Getty Images
Introduction
J Sainsbury plc (OTCQX:JSAIY) has materially underperformed the FTSE 100 index over the last six months. In this note I take a look at the FY22 result for the UK’s second largest supermarket group and provide an updated fundamental valuation assessment of J Sainsbury. The commentary below uses SBRY to refer to the group (this is also the stock code for J Sainsbury plc’s listing on the London Stock Exchange.)
Cost-of-Living Pressures
High rates of food price inflation are contributing significantly to the UK’s cost-of-living “COL” crisis. This is a major issue for both UK consumers and supermarket groups, and conditions are likely to get worse in the near-term. According to a recent report from the Office for National Statistics, UK prices for food and non-alcoholic beverages rose by 8.7% in the year to May 2022. The Institute of Grocery Distribution has forecast that UK food price inflation may hit 15% in the coming months, and will remain at high levels until mid-2023.
Faced with such rapidly increasing prices, it is no surprise that UK consumers are tightening their belts. Recent reports point to supermarket shoppers buying less (which the industry describes as a reduction in basket size) and switching to lower price products. The move to cheaper products is in part being facilitated by a shift away from branded items towards lower cost own-label products. Taking an industry level view, the COL crisis is likely to benefit the discount supermarket groups Aldi and Lidl at the expense of the Big 4 (Tesco, Sainsbury’s, Asda, Morrisons).
In my previous SBRY Seeking Alpha note published in late 2021, I pointed out that SBRY had taken important steps to become more price competitive against the discounters, and I argued that Aldi and Lidl would find future market share gains tougher to achieve relative to the pre Covid-19 era. The COL crisis has clearly weakened the validity of that argument, at least in the near term.
That said, relative to Big 4 peers, SBRY has done a good job of pulling the price lever to drive better outcomes. Chart 1 shows grocery market share movements based purely on volume. SBRY’s volume performance is significantly ahead of Big 4 peers, and only very slightly behind the overall grocery market. My expectation is that the Big 4 will underperform the discounters on volume for the duration of the COL crisis. An interesting question to consider is whether or not the COL-crisis-driven market share gains that will be achieved by the discounters will stick around once the inflationary environment normalizes. In 2023/2024, will some consumers who traded down and moved to Aldi and Lidl switch back to the better shopper experience that is available at SBRY? My sense is that some customers will indeed return, but that the discounters will hang on to the majority of the COL-crisis switchers. In that context, the outlook for SBRY is clearly more negative than I had anticipated back in December 2021.
Chart 1:
Source: FY22 Presentation, slide 5.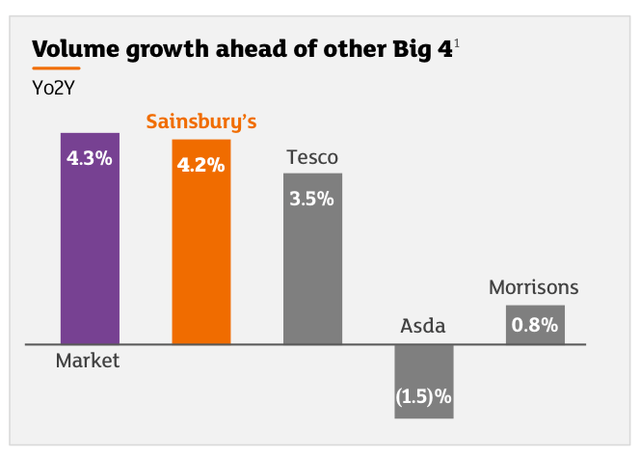
SBRY has traditionally been regarded as the premium offering of the Big 4, and hence the least attractive to shoppers in terms of value. Investors with this perception are likely to see SBRY as being the most heavily exposed to the risk of shoppers tightening belts during the COL crisis. SBRY has actually done a lot of work to makes its supermarket offer much more value-focused. The charts below show that SBRY has put through less price inflation than peers in key product lines, and that this has translated to volume gains versus Big 4 peers. The view that SBRY is a much more expensive shopping destination than Big 4 peers is therefore now likely to be out of date – however I’m sure that many shoppers and investors remain unaware of this change – in which case, there is a risk that SBRY suffers price-related customer losses (and associated negative investor sentiment) during the COL crisis based on dated perception rather than current facts.
Chart 2:
Source: FY22 Presentation, slide 35.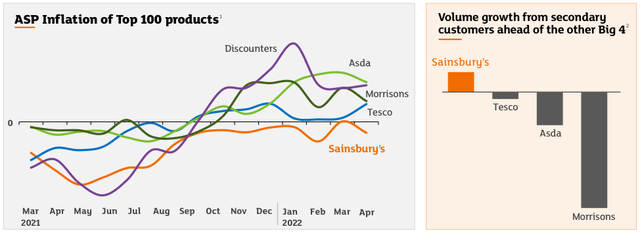
Strategic Cost Reduction – How Much Falls to the Bottom Line?
In order to reduce product prices and improve competitive positioning versus Big 4 peers and, more importantly, Aldi and Lidl, SBRY has undertaken a substantial cost reduction strategy. The goal is to reduce expenses relative to sales by 200bp from the FY20 base level and to do so by FY24. Chart 3 shows that SBRY has achieved 83bp of the 200bp target by the end of FY22. The company says that the cost-out strategy is ‘on track’ – but management have acknowledged that higher rates of inflation (compared to when the original plan was set) have made hitting the target a bigger ask.
Chart 3:
Source: FY22 Presentation, slide 18.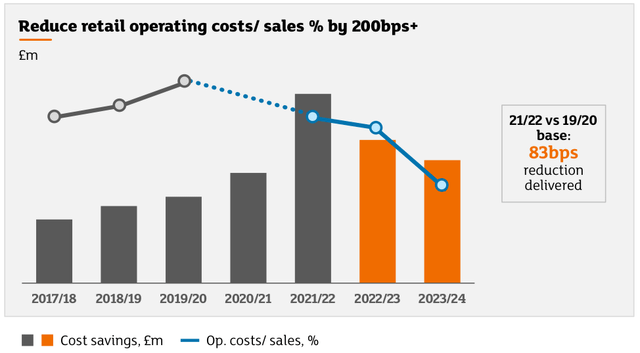
When it comes to cost-out, an obvious question to ponder is how much will be ‘reinvested’ into the franchise in terms of using lower customer prices to support market share (or volume). Chart 4 below shows that only 10bp of the 83bp cost saving completed to date has been captured in the operating margin – so we might conclude that almost all of the savings have been passed through to customer pricing. However, SBRY have confirmed that most of the 73bp margin decline relates to a normalization of bonuses from low levels in the FY20 base year. Putting the effect of bonuses aside, margins have actually expanded on sales relating to fuel, clothing and general merchandise, implying that operating margins on food have declined as intuitively expected.
Chart 4:
Source: FY22 Presentation, slide 17.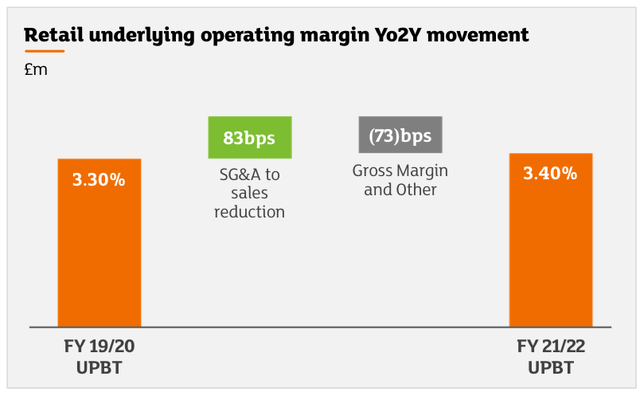
Where does the retail operating margin go from here? If SBRY hit their 200bp target, there is a further 117bp of cost-out to come. The UK supermarket industry is extremely competitive, and if we combine this with the pressure on pricing associated with the COL crisis, I cannot see much scope for the anticipated future cost-savings to result in further operating margin expansion. It is certainly possible that inflation and COL-crisis influences more than offset the positive margin impact of management actions on cost-out. For valuation purposes, I have opted to assume a retail operating margin of 3.30%, which is slightly lower than the FY22 actual retail operating margin of 3.40%. Given the aggressive cost-out targets, SBRY may actually do better than my valuation numbers assume – this represents an upside risk factor.
Pandemic Shopping Behavior Fading
Much has been written about how Covid-19 triggered ‘permanent’ changes in behaviors and activities for both workers and consumers. My expectation at the outset of the pandemic was that many of the changes observed would eventually normalize, and land back roughly around where trend lines were pointing to on the pre-pandemic trajectory.
Data from SBRY, summarized in the charts below, already points to a partial normalization of supermarket shopping habits. For in-store shopping, basket sizes are falling and transaction numbers are rising. In the online space, basket size is back in line with pre-pandemic norms, but order numbers have risen noticeably. Given that the pandemic was certainly nowhere near to being ‘a thing of the past’ by the end of FY22, I think that we can expect to see further normalization coming through in the FY23E data. SBRY pointed out that online grocery penetration is now running at close to 15%, as compared to the FY22 average of 17%.
Chart 5:
Source: FY22 Presentation, slide 30.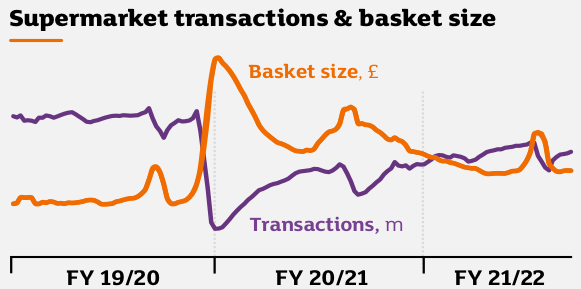
Chart 6:
Source: FY22 Presentation, slide 30.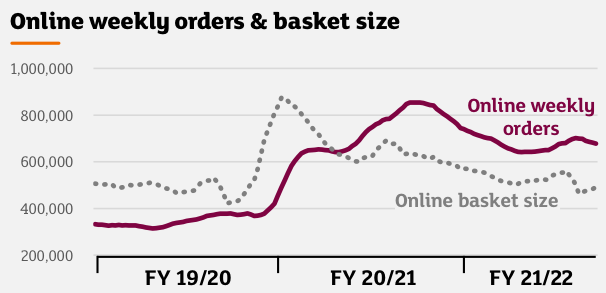
Valuation Analysis – Normalized Earnings Approach
To construct a 1-year forward normalized EBIT for SBRY, I have made a number of assumptions, adjustments and allowances, including:
- Adjust for lease accounting expenses that are reported through the finance costs line.
- Remove EBIT relating to Financial Services (as I value this division separately, applying a multiple of reported book value).
- Assume Retail sales of 8.2% below FY22 sales (broadly equivalent to sales being 5% lower than pre-Covid-19 levels).
- Assume a Retail profit margin of 3.3% (slightly below the FY22 Retail profit margin of 3.4%).
- Allowance for normalized expenses relating to restructuring and other ‘below-the-line’ items of ~£50m pa.
Table 1 below sets out my calculation of AEV/EBIT, where AEV is the adjusted enterprise value, and EBIT is my normalized 1-year forward EBIT, as described above. To arrive at AEV, I make the following adjustments and allowances:
- Allowance for Financial Services at 0.5x reported book value.
- Adjust reported net debt for seasonality in working capital, and consideration as to how much of the reported cash holdings are available for investment.
- Remove lease liabilities from reported net debt.
- Allow for dividends and profits post balance date.
- Allow for residual restructure costs relating to the Save to Invest program announced in November 2020.
Table 1:
Source: Created by author using data from SBRY financial reports.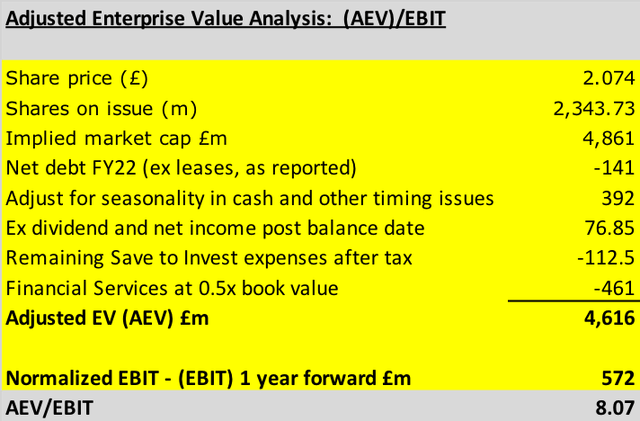
For a large supermarket group such as SBRY, I would typically regard an EV/EBIT multiple in the range of 12.5x to 14.8x as representing around fair value. Based on a current share price of £2.074, my analysis points to SBRY trading on a EV/EBIT multiple of ~8.1x.
A sensible question for readers to ask is whether or not my normalized EBIT number is too optimistic. SBRY has published the following sell-side analyst numbers for FY23E underlying profit before tax (as at 16 June 2022):
- Consensus = £641m
- Minimum = £600m
- Maximum = £680m
The sell-side analyst numbers above include Financial Services (which my valuation EBIT excludes). SBRY has given FY23E underlying operating profit before tax guidance for Financial Services to be above the £38m delivered in FY22. If I assume that the sell-side is allowing £45m for Financial Services, then I get to:
- Consensus ex-Financial Services = £596m
- Minimum ex-Financial Services = £555m
- Maximum ex-Financial Services = £635m
If I then exclude my allowance for normalized expenses relating to restructuring and other ‘below-the-line’ items of ~£50m pa (on the grounds that the sell-side is unlikely to have made this type of conservative adjustment), then on an ex-Financial Services bases, my valuation settings point to underlying profit before tax of £583m. The earnings used in the valuation summarized above in Table 1 are therefore ~2.2% below Consensus, ~5% above the sell-side minimum and ~8.2% below the sell-side maximum. I therefore conclude that my valuation is based on earnings that are slightly conservative relative to market forecasts.
Summary & Rating
The near-term outlook for SBRY and Big 4 peers is very challenging. The COL crisis impacts are already being felt by consumers and will get worse from October 2022 onwards when the UK’s energy price cap lifts again, with heating requirements increasing as the UK enters the colder months. Discretionary spending will be further squeezed as higher interest rates feed through into bigger mortgage repayments. In addition to customers being more cautious with their weekly food shops, we are also likely to see spending on general merchandise coming under pressure, which will negatively impact sales for Argos.
Analysts focused on prior-period trends are likely to be disappointed by the rolling-off of the higher sales volumes that supermarkets captured during Covid-19 (this benefit was always going to fade, but some market commentators will choose to forget that point when they publish updates on the softer FY23E results). I note that SBRY’s guidance for FY23E underlying profit before tax of between £630m and £690m compares with the FY22 underlying profit before tax of £730m – so the fading of the Covid-19 boost is being well-flagged by the company. A fairer comparison for FY23E would be against the FY20 underlying profit before tax result of £586m.
SBRY will continue to strip cost out of the business, and management argue that the group has much more scope in this regard than peers. In order to defend against the discounters, good execution on the cost-out strategy is vital.
Looking beyond the near-term outlook, and focusing on valuation, SBRY looks to be very cheap. At £2.074 per share (London Stock Exchange market close 01 July 2022), SBRY is trading on a EV/EBIT multiple of ~8.1x. At such a low multiple, I would ordinarily be giving SBRY a STRONG BUY rating. However, the negative near-term influences combined with much higher than usual levels of economic uncertainty regarding inflationary concerns lead me to land at a BUY rating. I also note that investors looking for income may find the expected dividend yield of ~6% pa attractive.


Be the first to comment