

shaunl/E+ via Getty Images
Introduction
In addition to my dividend (growth) and related investment ideas I share on Seeking Alpha, I believe it is extremely important to cover important macro developments that impact sectors, industries, and whole economies. On April 2, I wrote an article titled “IYT Transportation ETF: Outlook And Alternatives.” In this article, I’m going to cover the same iShares Transportation Average ETF (BATS:IYT) again, as it is the best ETF that covers all major transportation segments. This is easier than covering individual stocks – especially when discussing macro trends.
FINVIZ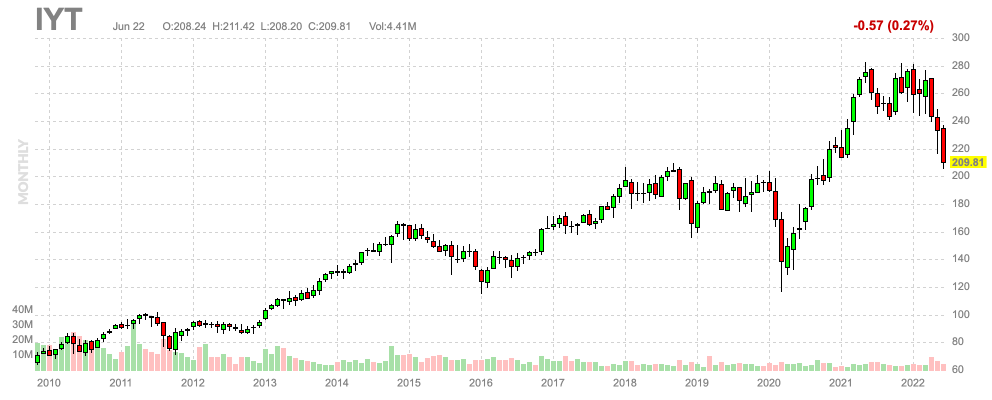
Moreover, excluding aerospace, my portfolio consists of 15% transportation exposure. Almost half of my stocks are industrial stocks. In other words, being on top of business trends in transportation is very important – besides that, I need it as part of my macro view anyway.
Author Portfolio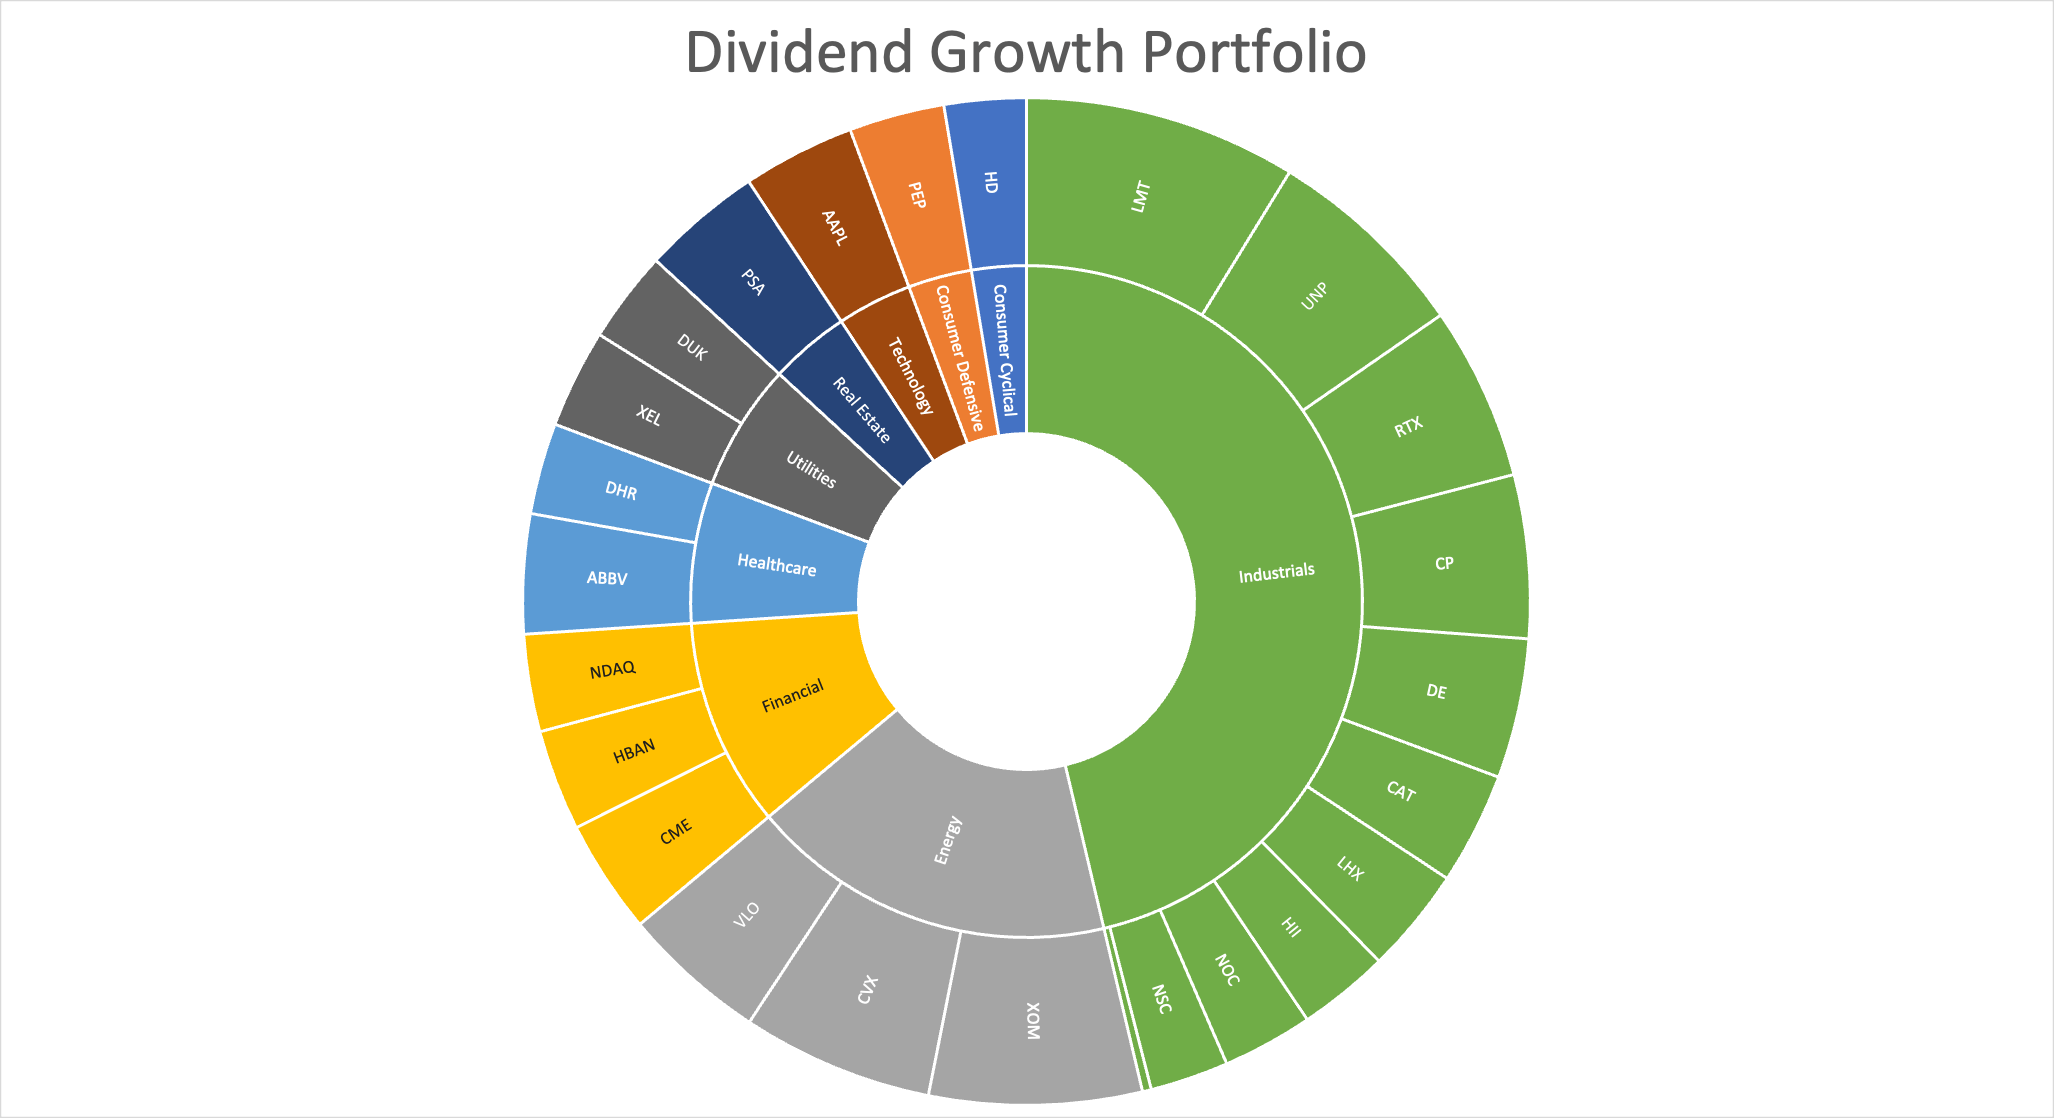
In this article, we get to discuss a lot of bad news. Economic demand is weakening, supply chains are still severely damaged, and transportation companies face lower margins.
The good news is that investors can buy quality companies at much better prices.
Now, let’s look at the details.
Economic Growth Is Weakening
One of the issues I raised in my last article was weakening economic indicators.
The graph below shows the ISM manufacturing index (orange) and the logarithmic chart of the IYT ETF. The ISM index is a monthly conducted survey that tells us where economic growth is headed. Right now, it’s down. While I am writing this, we just got the number for March: 57.1. While that is 7.1 points above the neutral 50.0 number, it’s another low in the current cycle. Hence, if history is any indication, investors will de-risk their portfolios. Right now, that’s causing IYT to roll over.
If we look at data from the New York and Philadelphia Fed manufacturing survey (moving in lockstep with the ISM index, but reported a few weeks earlier), we see that manufacturing sentiment has entered contraction territory for the first time since 2020. Since April, sentiment has pretty much fallen off a cliff.
Author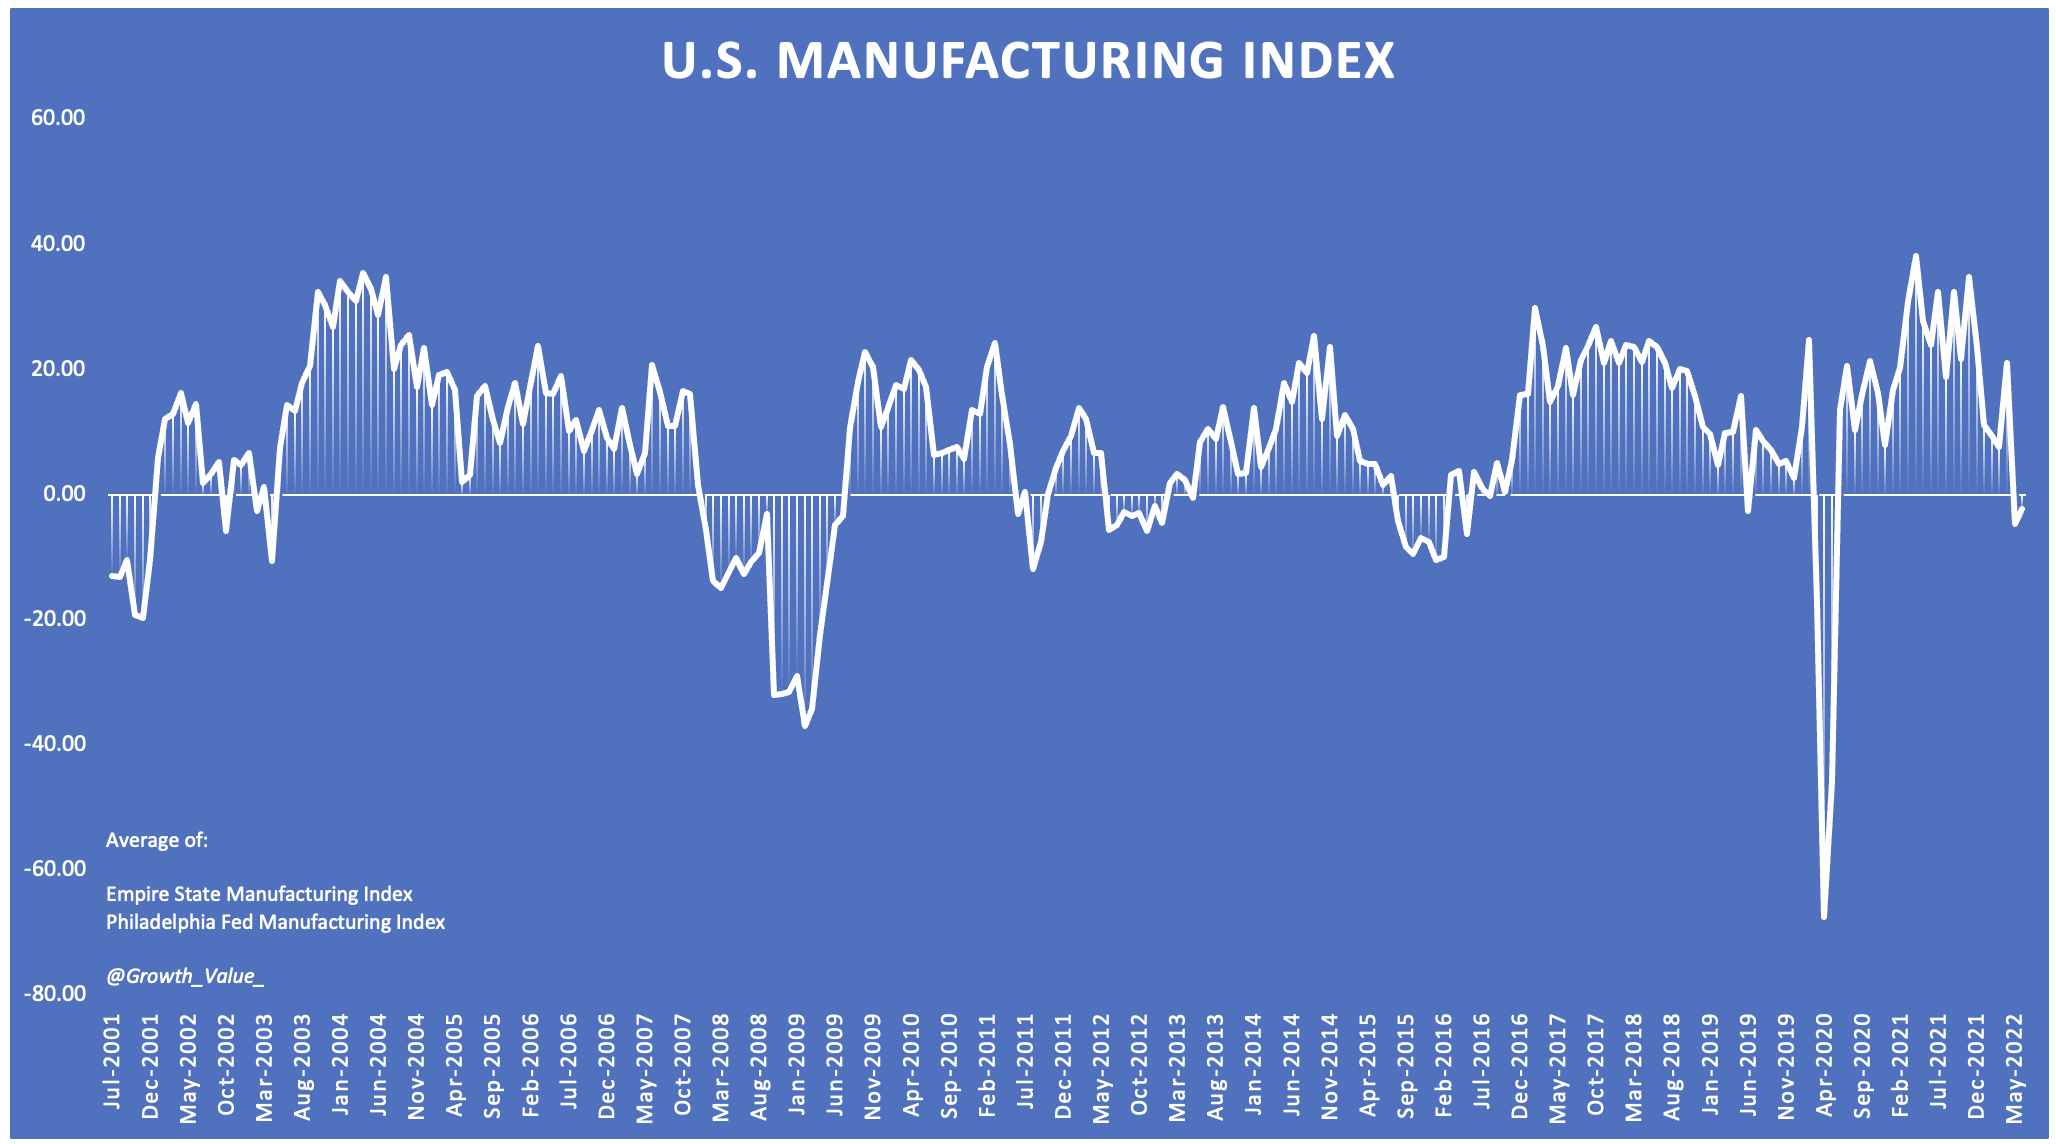
What does this mean for transportation stocks? It’s bad news. The best thing about transportation stocks is that they follow economic trends so well. The graph below shows the comparison between IYT and the manufacturing index above. It’s a good thing that the correlation is high, as it makes assessing the risk/reward easier. That’s a good thing, even though we’re currently witnessing weakness.
Author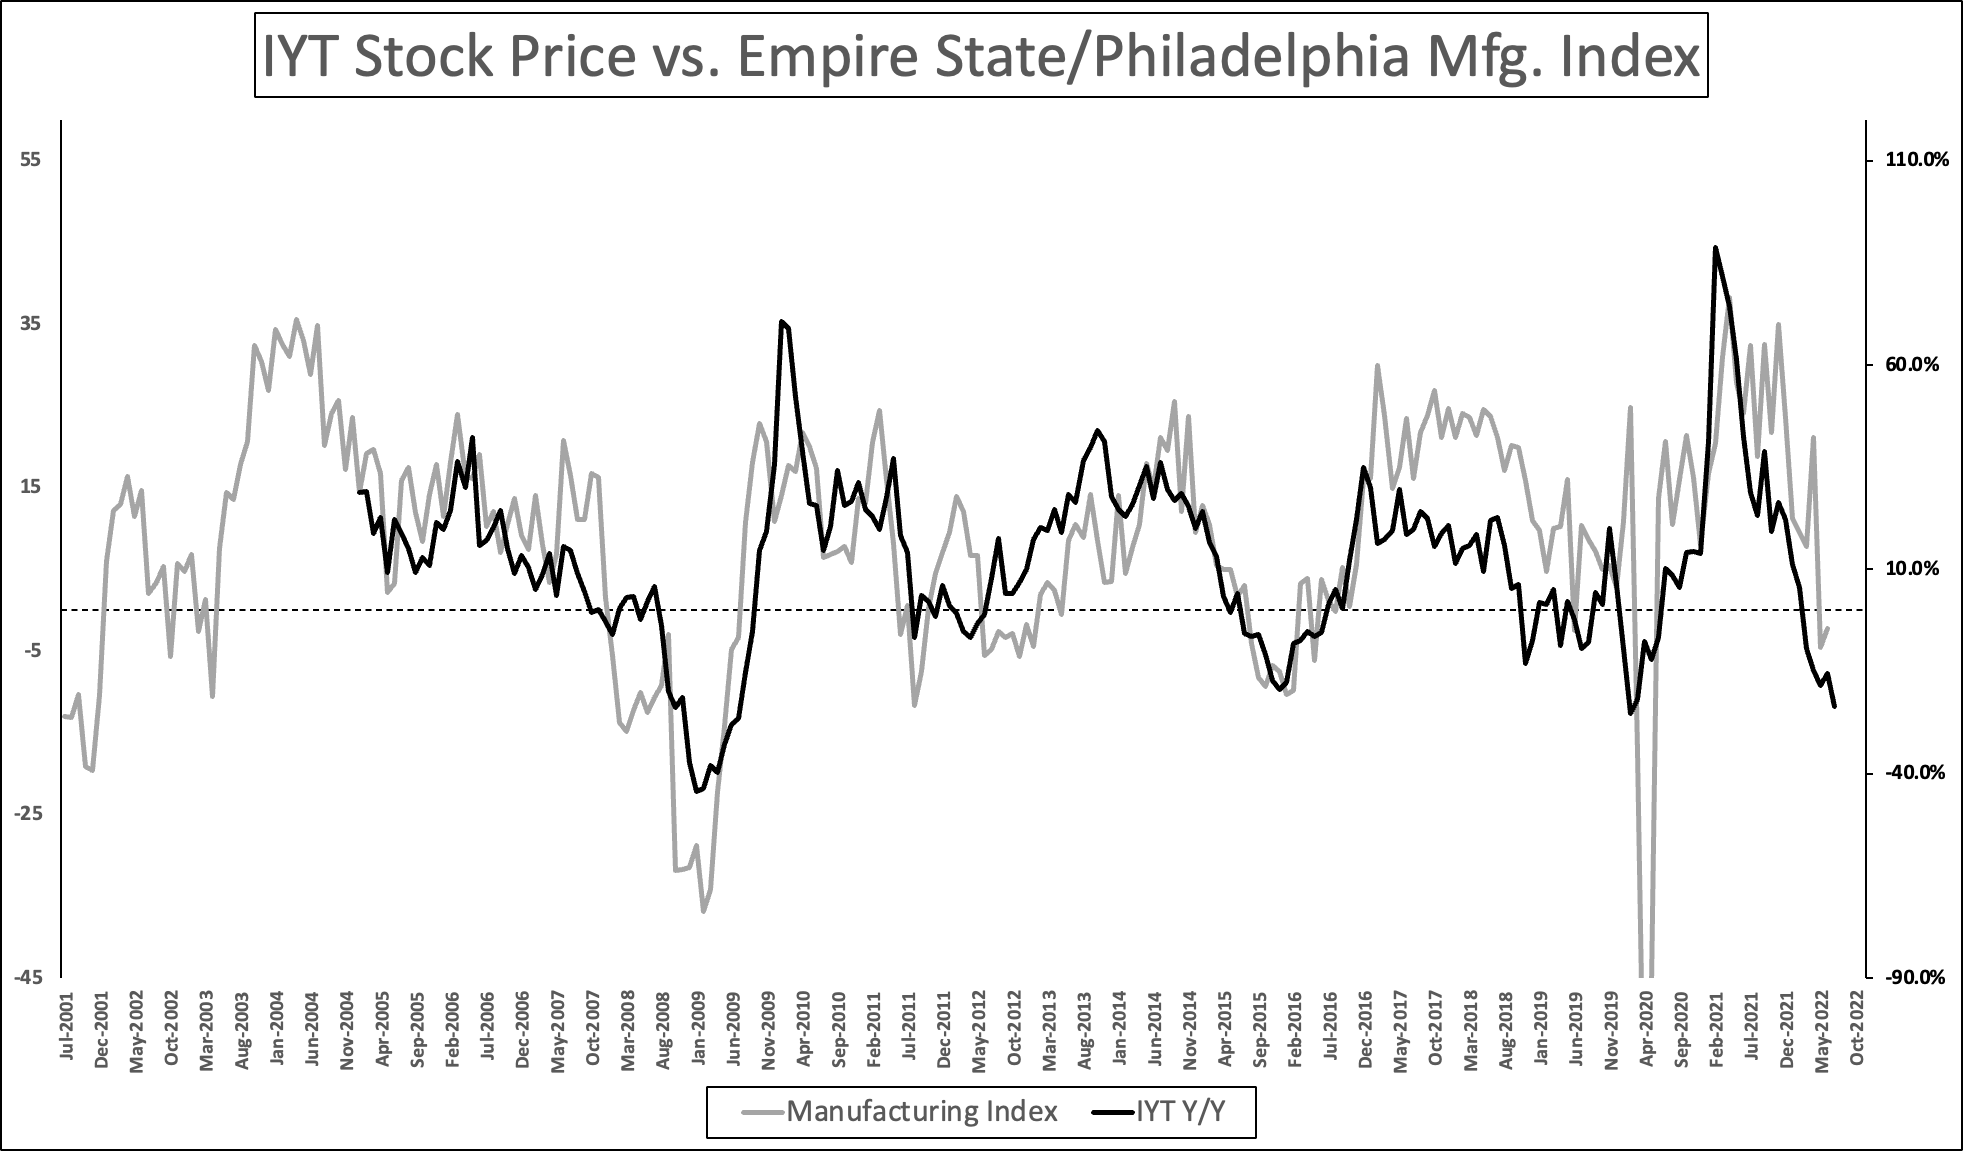
Transportation stocks have lost a quarter of their value, which makes this one of the worst sell-offs since the Great Financial Crisis. The 2020 pandemic panic sell-off was roughly 30%. The 2015 manufacturing recession was similar to the current bear market. The 2018 sell-off was slightly less bad and followed by a quick recovery.
Author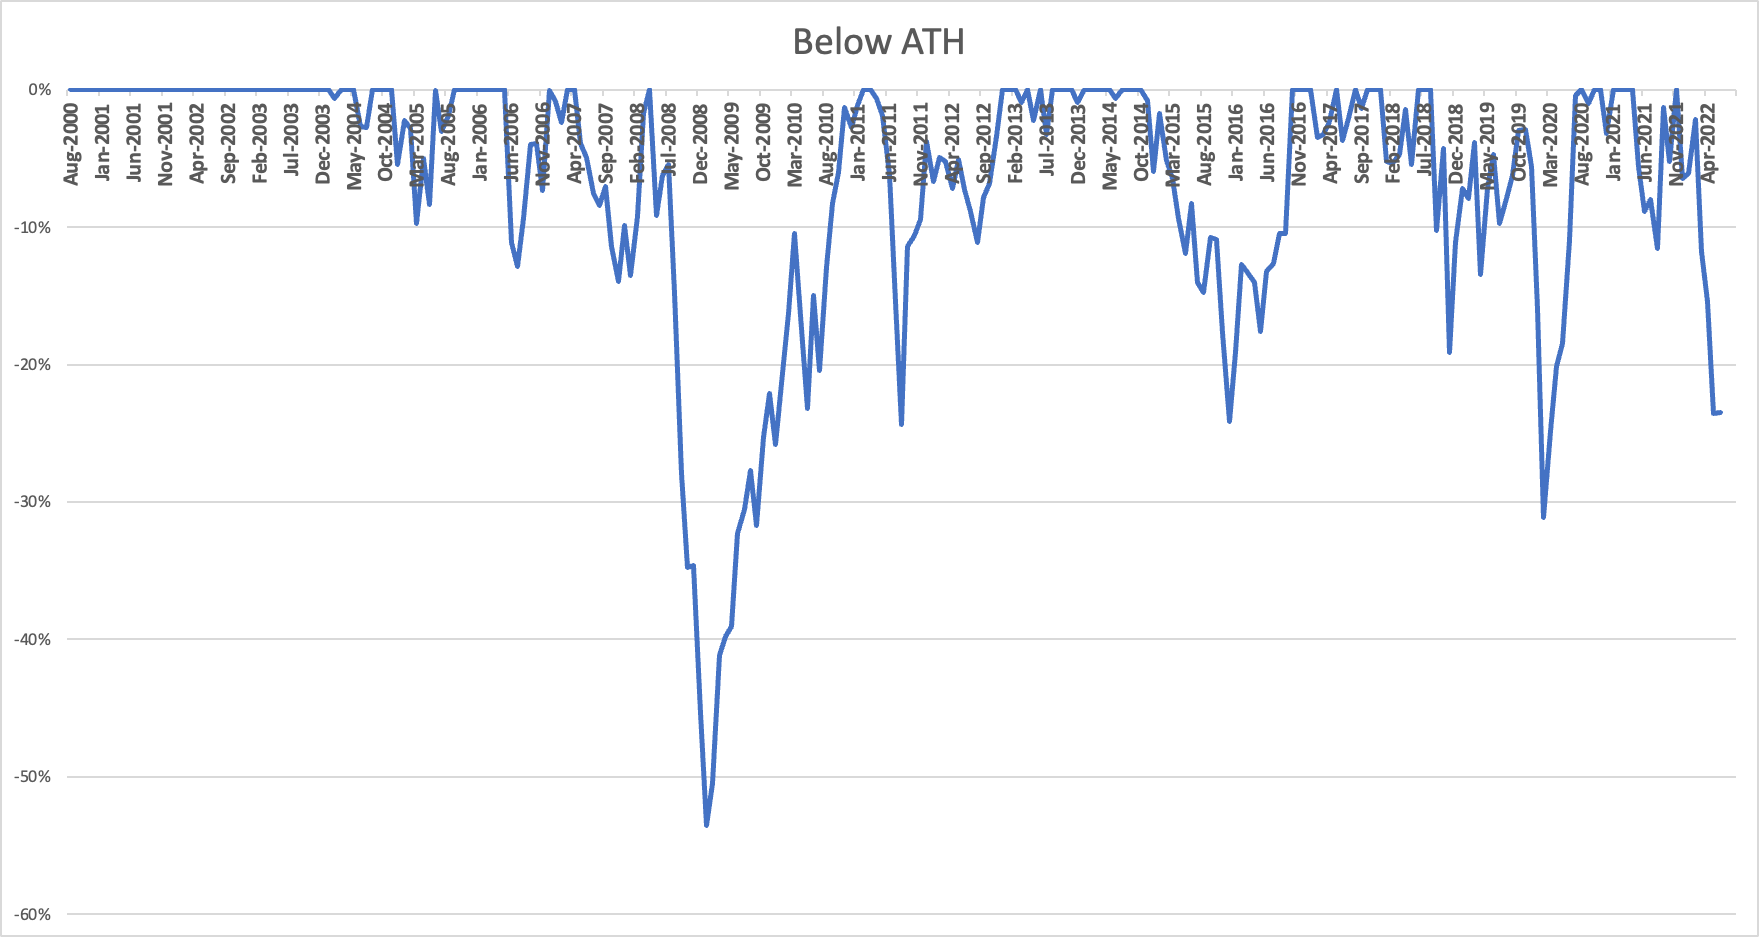
Technically speaking, I could start writing a conclusion right about here.
However, it’s important to look into the details, which tell us a lot about the economy – even if you don’t care for transportation stocks.
Supply Chains Are Hurting Transportation Stocks
The other day, I read a fascinating article on Freight Waves (no affiliation), covering supply chains, freight carriers, and problems facing American transportation companies.
One of the biggest problems transportation companies are facing is the “bullwhip effect.” This is hurting ocean freighters, railroads, and trucking companies. So, pretty much every company doing business that involves shipping containers/intermodal.
The definition (as seen below) basically describes issues that started after the 2020 pandemic lockdown.
The “bullwhip effect” is a term used in supply chain circles to describe a scenario in which temporary surges in retail demand are magnified and exaggerated by upstream manufacturers and suppliers, who rapidly increase production well beyond the level that can be supported by consumers. Eventually, retailers find themselves with more inventory than they can sell, and what started as a goods shortage ends up as a goods surplus.
Moreover, and referring to the chart below (emphasis added):
Before COVID, the ratio of containers per shipment was fairly static and the two indices moved in tandem. Beginning in the summer of 2020, the container-to-shipment ratio exploded as Big Box retailers used their leverage to move more containers into their scheduled shipments. Smaller importers kept their container-to-shipment ratios more static, finding it harder to secure additional capacity on container vessels.
However, because of high inflation and the war in Ukraine, which made things worse, people cut back on spending, leaving companies with too much inventory.
Freight Waves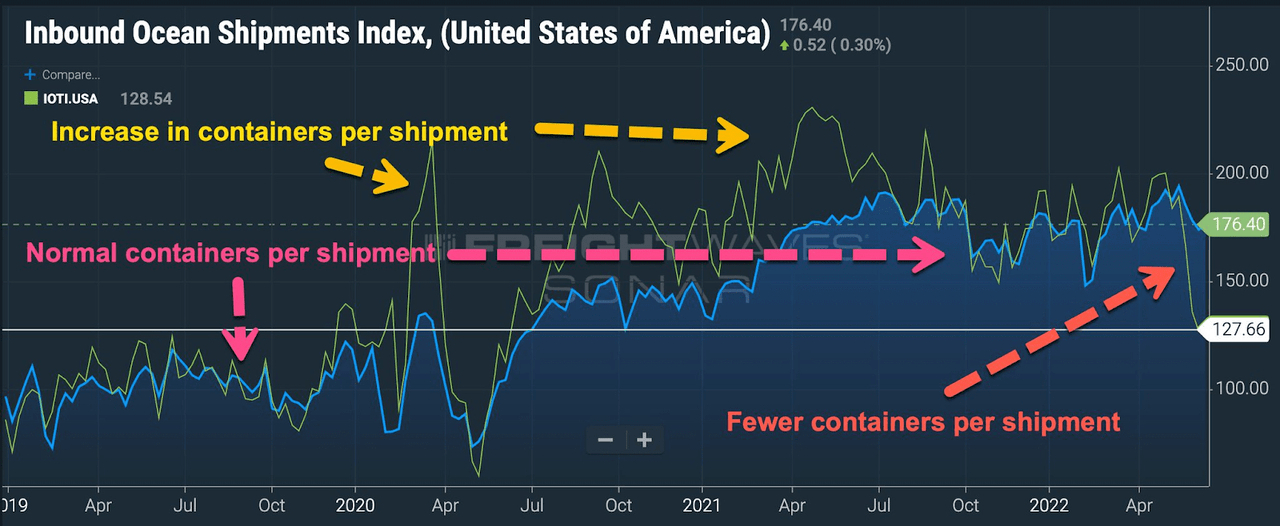
Almost 80% of container goods imported in the United States were from industries that had massive supply gluts (i.e., retail, electronics, furniture, clothing, and appliances).
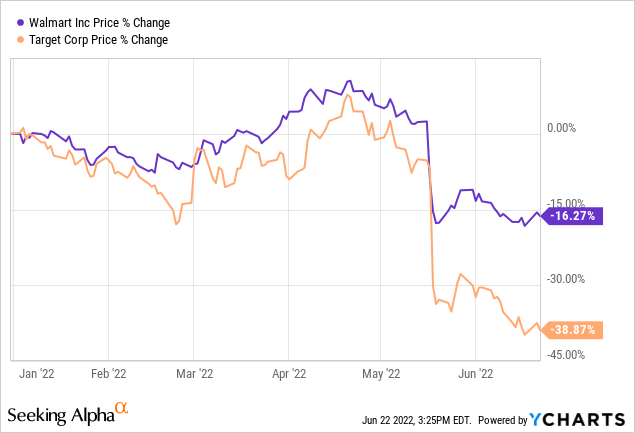
Two of the biggest players in that area are Walmart (WMT) and Target (TGT). Both sold off after earnings, as both had to deal with too much inventory hurting margins.
These two giants imported 1.7 million TEUs (containers) in 2021. That’s 7% of all US container imports.
What’s interesting – or worrisome – is that Samsung (SSNNF, SSNLF) is now facing a bullwhip effect as well, as it has asked upstream suppliers to cut back production by as much as half in the month of July. Remember, Samsung is a major player in electronics, chips, and related. It’s a company that did tremendously well when shortages were a major issue.
Going back to the Freight Waves comments, the article showed a chart that perfectly displays the demand reversal from restocking inventories to reducing inventories. The green line shows global shipments. These are minus 8%. Container bookings are far worse, currently down 36%.
Freight Waves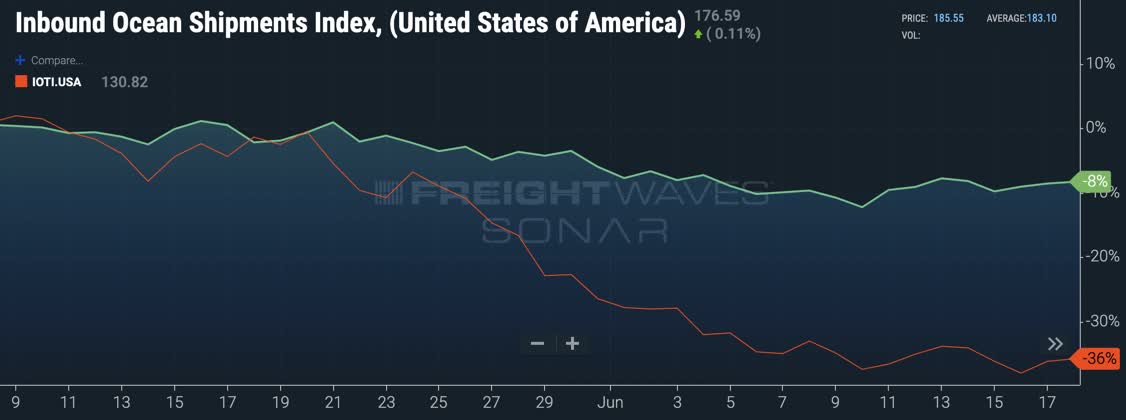
Big box companies can quickly reduce orders as supply chains are extremely efficient. Smaller importers have more trouble.
With regard to another space of transportation, trucking, we should expect softness in the trucking market in July.
According to Freight Waves (referring to the chart below):
At this point in time, the trucking market continues to weaken. This is very concerning for mid-June (normally one of the hottest months in freight). The national spot index 7-day rolling average dropped from $2.07/mile on June 1 to $1.96/mile on June 20th.
Freight Waves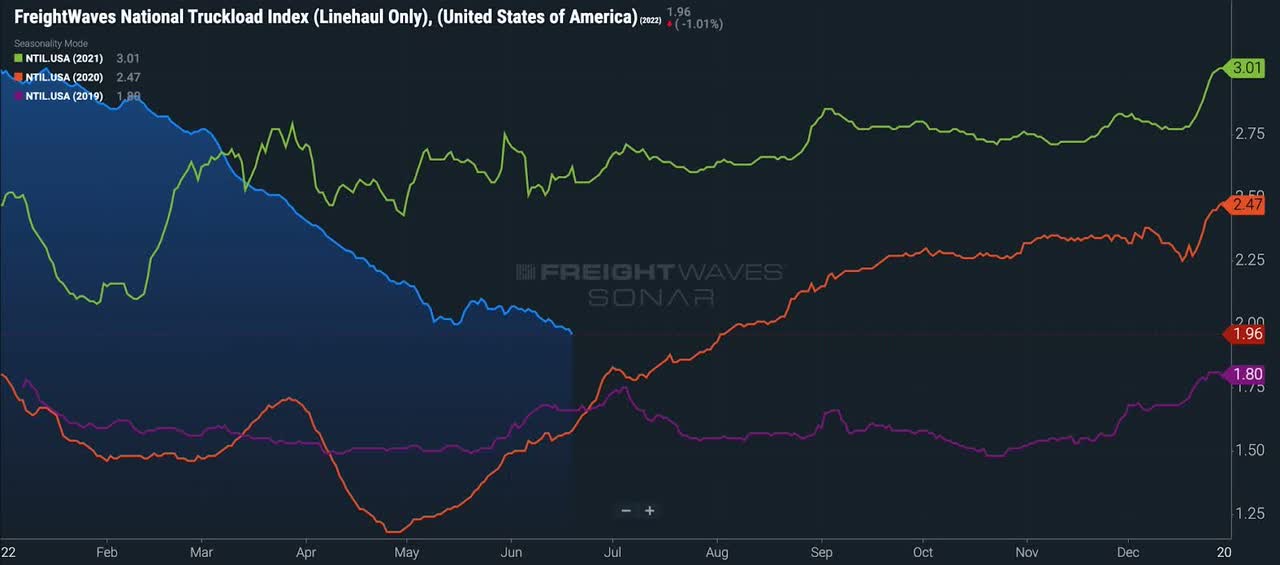
Moreover, total tender rejections, an indicator of trucking capacity conditions, declined to a new cycle low of 7.7%. In other words, trucking companies are losing pricing power.
Adding to that, while ocean freight carriers have better pricing power than trucking companies, their rates are dropping at a fast pace as well as American Shipper data shows.
Freight Waves/American Shipper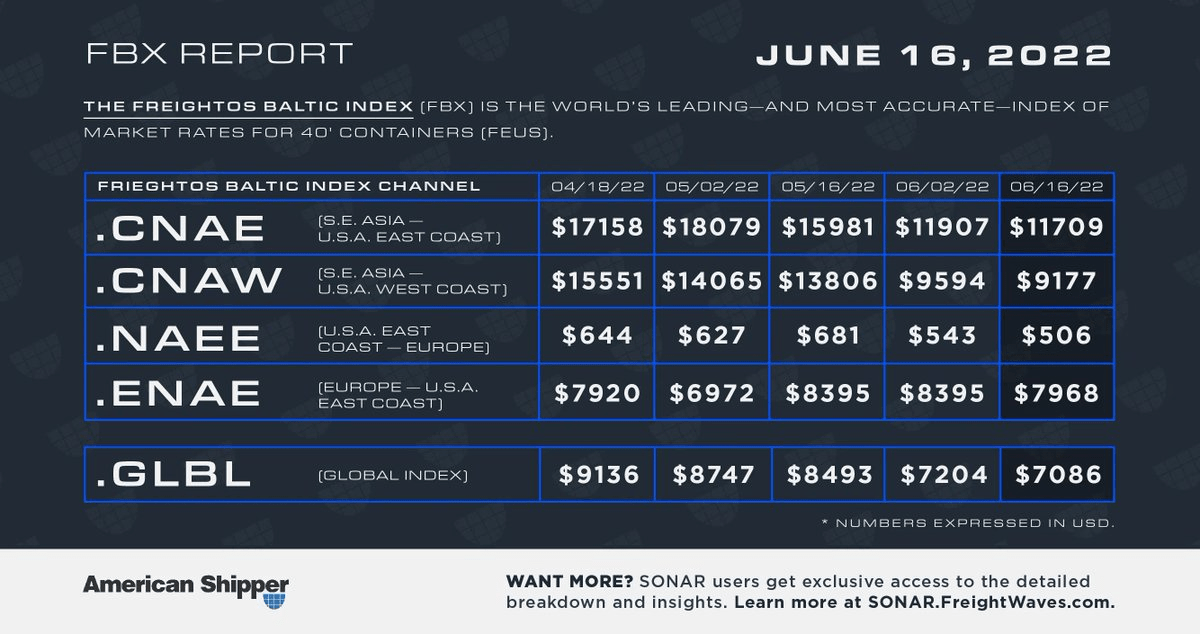
So, does every chart go down?
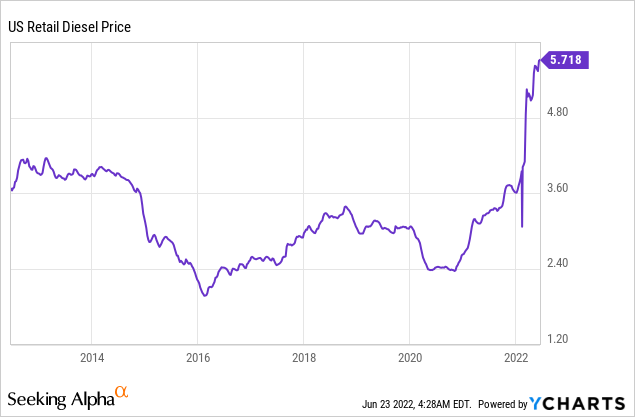
No, not every chart. The ones that go up are the ones that shouldn’t be up. For example, diesel prices are coming dangerously close to $6.00 per gallon, adding to the pressure on margins as lower demand is now resulting in lower prices – which is the case in a “normal” cycle.
With that said, let’s take a closer look at the IYT ETF.
Thoughts On The IYT ETF
I own a lot of railroads, and I have a number of trucking companies on my radar. Not just because I monitor them for comments and insights into the health of the economy, but also because most of them offer great long-term shareholder value.
IYT, being an ETF, combines all of these companies. Hence, taking away the need for people to pick single stocks. Or, for analysts, it makes it easier to track transportation stocks in general.
Owned by BlackRock, the iShares ETF has an expense ratio of 0.41%, which I believe is rather high. In my prior article, I commented this:
This means I prefer the ETF as a trading vehicle to “buy low and sell high” instead of a long-term investment alternative. I don’t want readers to (indirectly) pay their asset manager 0.41% per year. If investors want long-term exposure without too much risk, I suggest buying 1 railroad, 1 air freight and logistics company, and 1 trucking company.
If you’re interested in an alternative – as discussed in the quote above – feel free to read my prior article, as there I highlight a way to buy diversified transportation exposure without the use of an ETF.
Established in 2003, the ETF is the largest transportation ETF with a daily volume of roughly 160 thousand shares and close to $800 million in assets under management.
The ETF has a 30-day SEC (dividend) yield of 0.93%. Please ignore that, as I don’t recommend dividend investors to buy IYT. The expense ratio is simply too high.
The good news is that IYT is extremely well-diversified. Investors get high exposure to railroads, air freight and logistics, and trucking. With smaller exposure to airlines and marine transportation.
iShares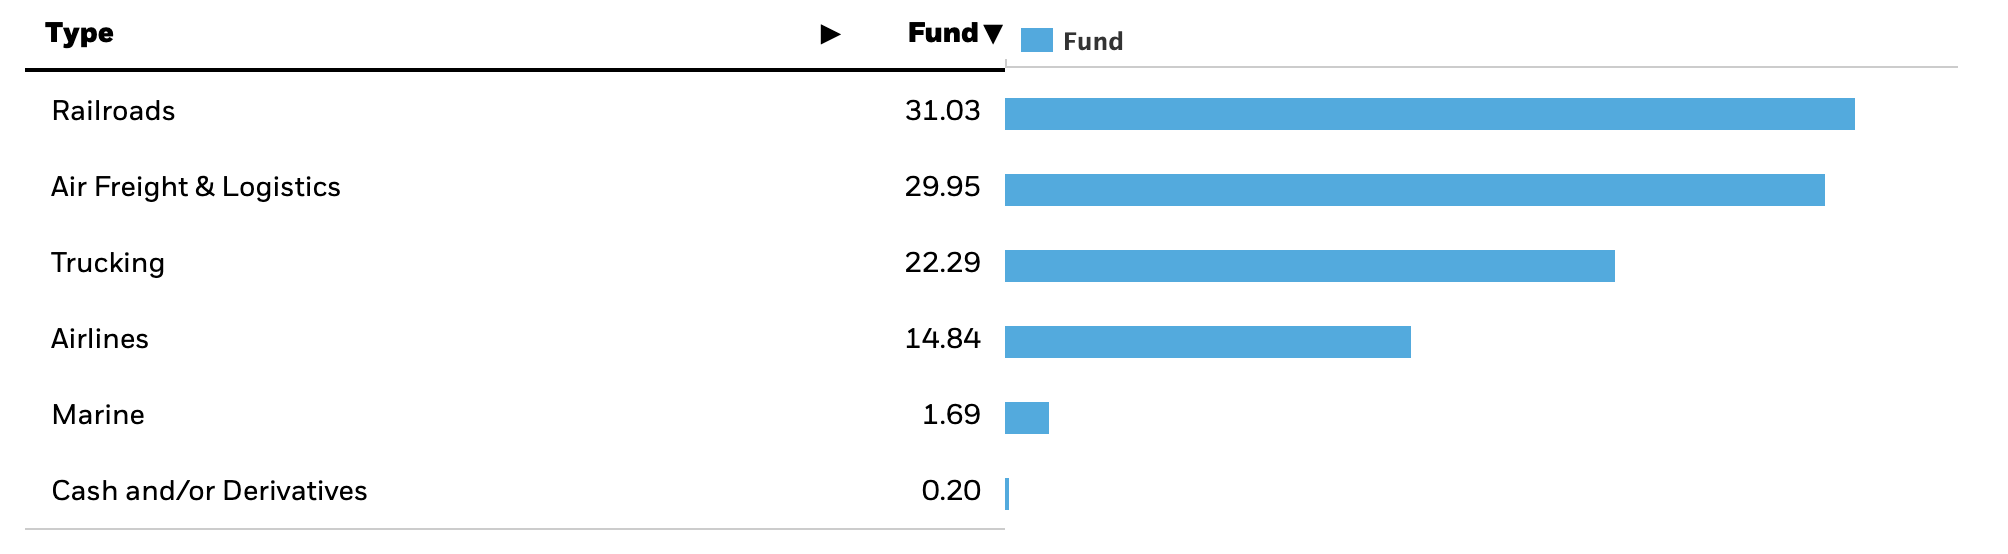
This table shows the 49 holdings with an above 0.15% weighting.
Author (iShares data)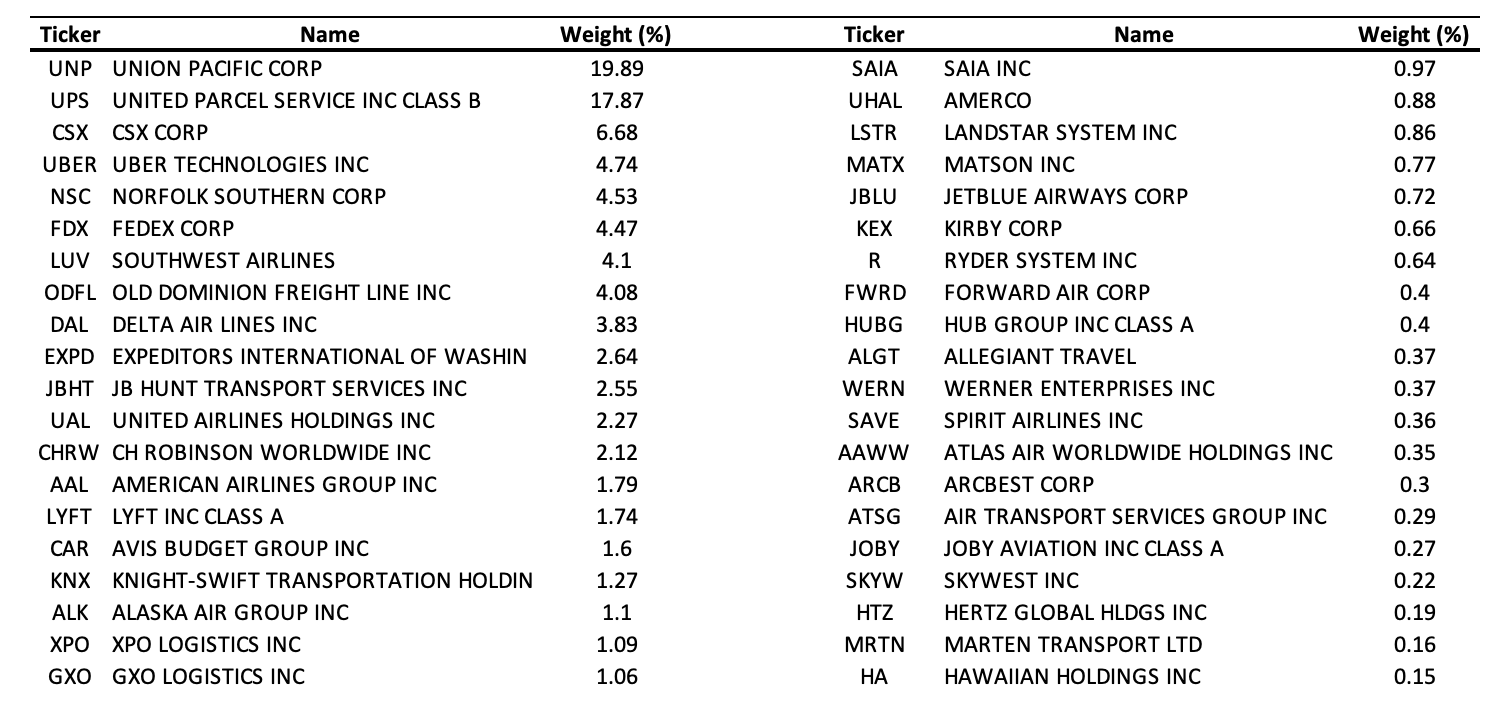
I own the largest ETF holding, Union Pacific (UNP) – it’s one of my largest holdings. Moreover, I’m looking to add more aggressively to CSX Corp. (CSX). I do own CSX, but only as a result of investing some spare cash from dividends. Hence, CSX is not even visible in the chart above.
When it comes to CSX, I’m applying the same logic I use when discussing IYT. The situation isn’t great. Hence, the stock has lost a quarter of its value as well. The same goes for the S&P 500 (more or less).
I am completely honest when I say that I don’t know where stocks will bottom. I doubt anyone knows that.
However, that’s OK. When it comes to long-term investing, I buy companies whenever I like the risk/reward. On a long-term basis, that’s a winning strategy. After all, buying a 25% discount may result in an even bigger discount if the bottom isn’t in, but when investors buy in steps they can average down.
When it comes to transportation stocks, I believe that we’re at a point where buying makes sense. The news is bad, and we should prepare for much worse economic numbers in this space in July and beyond. However, that is expected. “Smart” money knows this. The question is: how bad does it get?
Given the 25% discount, I think the risk/reward for investments in this industry is starting to look good.
Takeaway
In this article, I wanted to achieve two things.
First of all, to give an overview of economic developments impacting the transportation industry. This is important for every macro playbook and it impacts companies in various industries, far beyond transportation.
The situation is dire, but not hopeless. Going forward, we need to expect slower demand and margins in transportation industries due to lower retailer demand, slower orders from manufacturers, and dropping rates.
The good news is that a lot has been priced in.
Hence, my other goal was to explain the risk/reward of transportation stocks. I’m using the IYT ETF as it is the largest transportation ETF with a well-diversified portfolio of companies and industries.
Investors can either buy this ETF (beware of somewhat high costs) or one of its holdings. I am currently in the process of further adding to transportation companies. A 24/25% correction offers opportunities.
Moreover, breaking up an initial investment into smaller parts helps investors to manage some entry risk. If stocks continue to drop, investors can average down. If stocks take off, investors have a foot in the door.
Either way, as a long-term investor, I’m excited to see that new opportunities are presenting themselves.
(Dis)agree? Let me know in the comments!
Be the first to comment