

sutlafk/iStock via Getty Images
ETF Snapshot
With a listing date going back to March 1996, the iShares MSCI Singapore Capped ETF (NYSEARCA:EWS) is one of the oldest Asian-themed ETFs around. With only 31 stocks in the portfolio, you’re dealing with a product that has strong concentration risks. Just for some context, the top 10 stocks account for over 70% of the portfolio, and one sector in particular – the financial sector accounts for 44% of the total portfolio (incidentally, the top 3 stocks in EWS are all financials).
Some Macro Thoughts
Singapore’s growing prosperity is something that will likely attract a lot of flows from global investors; to put things into context, whilst the globe’s GDP per capita in USD terms is over $12,000, Singapore’s figure is more than 6x higher at $72,794!
One of the segments of the economy that has attracted a lot of interest this year is Singapore’s property markets. Data from Bloomberg shows that for the first nine months, house prices rose by 7% including a whopping 13% in Q3 alone.
Bloomberg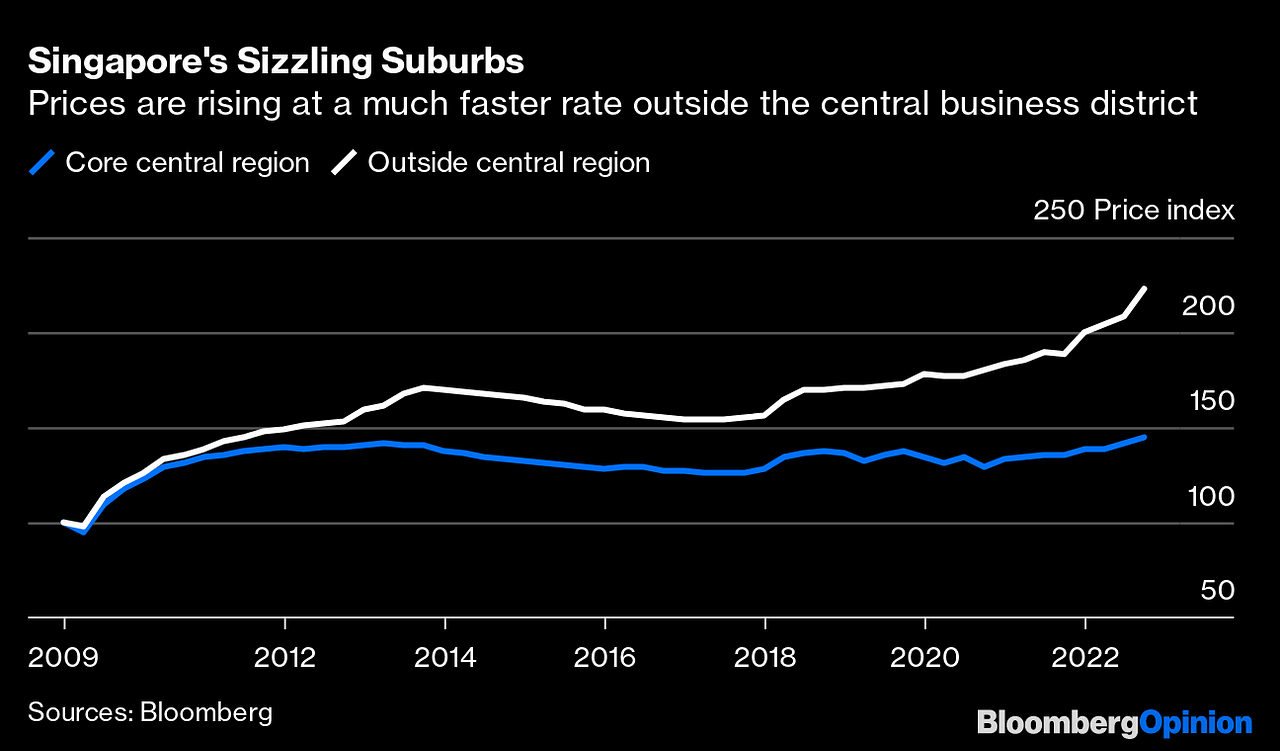
In addition to that, public housing apartments have seen 27 straight months of higher prices. All this is in stark contrast to something like a Hong Kong which has been brutally impacted by the “zero-COVID” policy followed by China. There have been a lot of anecdotal reports of corporations shifting base from Hong Kong to Singapore even as the latter overtakes the former in the World Financial Centre Rankings. It isn’t just property prices, fresh lease terms too are being doubled during renewals, and the same goes for electricity and wage contracts. All these factors suggest that Singapore remains at risk of dealing with the bursting of a potential property bubble which may unravel over the next 12-18 months, and could impact some of EWS’s largest holdings.
Meanwhile, households continue to grapple with inflation in other areas, with the headline number trending at around 14-year highs. Quite unlike a lot of economies around the world that are being hampered by externally driven inflation (which may likely ease off with lower energy prices and the dollar in 2023), Singapore’s inflation is mainly domestically-driven, and thus will likely be harder to overcome. In fact, next year, even as the overall inflation number is expected to trend lower, the proportion of domestic-driven inflation is still expected to remain elevated.
Business Times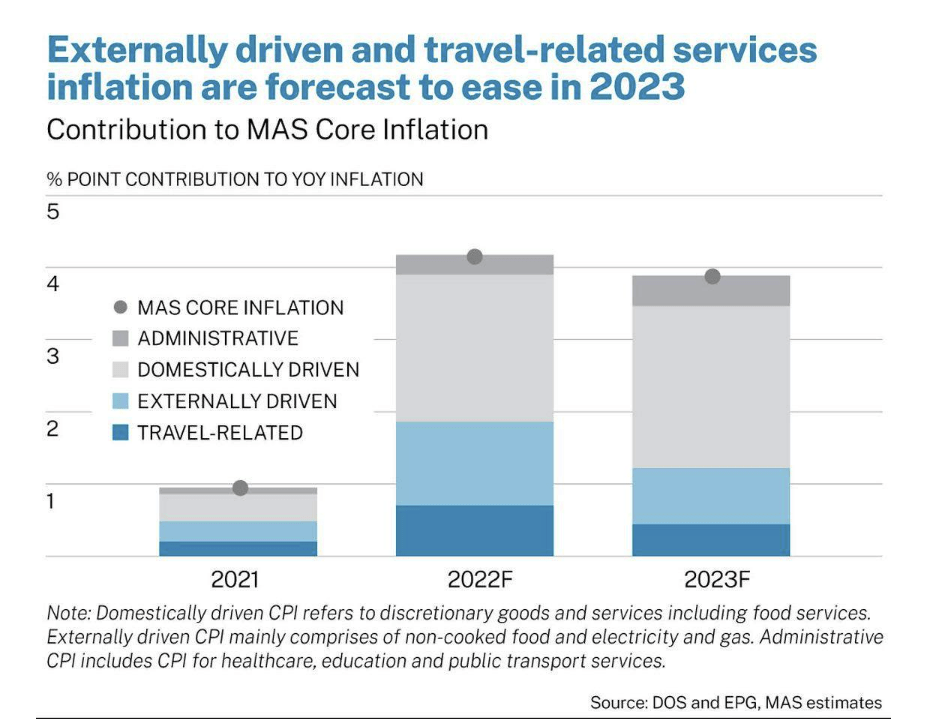
If the households of Singapore are struggling to service their budgets, how then are they expected to service their mortgage bills? Some of the largest banks in Singapore, which are also part of EWS’s portfolio, have been raising their fixed mortgage rates over the last two months, and it is believed this could hit 4% by next year. Surely, credit costs will likely trend higher. What also makes things challenging for these banks is the growing cost of funding. For instance, over the last few months, the top holding in EWS- DBS, has been relentlessly hiking rates on its flagship savings accounts (it recently hit 4.1%), and with many other banks in Singapore, the costs of deposits are higher than the interest rates earned on loans. In a scenario such as this, much of the heavy lifting will have to be done from other income-earning streams such as financial advisory, wealth management, etc., but perhaps that’s asking for too much?
Also, it’s not as if the economy is faced with an exceptionally alluring growth runway. According to the IMF, real GDP growth in Singapore will likely come in at 3% in FY22, only to slow to 2.3% next year. This is in stark contrast to the real GDP trajectory of Asia, as a whole, where growth will likely come in at a higher threshold of 4% this year, and improve even further to 4.3% next year.
Closing Thoughts
If I look at EWS’s long-term chart on the larger time frame, we can see that since the GFC, it has been trending lower in the shape of a faint descending channel. Whilst this product hasn’t delivered ample wealth for long-term investors, entries at certain pivot points within the channel have proven to be fairly rewarding. Currently, we are not too far away from the lower boundary of this channel, implying good risk-reward (if one were to enter close to the $15 range).
Investing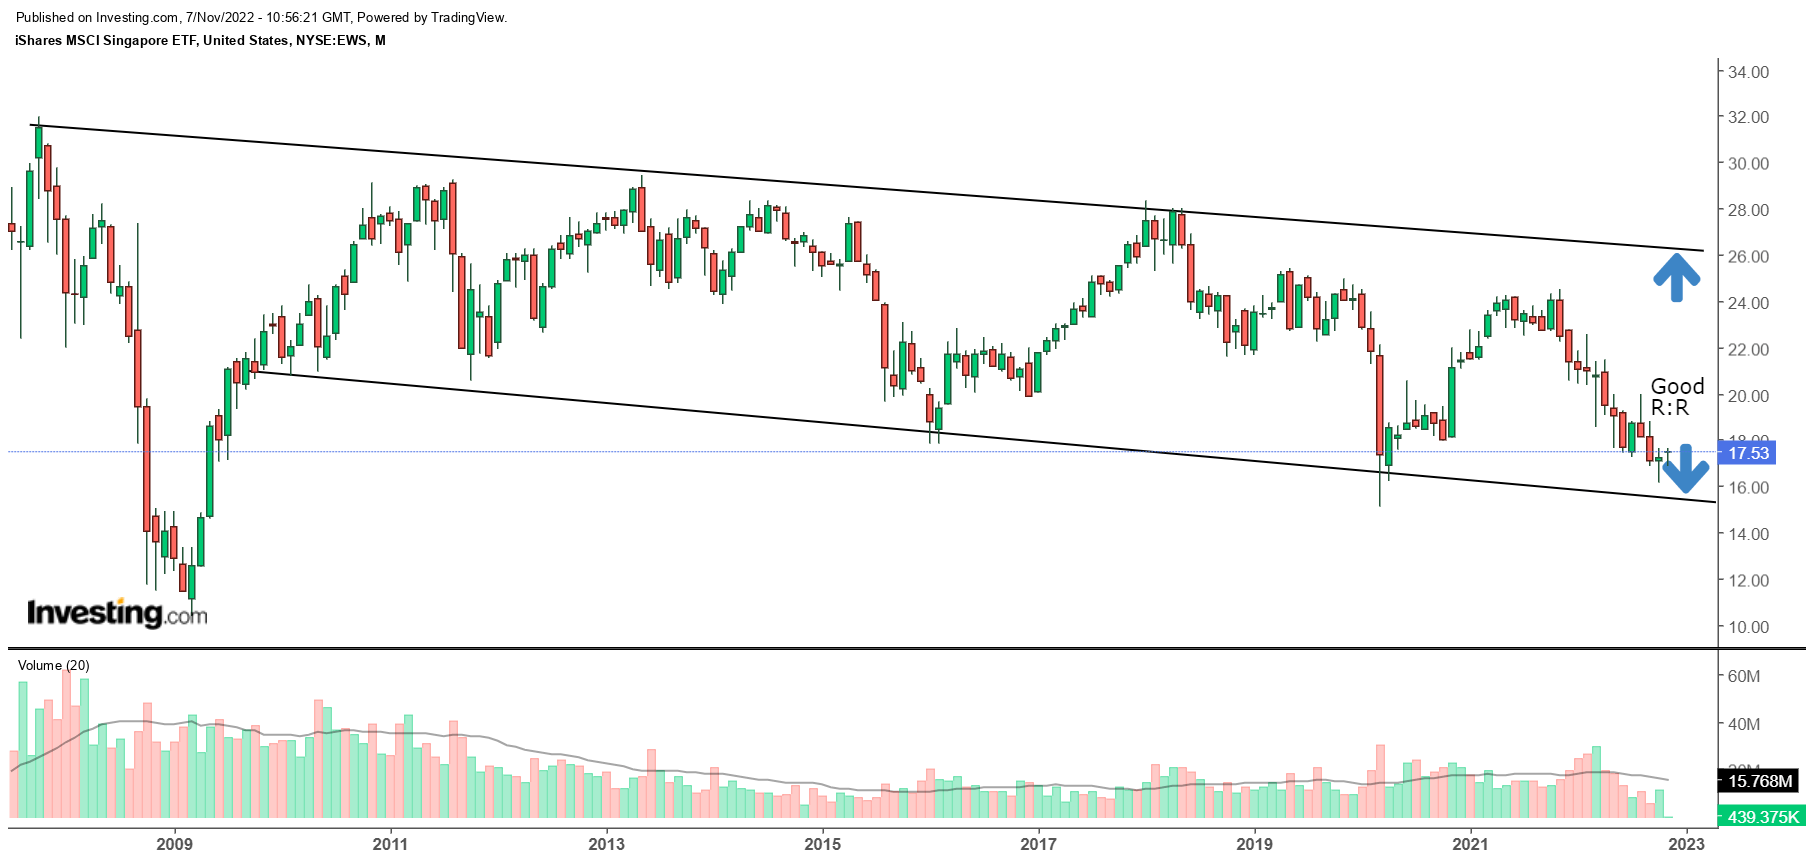
Having said that, I would also urge you to consider two other facets which prevent EWS from being a clear-cut buy.
The chart below examines how Singaporean equities are positioned relative to other Asian stocks (excluding Japan). Do note that Singaporean stocks have a ~4% weight in this portfolio. The takeaway here is that since the pandemic, until recent weeks, Singaporean stocks offered relatively decent value versus the rest of the Asian pack (reiterated by the fact that the RS ratio was consistently trading below the mid-point of the range). That is no longer the case as the RS ratio has now reached the mid-point of the lifetime range.
StockCharts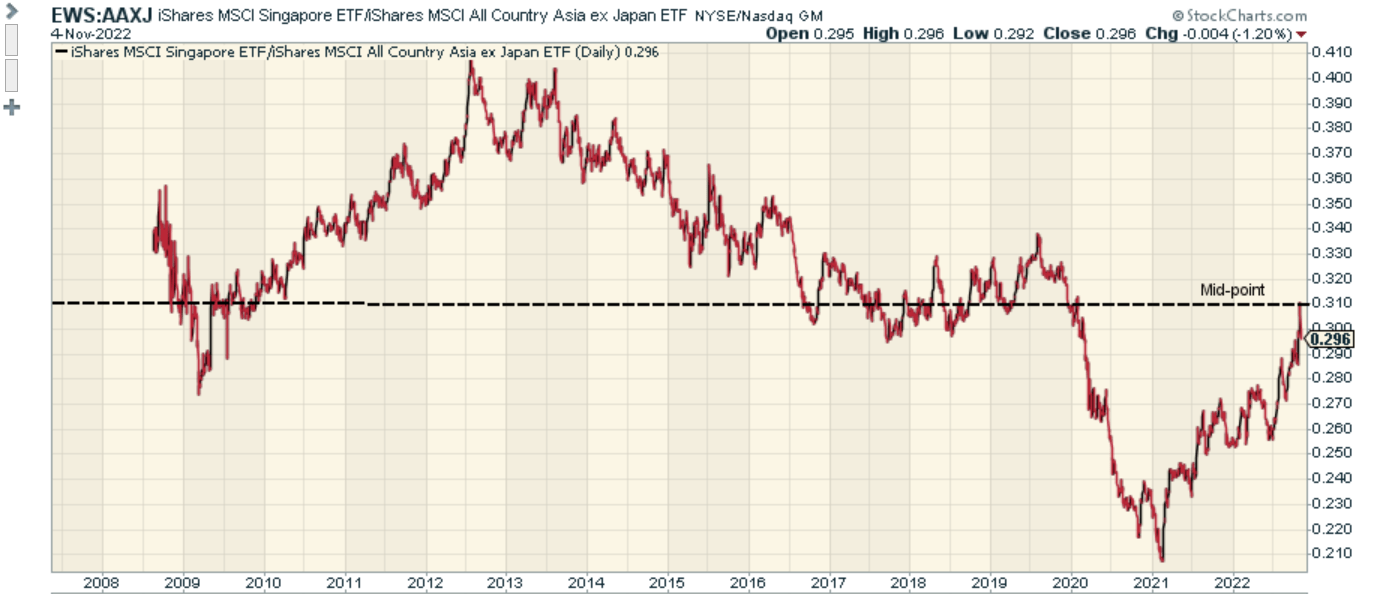
I’ll conclude with the relative forward valuation picture and the long-term earnings on offer. According to YCharts estimates, EWS currently trades at an elevated forward P/E of 13.25, which is around 25% higher than the corresponding P/E multiple of the iShares MSCI All Country Asia ex-Japan ETF (AAXJ). The valuation differential looks even more unappealing when you consider the 5-year earnings growth potential on offer; EWS only offers mid-single digit earnings potential, whilst AAXJ’s earnings potential is over twice as much, at 10.36%.
Be the first to comment