

mixmotive
With the year’s first half now history, the capital markets and the economy are facing major uncertainties. So, it seems appropriate to update the outlook for corporate profits and economic policy. In doing so, we continue to utilize two models to relate metrics of the S&P 500 (SPX) to macroeconomic variables. As indicated in our January 2022 update, our econometric models would have called for much lower earnings per share for S&P 500 than occurred. Meanwhile, the market multiple was much higher than the model forecast. This suggests that the actual multiple reflected perceptions that the effects of the pandemic would be temporary.
Official operating earnings for S&P 500 for 2021 are now available. This enables us to estimate our models with data through 2021. As a refresher, for the market multiple we use the Treasury ten year note yield and a forward-looking ratio of federal government spending to GDP. Both are inversely correlated to the multiple. Operating profits are explained by nominal and real GDP in logarithmic form and unit labor cost. The first two are directly related to profits while labor cost is inversely related.
S&P 500 bottom-up net after tax operating earnings exclude the effect of such items as mergers and acquisitions, layoffs, and unusual items. Theoretically, this series is more closely related to macroeconomic variables than reported earnings. S&P reports both and their analysts produce bottom-up forecasts for both. Official operating earnings were reported at $208 per share for 2021, which was 70% over the pandemic ravaged $122 level for 2020. A re-estimate of earnings with our input variables explained 98% of the variation in S&P 500 earnings. Model results are shown on the attached Chart I. The model to estimate the market multiple explains only 64% of the historical variation. As the attached Chart II shows, there are occasional significant misses, especially in 2020.
There is considerable uncertainty in the macroeconomic outlook. Thus, it is useful to consider the impact that changes in each explanatory variable have on earnings and the multiple. The most recent Congressional Budget Office (CBO) ten-year budget and economic outlook projections were published in May 2022. CBO provides estimates for all the inputs to our models. In May CBO forecast the year end ten-year treasury yield at 2.4% which now appears too low. Using that estimate our model forecast a multiple just shy of 20. But replacing the 2.4% estimate with a 3.4% year-end ten-year treasury yield reduced the multiple to about 18. And for 2023 a 2.9% ten year note yield would yield a multiple of 19.
Alternatively, were a 4.9% treasury yield inserted for 2023 the multiple would drop to 16.5. With the current multiple around 16, the implication is that the market is either ahead of monetary policy or that the market currently is overly pessimistic, and the multiple is too low. Using CBO baseline projections for profits, Table I shows estimates of $204 for this year or about flat earnings with 2021. For 2023 the estimate is about $210 per share. Current consensus expectations for profits are measurably higher than our model estimates.
Tables II and III attached show weaker input scenarios relative to the CBO estimates. The top portion utilizes estimates as published in the most recent Federal Reserve economic outlook from its June FOMC meeting. Our models are probably not significantly different from those used by macro analysts and the Federal Reserve staff. So, inserting the Fed’s forecasts into our models shows a value for S&P 500 of slightly less than 3100 for this year and slightly less than 3200 for 2023.
To us, this suggests that the Fed is prepared for the market pain that it deems may be necessary to achieve its goal of getting inflation back to its 2% target. This would be consistent with our longstanding view that the Fed is not looking to put a floor under equity prices. Rather it is focused on inflation and on the condition of the labor market. As shown on the table its forecast for a mild increase in the jobless rate is likely too naïve but nevertheless allows it to pursue its goal.
A big question is whether in moving toward 3100 on S&P 500 can be achieved without something in the system breaking. Were something in the system to break, only then may the Fed bend policy toward accommodation. Alternatively, the Fed may well be underestimating the impact of its policy and drives the economy into a ditch. Table III sketches a real recession with an accompanying decline in both inflation and interest rates. In this scenario S&P 500 would fall to roughly 2750 by the end of this year before recovering to around 3300 in 2023.
From our vantage point the alternatives are not attractive. However, a quick and measurable decline in inflation would likely allow the Fed to declare victory without raising rates as high as is being forecast by the FOMC. From previous reports history shows that once inflation peaks it has a tendency to fall quite rapidly. This is especially true of wartime periods and the emergence of peace or some cessation of hostilities. This would be a far more preferable outcome than having to endure a real recession.
Investment Applications
IVV is an efficient way to take a position in the S&P 500. Recently some market participants have pointed to the declines in commodities such as oil, as suggesting that inflation may be declining at much faster rate than the consensus. If the optimistic scenario would occur, IVV would likely do quite well. Conversely, if high inflation stubbornly persists for the rest of 2022, the FED will probably raise interest rates to levels which would impact both the earnings per share and the P/E market multiple of the S&P 500. This would make IVV unattractive.
Chart I
S&P 500 EPS Actual and Predicted (Prepared by author with data from S&P, BEA and FRED)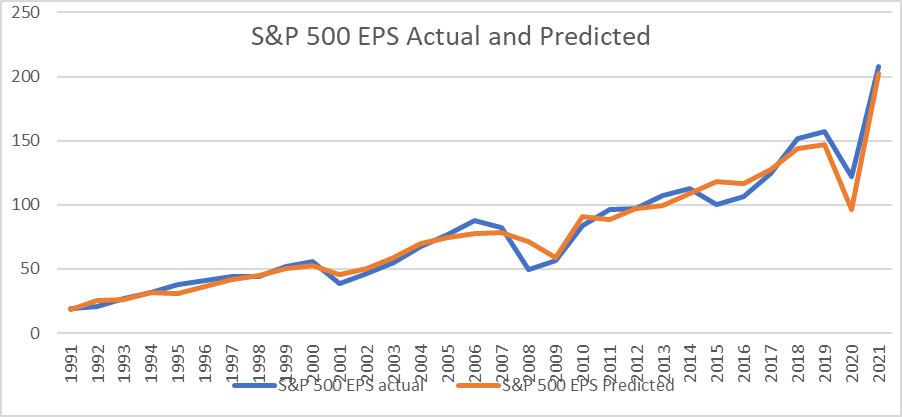
Chart II
S&P 500 P/E Actual and Predicted (Prepared by author with data from S&P, BEA and FRED)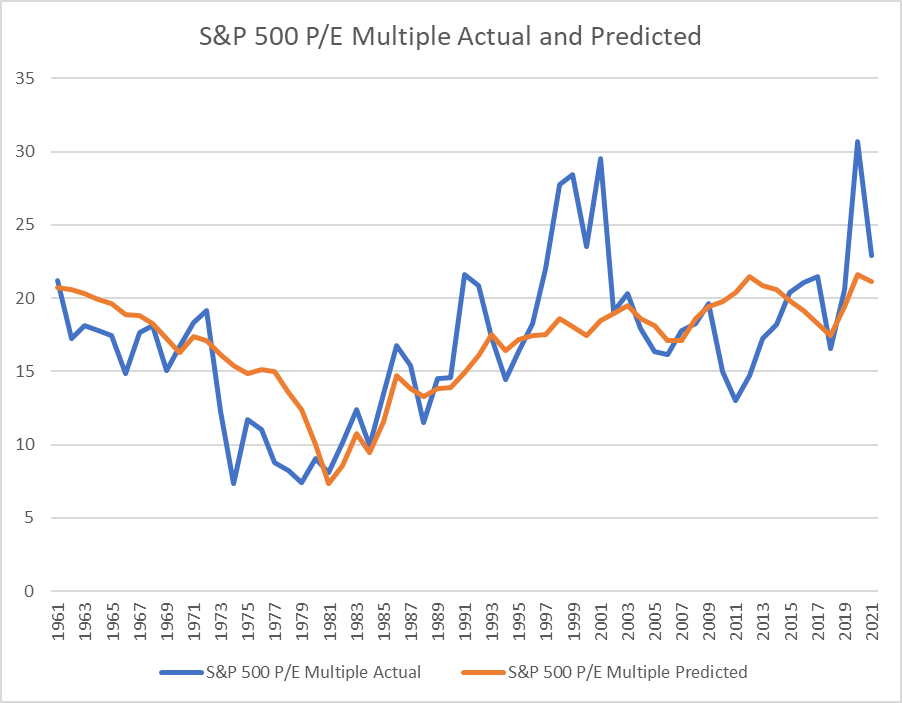
Table I
|
CBO Base Case |
actual |
actual |
|||||
|
2020 |
2021 |
2022 |
2023 |
||||
|
Real GDP % Change |
-3.4 |
5.7 |
3.8 |
2.8 |
|||
|
GDP Price Index %Change |
1.3 |
4.2 |
5.2 |
2.7 |
|||
|
Unemployment Rate |
8.1 |
5.4 |
3.8 |
3.5 |
|||
|
10-year Treasury interest rate |
0.9 |
1.4 |
2.4 |
2.9 |
|||
|
S&P Forecasts |
|||||||
|
S&P 500 earnings 6-9-2022 |
$122.37 |
$208.21 |
$224.23 |
$247.86 |
|||
|
Model |
|||||||
|
S&P 500 earnings |
$203.28 |
$208.74 |
|||||
|
S&P 500 Market p/e Multiple |
30.69 |
22.89 |
19.9 |
19.2 |
|||
|
S&P 500 |
3756.1 |
4766.1 |
4045.3 |
4007.8 |
|||
Source: Prepared by author with data from S&P, BEA, FRED
Table II
|
FOMC June 2022 |
actual |
actual |
|||||
|
2020 |
2021 |
2022 |
2023 |
||||
|
Real GDP % Change |
-3.4 |
5.7 |
1.7 |
1.7 |
|||
|
GDP Price Index %Change |
1.3 |
4.2 |
5.2 |
2.6 |
|||
|
Unemployment Rate |
8.1 |
5.4 |
3.7 |
4 |
|||
|
10-year Treasury interest rate |
0.9 |
1.4 |
3.4 |
3.8 |
|||
|
S&P 500 earnings |
163.9 |
175.4 |
|||||
|
S&P 500 Market p/e Multiple |
30.69 |
22.89 |
18.8 |
18.2 |
|||
|
S&P 500 |
3756.1 |
4766.1 |
3081.3 |
3192.3 |
|||
Source: Prepared by author with data from S&P, BEA, FRED
Table III
|
Bearish Case |
actual |
actual |
|||||
|
2020 |
2021 |
2022 |
2023 |
||||
|
Real GDP % Change |
-3.4 |
5.7 |
0 |
2 |
|||
|
GDP Price Index %Change |
1.3 |
4.2 |
5 |
2 |
|||
|
Unemployment Rate |
8.1 |
5.4 |
6 |
5.5 |
|||
|
10-year Treasury interest rate |
0.9 |
1.4 |
3 |
3 |
|||
|
S&P 500 earnings |
142.6 |
174.3 |
|||||
|
S&P 500 Market p/e Multiple |
30.69 |
22.89 |
19.2 |
19.1 |
|||
|
S&P 500 |
3756.1 |
4766.1 |
2737.9 |
3329.1 |
|||
Source: Prepared by author with data from S&P, BEA, FRED
Please note that this article was written by Dr. Vincent J. Malanga and Dr. Lance Brofman with sponsorship by BEACH INVESTMENT COUNSEL, INC. and is used with the permission of both.
Be the first to comment