

alicat
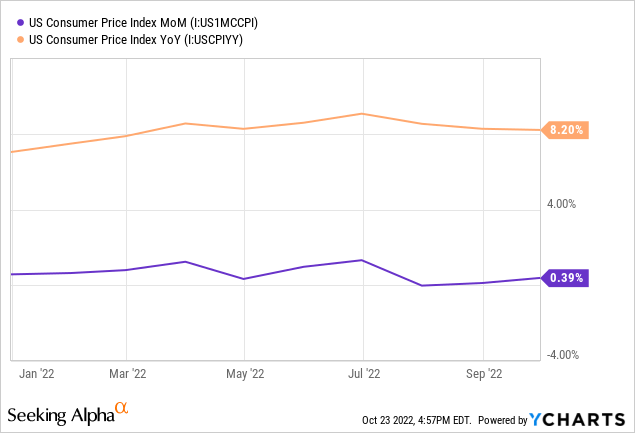
Market participants were disappointed to learn that September CPI came in at 8.2% YoY, above expectations of 8.1%, and MoM CPI came in twice of 0.2% expectations at 0.4%. Additionally, Core CPI recorded 6.6% YoY and 0.6% MoM, illustrating that core CPI continues to rise strongly in the face of rising interest rates.
The persistent, or sticky, inflation is presenting a challenge for investors and the Federal Reserve alike. While some categories of goods and services decline in price, including gasoline and cars, other categories are becoming more problematic including rent and cost of shelter.
The result, is a stalemate of sorts for inflation data. The Fed is trying to act effectively and with purpose. Yet, progress has been slow to materialize. Investors are faced with difficult decisions in this state of inflation limbo. Going short the market before a Fed pivot will prove to be disastrous. Going long into additional rate hikes and liquidity risk is equally dangerous. This why I am seeking out the safety and respectable 3-4% yield offered by Treasury Bills via the iShares 0-3 Month Treasury Bond ETF (NYSEARCA:SGOV).
Inflation Limbo
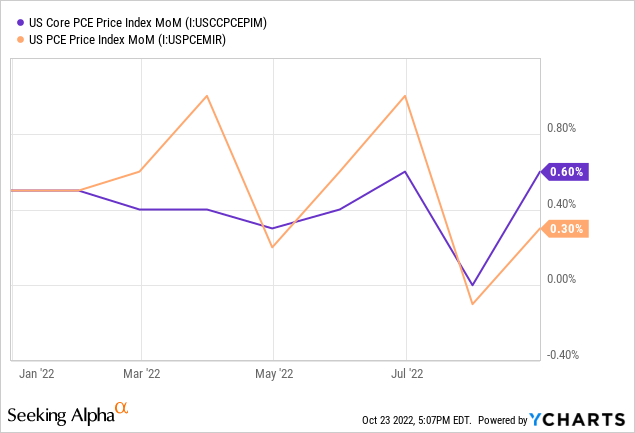
The Fed’s preferred inflation measure, core PCE, is demonstrating stubbornness as lagging inflation data prolongs elevated inflation levels. For the month of August, MoM PCE was 0.3% and MoM Core PCE was 0.6% exceeding expectations.
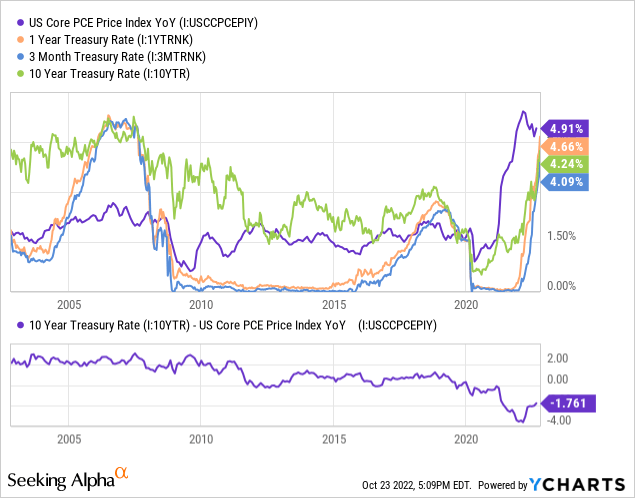
For the past two decades, the rate of the 10-year Treasury has rarely been below the Core PCE rate until 2021 when Core PCE shot up. The Federal Reserve was slow to act in raising rates, resulting in a swift rise in rates to catch up to PCE. Currently, the 10-year Treasury is still 1.76% below Core PCE, suggesting that there is more upside to rates.
Below is a chart from The Daily Shot that breaks down the CPI data by components. Notice how the Core CPI rate has exceeded headline CPI over the past three months. Weakness in energy, principally gasoline, has held the inflation rate down from hot numbers exceeding 0.5% MoM. But services CPI is leading the index higher with key contributions from rent of shelter.
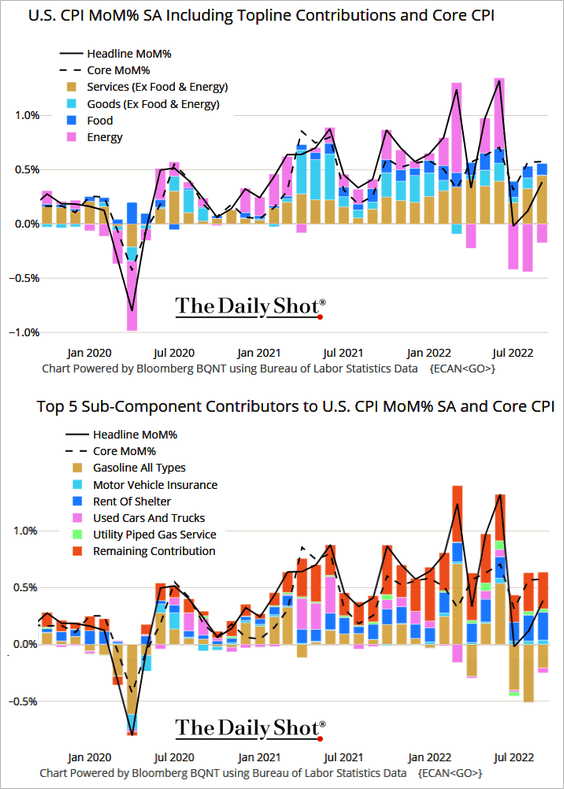
The Daily Shot (used with permission)
I’ve written previously about how cost of shelter inflation is particularly lagging. Here is what I said:
The first reason why it will be difficult for the Fed to accomplish this objective is that housing is slow to change and changes in housing inflation is lagging. The method for calculating rent in the CPI lags 6-9 months behind changes in market rent. Market rent lags behind changes in home prices by 12-18 months. The chart below shows how the recent increase in the Case Shiller Home Price Index has led CPI and CPI rent by 12 months. Home prices have only recently begun to peak and fall. Since June, home prices have declined 2% which is the fastest pace since 2009.
Data from Redfin shows that rent price growth is slowing considerably. Asking rents were only 9% higher YoY in September compared to 18% higher YoY earlier this year. That’s the good news. The bad news, is that it’s going to take months for an improvement to the rent of shelter component of the CPI to show up.
Further data from The Daily Shot below shows that many economic indicators support that inflation should have already decelerated at this point. It is clear from the data below that inflation is nearing a tipping point. However, the stickiness of Core CPI and PCE inflation is prolonging the pain.
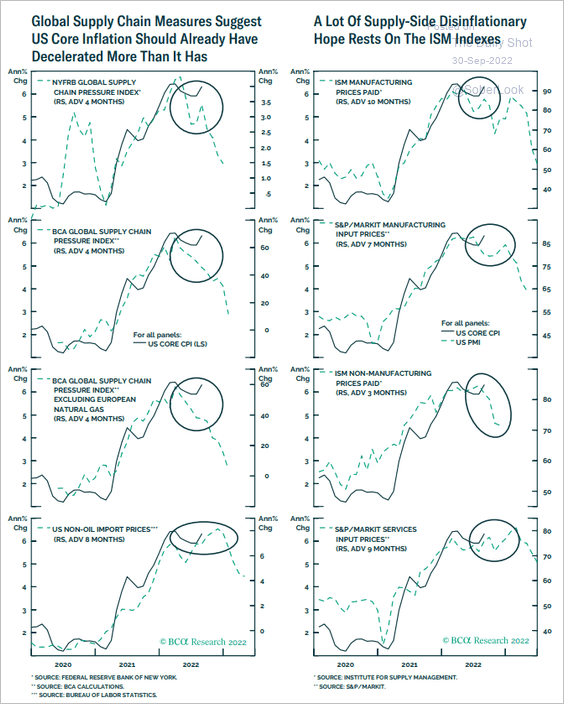
The Daily Shot (used with permission)
Seeking Safety in Treasury Bills
I would expect more volatility in equity and bond markets if interest rates continue higher. These inflation numbers are putting on more pressure for that to happen. In recent comments, Federal Reserve Bank of Philadelphia President Patrick Harker said:
We are going to keep raising rates for a while… given our frankly disappointing lack of progress on curtailing inflation, I expect we will be well above 4% by the end of the year.
Markets have followed suit. Futures markets are pricing in a >50% probability that the Fed Funds rate is above 4.5% by the end of the year. The monetary tightening is resulting in economic weakness. The all-regional Fed Surveys data for unfilled orders and deliveries has collapsed this year and is forecasting a significant decline in gross margins. This is one example of widespread economic data that is forecasting a decline in growth moving forward.
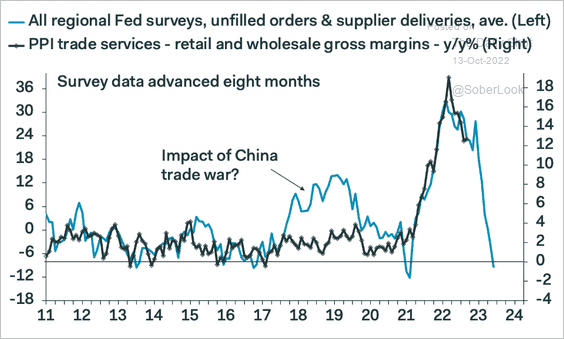
The Daily Shot (used with permission)
To protect my portfolio from this uncertainty and volatility I continue to maintain a sizeable position in U.S. Treasury Bills. The rate on T-bills has risen above 4% and offers a substantial yield for the risk.
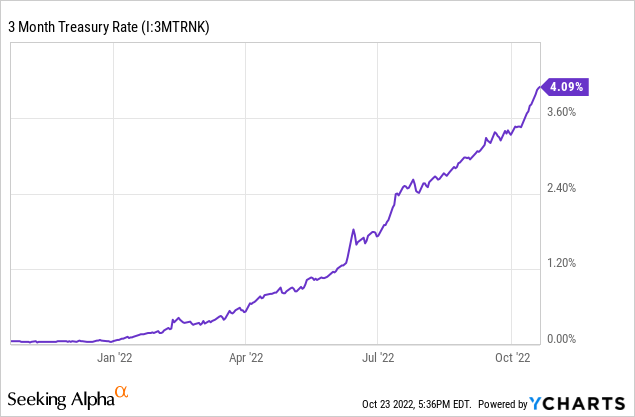
I use the iShares 0-3 Month Treasury Bond ETF to invest in T-bills. The fund invests in 0-3 month Treasury Bills and pays out proceeds with monthly dividends. The fund has an average weighted maturity duration of 0.09 years (1.08 months) and an average weighed yield to maturity of 2.92%. When the portfolio’s current holdings turnover I expect the yield to continue increasing toward the market 3-month rate of 4% by the end of the year.
Summary
Inflation is remaining persistently high. The Federal Reserve is under pressure to continue with rate hikes until inflation data begins to weaken. This will likely take a few more months as Core CPI and PCE is impacted by lagging rent inflation. To protect my portfolio from increasing volatility I have exposure to U.S. Treasury Bills through the SGOV ETF.
Be the first to comment