


anusorn nakdee
Company Snapshot
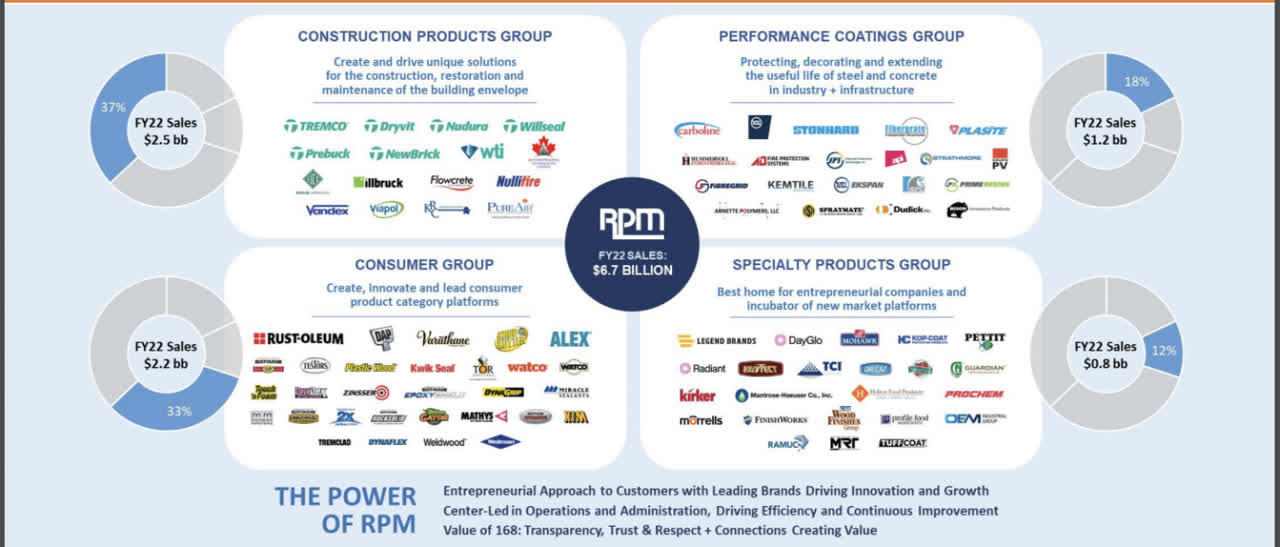
RPM International Inc. (NYSE:RPM), is a specialty chemicals company whose products are primarily used in the industrial and consumer markets. Even though the company is based in Delaware, its products are currently marketed in 162 countries and manufactured in 117 locations globally.
RPM currently reports under four segments-
Construction Products Group (CPG)- This is the largest division of RPM and noted products include roofing systems, coatings, structural panels, specialized roofing, residential home weatherization systems, etc. Performance Coatings Group (PCG)- Product lines from this division include polymer flooring products, corrosion-control coatings, infrastructure, and O&G-related insulation products, fiberglass plastic gratings, etc. Consumer Segment- This division contributes roughly a third of total group revenues and products mainly include DIY-related products for the residential and home improvement markets Specialty Products Group (SPG)- This is the smallest division of RPM accounting for 12% of total sales. Key products include disinfectants, colorants, and pigments, fuel additives, food and wood coatings, etc.
Investor Day 2022 Presentation
Did RPM International Beat Earnings And What Is The Outlook?
For the uninitiated, RPM International follows a May year-ending calendar. Earlier this month (October 5), it had come out with its Q1-23 results (August ending quarter) where it managed to beat consensus estimates, both on the top line and bottom line.
Despite an FX headwind of -3.4%, reported topline growth came in at an impressive 17%, resulting in a figure of $1.93bn; this was roughly 3% better than street estimates of $1.88bn. The EPS beat was even more impressive, with the company delivering a figure of $1.47, 10% higher than street estimates of $1.33!
It appears as though RPM is now seeing the benefits of pricing increases to counter the threat of cost inflation; in Q1, unit volumes were up by 5%, but pricing grew by 15% and helped negate the impact of a 28% surge in cost inflation. Also note that all four divisions witnessed double-digit growth in sales.
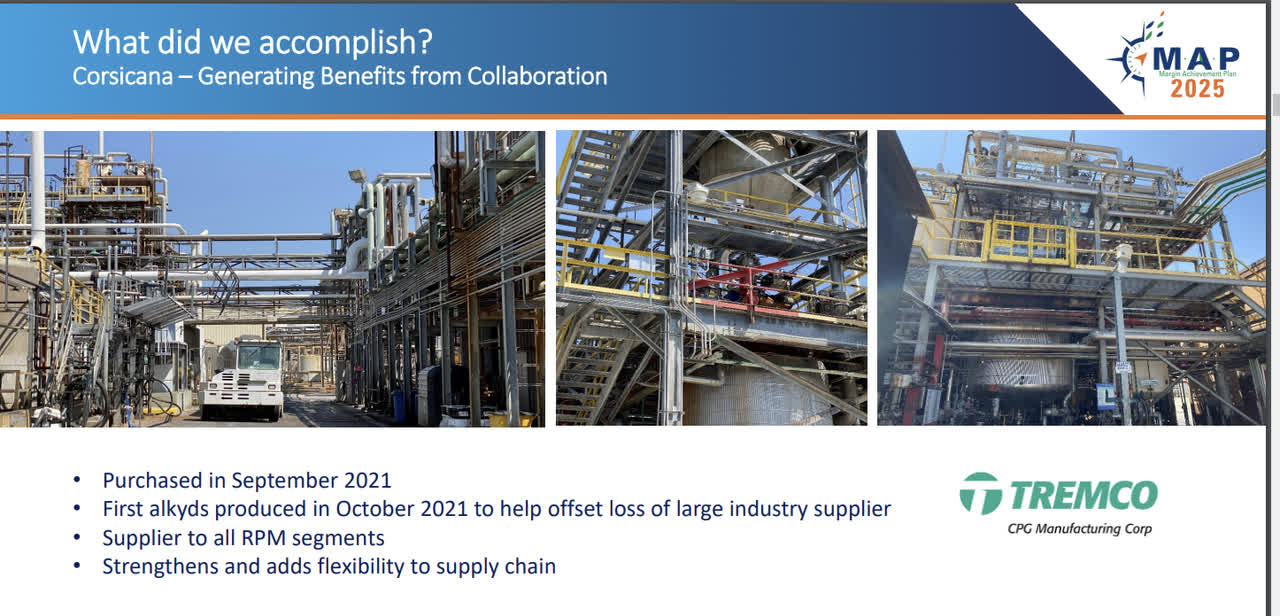
What was also encouraging to note was improved procurement and sourcing as they tied up with new suppliers. Crucially, there was also a greater deal of insourcing which was of great use (particularly) for the CPG division’s need for alkyd resins. For the uninitiated, last year RPM had acquired a plant in Corsicana to help bridge the gap of a larger supplier.
Investor Day 2022 Presentation
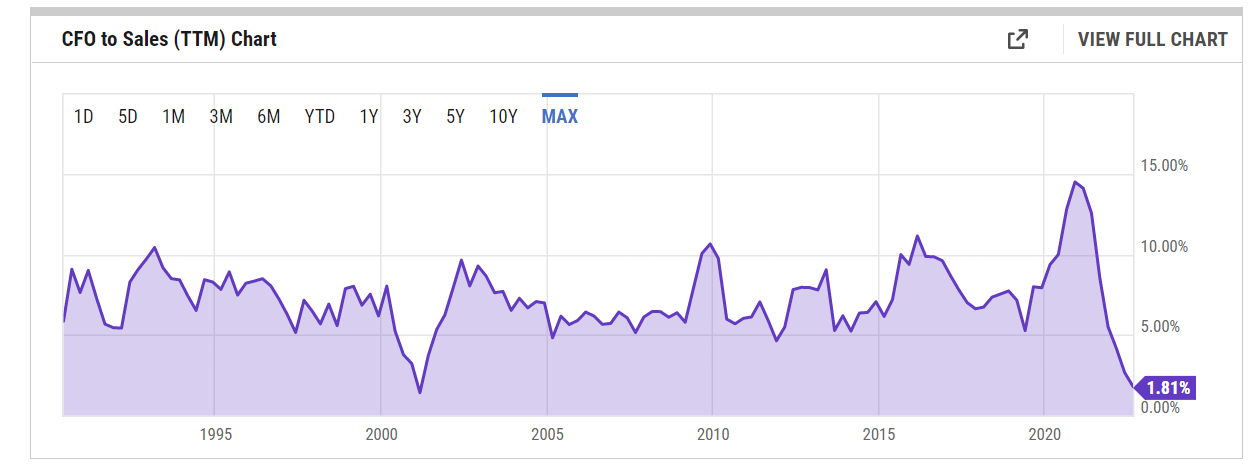
I’m a little concerned with the inventory position and how this has torpedoed the cash flow-generating position of the RPM, which to be honest hasn’t been too great over the last six quarters. In Q1, nearly $150m of cash was sucked out by inventory build, compared to just $68bn a year ago. This was heavily instrumental in sending the operating cash flow to sales margin levels back to a minuscule level of less than 2%, the lowest it’s been in over two decades!
YCharts
I understand a large part of this is due to cost inflation, which to some extent could be made up by pricing increases, but in a near-recessionary environment, how does one expect the end markets to absorb relentless price hikes? One is already witnessing ample weakness in some of the DIY consumer segments which incidentally witnessed a 150% annual surge in adjusted EBIT (some of the gargantuan increase can also be explained by the weak base effect of last year where there was an explosion at one of their suppliers). Nonetheless, do note that either way pricing impacts will likely fade as we inch closer to Q3/Q4 as we will see the annualizing of the pricing impact by then.
Two headwinds that will likely persist are ones linked to the European business and the dollar index. Europe was the only region for RPM to witness a decline in sales (-8.5%) and the management did not sound too optimistic about conditions there. Given that 31% of their sales are generated from international markets, also expect adverse FX translation to weigh adversely on the reported numbers.
All in all, in Q2 one should not expect the same level of momentum seen in Q1. RPM’s management is currently guiding to a sales growth range of 9-12%, lower than the 17% growth seen in Q1. However, EBIT growth will likely match or better the Q1 run-rate (Q1 saw annual adjusted EBIT growth of 33%) as last year in Q2, RPM had been hampered by supply chain-related challenges, so the weak base impact should help. RPM could also benefit from incremental MAP-related savings (more on this later) where they were able to bring through $30m of incremental benefits in Q1.
Is RPM A Good Investment Long-Term?
RPM is currently in the midst of implementing an ambitious margin improvement plan titled MAP 2025, which would put the company in a very solid position in three years. Do note that the company has a good track record of exceeding targets when it comes to strategic plans of this sort. Before MAP 2025, they had a “MAP to growth” plan which had kicked off in late 2018, which saw them make some structural changes in their manufacturing and procurement functions. By 2021 they had also exceeded their initial cost savings target of $290m by 10%.
Now as part of MAP 2025 they plan to bring through annualized savings of $465m by May 2025 with the bulk of this (46% of forecasted savings) coming from procurement-related initiatives, where they plan to expand categories of centralized procurement, and also lock in access to a larger portfolio of strategic suppliers. There will also be ample changes on the manufacturing and sales force side.
If you consider sticking around for the next few years, and if all goes to plan, you could be looking at a company with gross profit margins of 42% and Adjusted EBIT margins of 16%, implying an improvement of 540-570 bps from the FY22 margin levels!
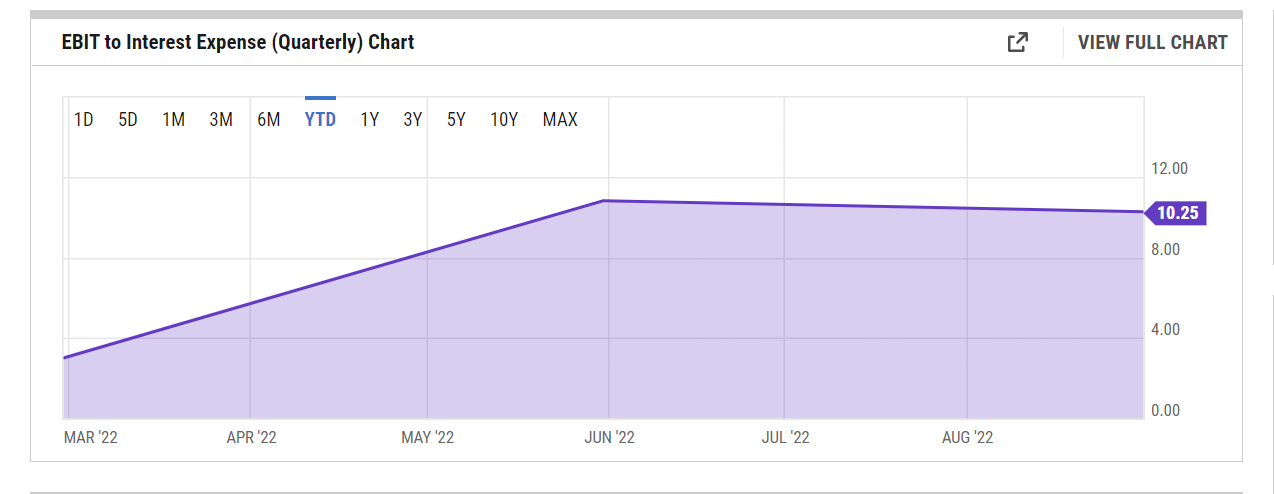
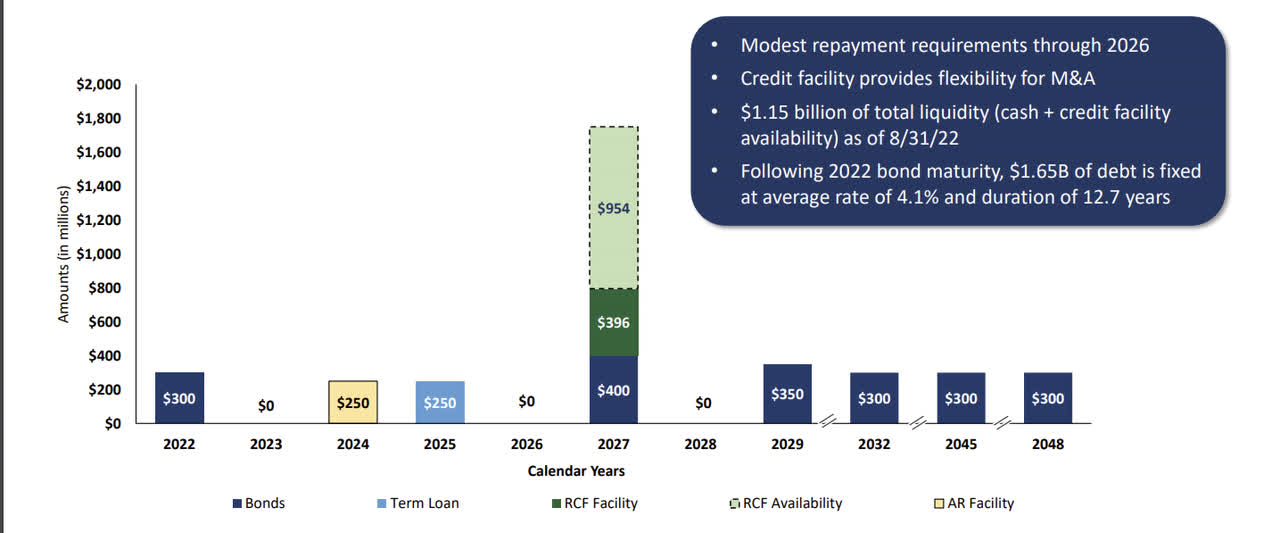
Whilst RPM’s leverage levels are hardly anything to be scoffed at ($3bn of debt, the highest it’s ever been), it is quite manageable. Firstly, despite increased debt levels, RPM has been generating increasingly strong EBIT to comfortably cover the quarterly expense bill by over 10x in the recent past. Just for some context, over the last five years, the quarterly EBIT has typically only covered interest expenses by 6.6x. Also note that 60% of their debt structure is fixed at a weighted average rate of 4.1% and the variable component is still lower than their fixed rates.
YCharts
I also like the fact that they recently increased the maturity of some of their debt, and it doesn’t appear that they have any major obligations until 2026. This puts them in a good spot to execute the MAP 2025 program without any major encumbrances.
Investor Day 2022 Presentation
Then, as far as long-standing dividend growers go, you won’t find too many options in the mid-cap space that can match RPM’s credentials. RPM is part of the S&P Mid-cap 400 Dividend Aristocrats Index, which covers stocks that have increased dividends every year, for at least 15 years. Post the Q1 results, RPM raised its dividends by 5% yet again, making it the 49th successive year where it has increased dividends. Interestingly enough, according to Dividend Radar, not just mid-caps, but across the entire US publicly listed space, only 41 other stocks have increased dividends over a longer period than RPM!
Closing Thoughts- Is RPM Stock A Buy, Sell, or Hold?
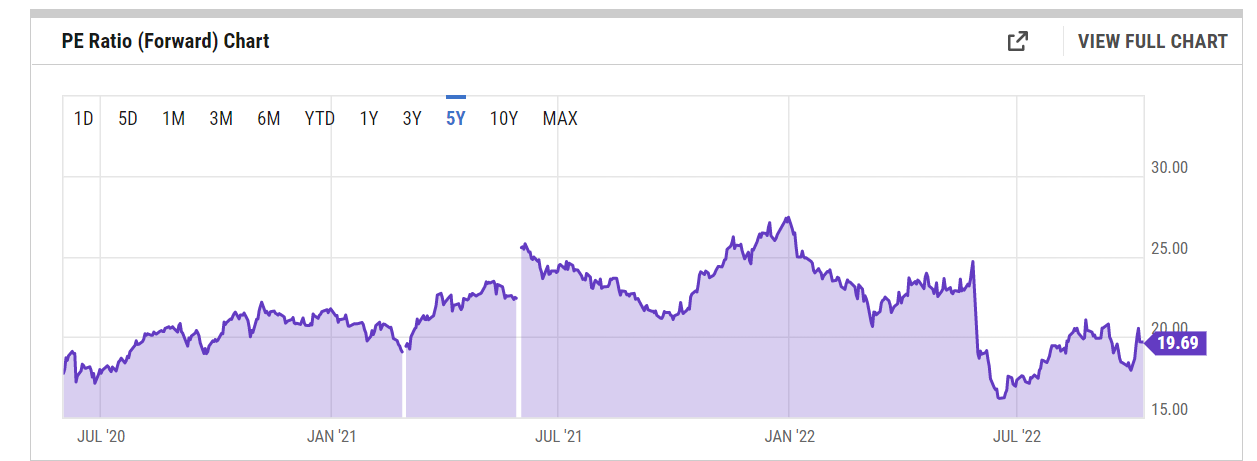
Whilst RPM’s forward P/E multiple of nearly 20x may come across as pricey on an absolute basis, it is still a tad lower than the 5-year average of 21.6x, and also currently trades towards the lower end of the 5-year forward P/E band of 16-27x.
YCharts
As noted earlier, the dividend of RPM is an important facet of the overall story. However, if you consider the current forward yield of 1.86%, one has to say it is probably not the best time to get in as typically over the last five years, the yields have been higher at an average of over 2%.
My preference to not get too bullish is also supplemented by what I see on the standalone and relative strength charts.
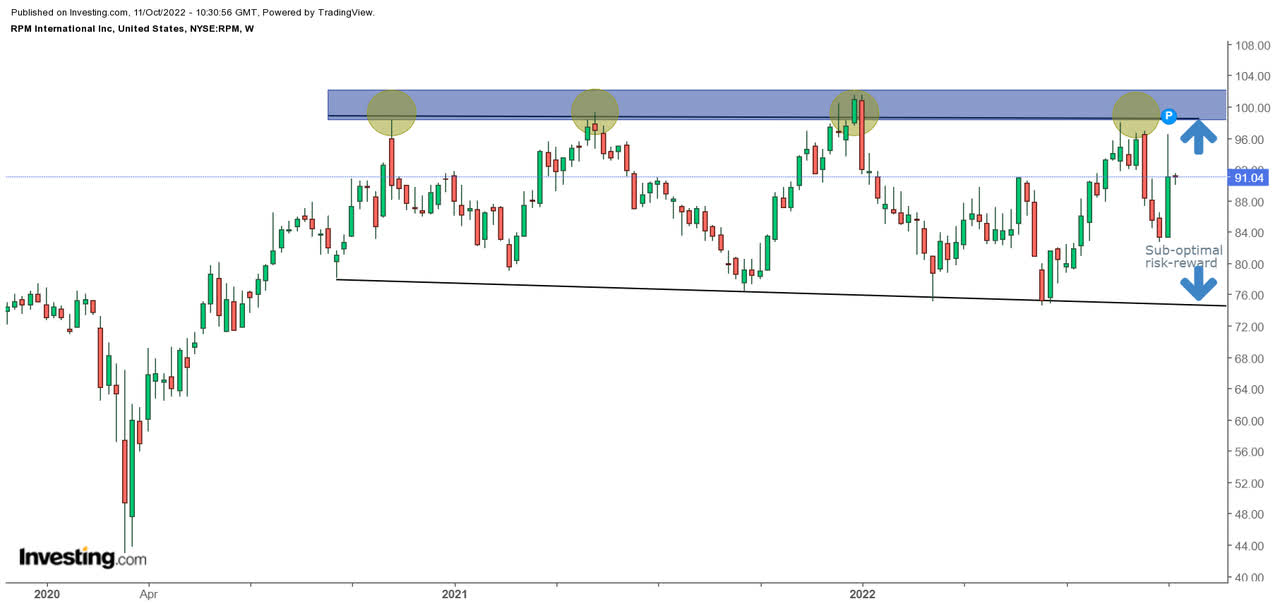
On RPM’s weekly chart we can see that it has been struggling for direction since Q3-20 and has been chopping around between the $75-$101 levels. So far, we’ve seen four successive attempts to break past this range on the upside, but to no avail. It is evident that a lot of supply tends to come on board as the stock inches closer to the $100 levels, and it doesn’t help that the average target price from the influential Wall-Street Analyst Community is at $100.83. With the stock already at $91 levels, the risk-reward doesn’t look too great, particularly when you also consider how far away the stock is from the lower boundary.
Investing
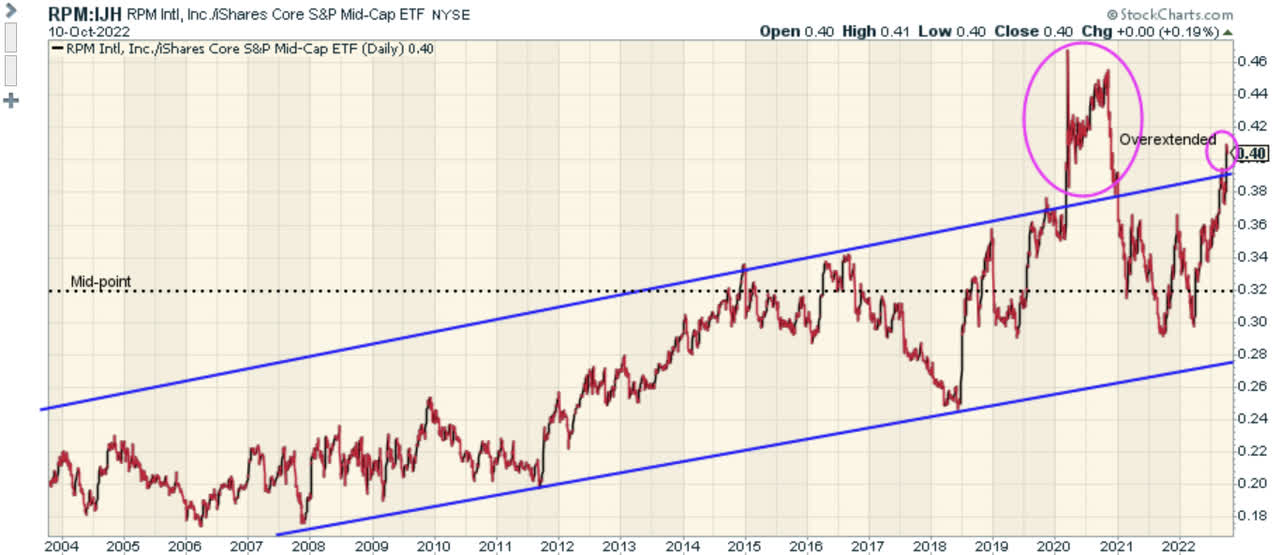
The unappealing risk-reward is further reiterated when you compare RPM to its peers from the mid-cap space as represented by the iShares Core S&P Mid-cap ETF (IJH).
Stockcharts
Since 2004, this ratio has trended up in the shape of an ascending channel, with a few bouts of overextension. Currently, the ratio trades well over the mid-point of its zone and has also just crossed the upper boundary of the channel.
To conclude, RPM’s stock is a HOLD at current levels.
Be the first to comment