

ysuel/iStock via Getty Images
Between March of 2009 and January of 2022 the share price of the Invesco QQQ Trust (NASDAQ:QQQ) rose steadily with only brief corrections, every one of which investors correctly treated as a buying opportunity.
QQQ Price Return March 31 2009 – December 31, 2021
Seeking Alpha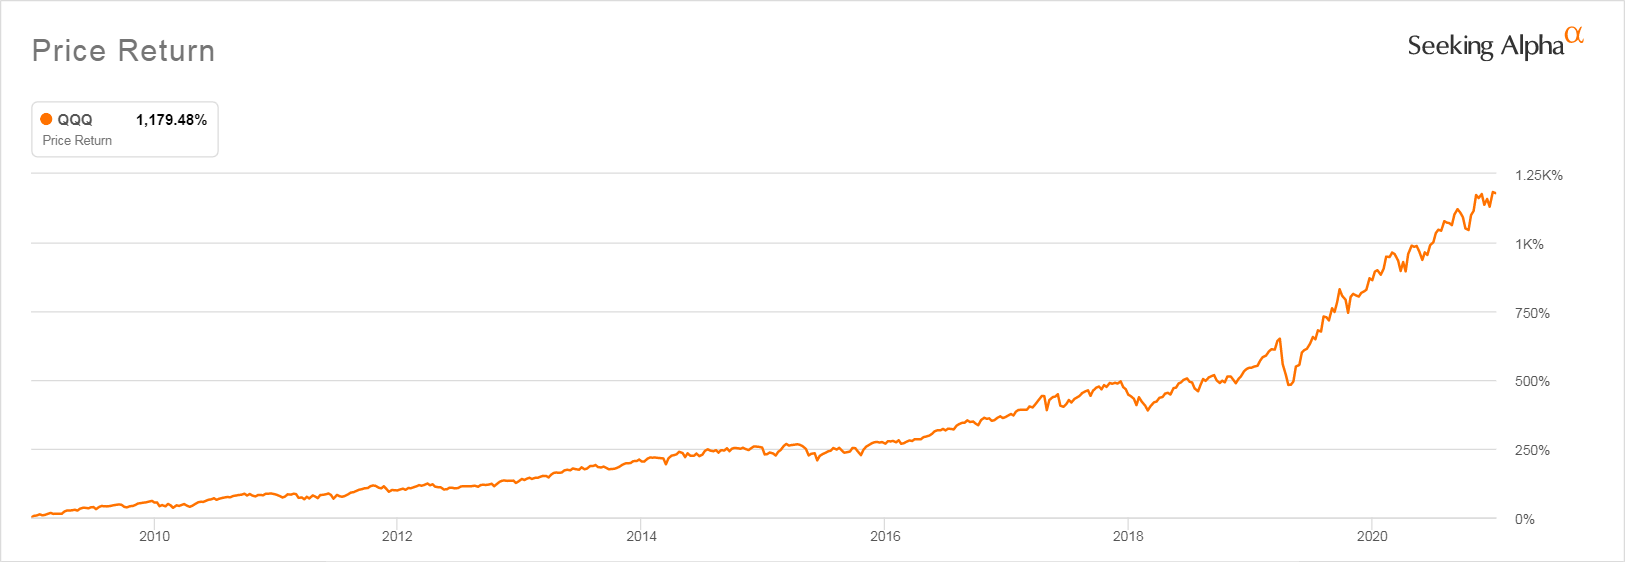
Thus, it is understandable that even though QQQ is currently down 21.25% since its high at the end of 2021 and has remained significantly under that high throughout 2022 many investors are still tempted to treat the current downturn as yet another opportunity to load up.
Are they right? In this article I’ll review the factors you must consider before making your own decision.
How Has QQQ’s Valuation Changed? QQQ Key Metrics
Just over a year ago, on September 14, 2021, I published an article titled, Is QQQ Overvalued or Undervalued. In it I took a hard look at QQQ’s valuation. After going deeply into its individual holdings I concluded back then that QQQ was significantly overvalued.
After QQQ has experienced that 20% drop in share price, it should come as no surprise that the valuation has improved. In the table below you can compare the metrics supplied on Invesco’s Product Detail Page that I captured back in September of 2021 with the currently reported metrics. Looking only at these figures, it would appear that the valuation of QQQ has become far more tempting.
Fund Characteristics – As Of 6/30/2021
|
Fund Characteristics As Of 6/30/22
|
Source: Invesco QQQ Product Detail Page
You should note that these metrics are only reported after the end of each quarter, so they are quite out of date by now. But since they were out of date last year when I first looked into them, the comparison is still legitimate.
You should also note that Invesco provides very few valuation metrics. What they leave out is one metric I consider to be among the most important, the forecast future earnings of QQQ’s holdings.
Though a P/E ratio of 21.58 is much better than one of 33.12, it is still high enough to only be considered a fair value if the underlying holdings in QQQ are growing their earnings at a robust rate. It’s dividend yield is very low, a measly 0.72%, so the only reason for any investor to pay a price that is 21.58 times QQQ’s holdings current earnings is if they believe those earnings will grow dramatically and push up QQQ’s share price even higher.
That’s why Invesco markets QQQ with the claim that buying it is “an investment in innovation” and claims that if you buy into it you will. “Get more from your investments with some of the world’s most innovative companies.”
QQQ Does Not Select Stocks for Either Innovation Or Growth It is Accidental That its Holdings Have Had Those Characteristics
But before we get swept away by the hype or even invest based on impressive backtesting we have to remember that unlike the indexes constructed to fulfill the missions of other ETFS that state that they invest in innovative technology or in aggressive growth stocks, the index that QQQ tracks applies no screens for innovation or growth to the stocks it selects. In fact, it applies no screens to those stocks at all. The only criteria for joining the NASDAQ 100 Index, which is the index QQQ tracks, is that a company be one of the 100 stocks with the largest market capitalizations of all the thousands of stocks listed on the NASDAQ exchange. That’s it.
Quite accidentally, over the past 23 years since QQQ started trading, the stocks that have grown to be the largest listed on the NASDAQ have been innovative stocks, most of them with a computer technology connection. That’s because the NASDAQ exchange started trading more recently than did the New York Stock Exchange or the American Stock Exchange (currently part of the NYSE). But “more recently” is relative. The NASDAQ has been listing stocks since February of 1971. It rose to prominence in the 1980s when the companies pioneering the PC revolution like Microsoft (MSFT) went public by listing on the NASDAQ exchange. It became even more identified with aggressive tech growth in the 1990s with the arrival of the internet and companies like Cisco (CSCO) and Amazon (AMZN) and in the 2000s with the advent of the smartphone era and the rise of companies profiting from the huge influx of smartphone-owning customers including Alphabet (GOOG) (GOOGL) and Facebook (META).
So until now what investors have been buying when they pay a price that is 33 times current earnings or even 21 times current earnings is robust future earnings growth that promises to drive up QQQ share price even further. Until now they have been getting it, but they have been getting that share price growth because the holdings in QQQ were delivering the robust sales and/or earnings growth that attracts investors to investments that don’t pay significant dividends.
That is why we have to look beyond the few metrics Invesco supplies and ask of QQQ, is that aggressive growth still there?
The Earnings Growth Rate of QQQ’s Top Holdings has Plummeted
QQQ is still very top heavy with its Top 10 Stocks making up 52.02% of the value of the entire ETF. So let’s take a closer look at whether these dominant stocks are still growing their earnings at the robust level that would justify QQQ’s current P/E ratio still being over 21. The table below shows how analysts’ current earnings growth forecasts for these 10 top stocks compare to what their average historical earnings growth rate has been over the past ten years.
QQQ Top 10 Stocks P/E Ratios, Earnings Growth Forecasts, and Earnings Growth History
| Weight in QQQ by % | Ticker | Name | P/E Ratio | Forecast Growth Rate | Past 10 Yr Growth Rate | Past 10 Year Avg P/E Ratio | Growth % Under 10 Yr Level |
| 13.42 | (AAPL) | Apple | 24.82 | 6.58% | 18.96% | 16.65 | -12.38% |
| 10.11 | (MSFT) | Microsoft | 26.05 | 16.00% | 12.73% | 22.3 | 3.27% |
| 6.97 | (AMZN) | Amazon | 125.58 | 10.00% | 47.06% | 187.05 | -37.06% |
| 5.22 | (TSLA) | Tesla | 85.42 | 27.53% | 632.64 | N/A | |
| 3.54 | (GOOG) | Alphabet – C | 19.64 | 7.93% | 20.05% | 25.62 | –12.12% |
| 3.42 | (GOOGL) | Alphabet – A | 19.48 | 7.93% | 20.05% | 24.37 | -12.12% |
| 2.77 | (META) | Meta | 13.31 | 0.39% | 34.93 | N/A | |
| 2.56 | (NVDA) | Nvidia | 34.82 | 10.28% | 34.16% | 32.39 | -23.88% |
| 2.12 | (PEP) | PepsiCo | 25.54 | 7.98% | 3.59% | 21.51 | 4.39% |
| 2.05 | (COST) | Costco | 38.33 | 13.05% | 12.88% | 29.74 | 0.17% |
Source: Weights from Invesco. Valuation metrics reported by Fastgraphs using FactSet data, Table by the Author
As you can see, the forecasted growth rate of the seven companies that have earnings histories at least 10 years long (counting Alphabet as one company) is significantly lower than their historical growth rate. Only one company, Microsoft, has a predicted growth rate that is both higher than its historical average and one high enough to define it as a true growth stock.
PepsiCo’s currently forecast growth rate is higher than its historical rate, but that 10-year average growth rate is only 3.59%. It seems hard to justify its historical P/E ratio of 21.51 given that slow growth. Even its higher currently forecast growth rate of 7.98% seems far too low to justify its current P/E ratio of 25.42.
When we look at the companies with shorter earnings histories, the picture isn’t very encouraging either. Meta’s forecast earnings growth rate is a feeble 0.39%. And while Tesla’s forecast earnings growth rate is a robust 27.53%, making it the only stock in QQQ’s top 10 with an earnings growth rate that qualifies it an aggressive growth stock, its P/E ratio is so extreme and its market cap already so large that you have to take that earnings growth rate with a grain of salt. With only $4.08 of earnings per share forecast for 2022, Tesla’s earnings can grow by a large percentage only because they are so tiny in proportion to Tesla’s stock price which is currently over $300/share. Meanwhile other automakers are making huge strides in bringing their EV products to market. That makes it hard to see how Tesla is going to be able to ever achieve earnings that would bring down its P/E ratio to one appropriate for a profitable aggressive growth stock — one closer to 30 than 100.
Three Factors Make it Likely QQQ’s Future Won’t Be Like Its Past 15 Years
Investors who rely on backward-looking analysis may not have absorbed just how different market conditions are this year from every market since QQQ took off in 2009. And the new factors operating on the market are factors that provide a strong headwind to growth for all stocks but especially for those in QQQ.
The Stocks that Dominate QQQ Are Closely Associated with the Smartphone Revolution
Apple is the largest stock in the world by market cap and it is listed on the NASDAQ exchange. So it has played an outsized role in QQQ’s performance since the launch of the iPhone in 2007. So investors in QQQ need to be aware of the extent to which Apple’s earnings growth has slowed and the smartphone revolution hitting a slowing, more mature phase. With genius innovator Steve Jobs gone, Apple no longer comes up with the kind of paradigm changing inventions that Jobs championed. Instead, it currently puts its energies into making small tweaks to its existing product line and selling apps and media that run on its platforms.
Apple still dominates the U.S. market for smartphones, but its share worldwide is only around 23% with strong competition coming from competitors like Samsung, Alphabet’s Pixel, and several other brands with smaller market share, some of them regional, that offer cheaper products.
So while Apple is still very profitable and likely to remain so, it has reached a size where it has become a mature company whose very size means that it’s very unlikely to be able to grow its profits at the rate it could when it was smaller and more innovative. There are only so many phones they can sell when even Mongolian nomads deep in the Gobi desert now own smartphones, and only so much media they can sell when consumers are facing what I once heard an Amazon executive describe at a writers’ conference as “a tsunami of content.”
Apple Price, Earnings, and Dividends
Fastgraphs.com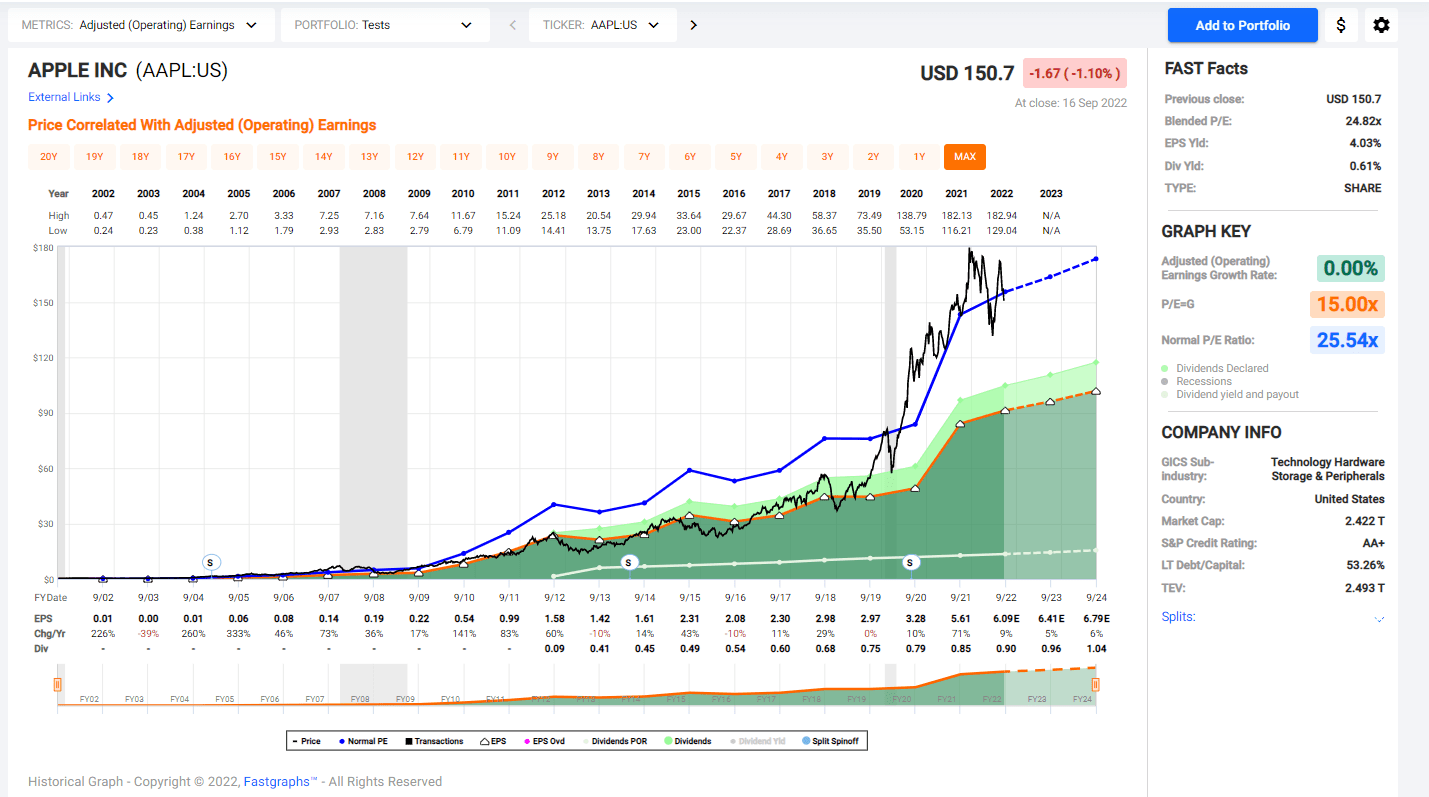
With that in mind, you can see from the Fastgraph above why, despite the 15.20% correction in Apples price that occurred this year it is still way too highly valued for its future growth prospects. If we ignore the unusual situation of the COVID-19 lockdowns and look at what its P/E ratio has been throughout the rest of its history, we can see that its probable future growth rate can’t possibly justify its current valuation.
Other of the QQQ’s Top-10, on first glance, might seem to have better fundamentals, especially Meta, which currently has a P/E ratio of only 13.31 after having fallen 56.24% since January of 2022. But Meta’s P/E is as low as it is because of its very disappointing July earnings report and the growing strength of competitors like Tik Tok, which suggest that its future earnings will not be impressive. The Fastgraphs Forecast Graph below makes it clear that as much as it has already dropped, Meta’s price is still way out of line with its earnings potential.
Fastgraphs Forecast Graph for Meta
Fastgraphs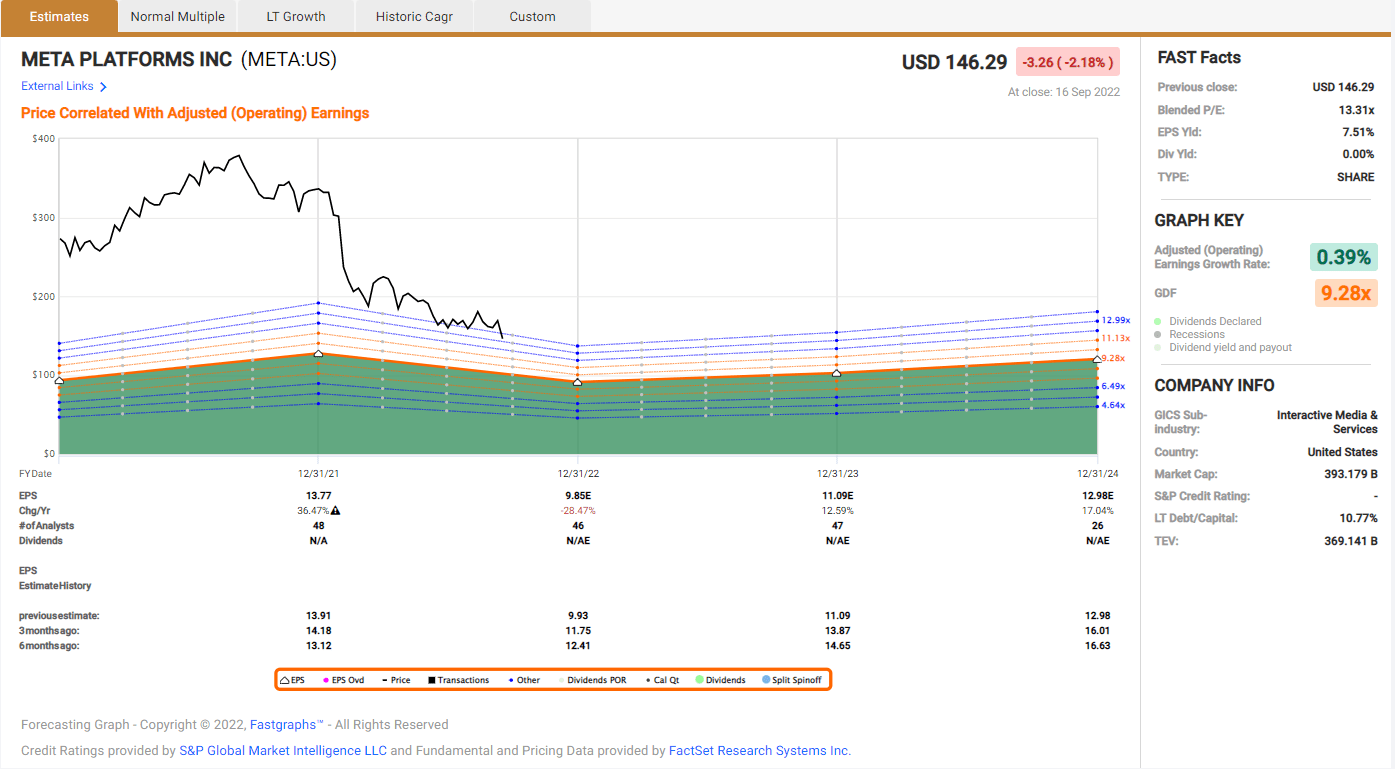
The slowing of sales for megacap stocks like Apple, Alphabet and Amazon filter down to slowing sales for the semiconductor and software companies that have prospered serving Apple and smartphone users. It is likely that the smart phone revolution has matured and can no longer drive the kinds of aggressive growth that it did a decade ago.
This march toward maturity was turbocharged by the huge burst of sales many tech companies in QQQ experienced during the COVID-19 era. This was an anomaly that caused too many companies, in particular Amazon, to over-expand, not realizing how temporary that and the slowdown in sales would be and the extent that those sales were cannibalizing sales in future years.
If you look at the graph of QQQ’s price history at the top of this article and extend the price line forward using the curve that prevailed up before COVID-19 struck you can easily see that reverting to just a more normal price for QQQ would imply a significant drop in price from where QQQ is now.
The takeaway here is that investors in QQQ better expect it to behave more like an ETF filled with maturing companies whose valuations will over time correct downwards to better match their future earnings growth prospects, which may mean that QQQ’s price has a lot farther to fall. And it will fall while offering a minimal dividend to console shareholders.
Inflation and Overvalued Tech is a Combo We Have Not Seen Before
The End of “The Fed Model”
The high inflation of the 1970s began dropping just as the PC revolution began in 1982. Since that time, interest rates have trended down relentlessly, making stocks more and more appealing to investors and making it easier and easier for growth companies to finance their expansion. By 2009, when QQQ’s price started its long rise, companies were able to borrow at rates rarely seen before while investors were being driven to invest in stocks as near zero Fed rates persisted with only a very short period of slight relief in 2018.
Throughout this period the high P/E ratios of all the broad market stock indexes, and especially QQQ, have been justified by the belief of many investors in the Fed Model, an economic theory which argues that fair value for stock valuations can be adjusted based on an equation that compares the earnings yield of the S&P 500 with the yield on 10-year U.S. Treasury bonds. With rates near zero, many investors came to believe that it made sense to buy even the slowest growing stocks, like Pepsico, at prices that gave them valuations usually seen in companies growing earnings at a rate 10 times higher than the single digit earnings growth-rates characteristic of mature companies.
This 40-year period has come crashing to an end. Many investors are still deluding themselves that the Fed will back down and give them back their near-0% rates. But this is a mistake those of us who lived through the inflation of the 1970s are not likely to make. The Fed is now making it clear that it sees it primary responsibility as being that it must bring inflation down to what may be an unrealistically low 2% target. Furthermore, the Fed has learned the error of its ways in leaving rates too low for too long and is not likely to repeat that error even if it is able to bring rates down to its target.
Higher rates are here to stay. Cheap money is gone and this represents yet another headwind for the many, only slightly profitable growth companies in QQQ who have relied on cheap debt to grow.
The End of Cheap Debt Will Impact Highly Indebted Companies
Many companies during this time took advantage of low interest rates to shift much of their capital structure to loans, as you can see from this chart of the Debt/Capitalization percentages of the top 10 stocks in QQQ.
Top 10 Stocks in QQQ Debt/Capital
| Name | Long-Term Debt/Capital |
| Apple | 53.26% |
| Microsoft | 45.55% |
| Amazon | 30.89% |
| Tesla | 9.30% |
| Alphabet – C | 9.30% |
| Alphabet – A | 10.77% |
| Meta | 29.54% |
| Nvidia | 29.38% |
| Pepsico | 57.49% |
| Costco | 10.97% |
Source: Fastgraphs using data from S&P Global
Much of this debt will have to be refinanced and that, going forward, is another headwind to these companies’ ability to grow earnings.
Inflation Raises The Cost of Doing Business While Consumers Have Less to Spend
Debt is just one part of the challenge posted by inflation. Companies overhead will grow as everything from the price of shipping product to the cost of heating and cooling their physical plants rise. All this cuts into the earnings they can report.
Consumers faced with much higher housing, food, and fuel costs are also going to have less money to spend which will further dampen the earnings prospects of all companies.
Only a handful of people who were trading stocks in the 1970s, the last time we had rampant inflation, are still active as stock analysts and traders. It may take a while for the true impact of inflation and rising rates to become apparent to this generation of Wall Street professionals. But when it does, expect to see today’s already modest earnings forecasts drop even further.
Momentum Has Turned Downward
Investors in QQQ have been used to believing that momentum is a tailwind. That has been true since 2009. But as was just pointed out in a Bloomberg news service article today, the S&P 500,
… has closed below its 200-day moving average for 110 trading sessions, the longest streak since the bear markets of 2008-2009 and 2000-2002, according to Bespoke Investment Group.
The same is true of QQQ whose price has remained below its 200-day moving average since March 30, 2022, which represents a period of 118 trading sessions.
QQQ and Its 200 Day Moving Average YTD
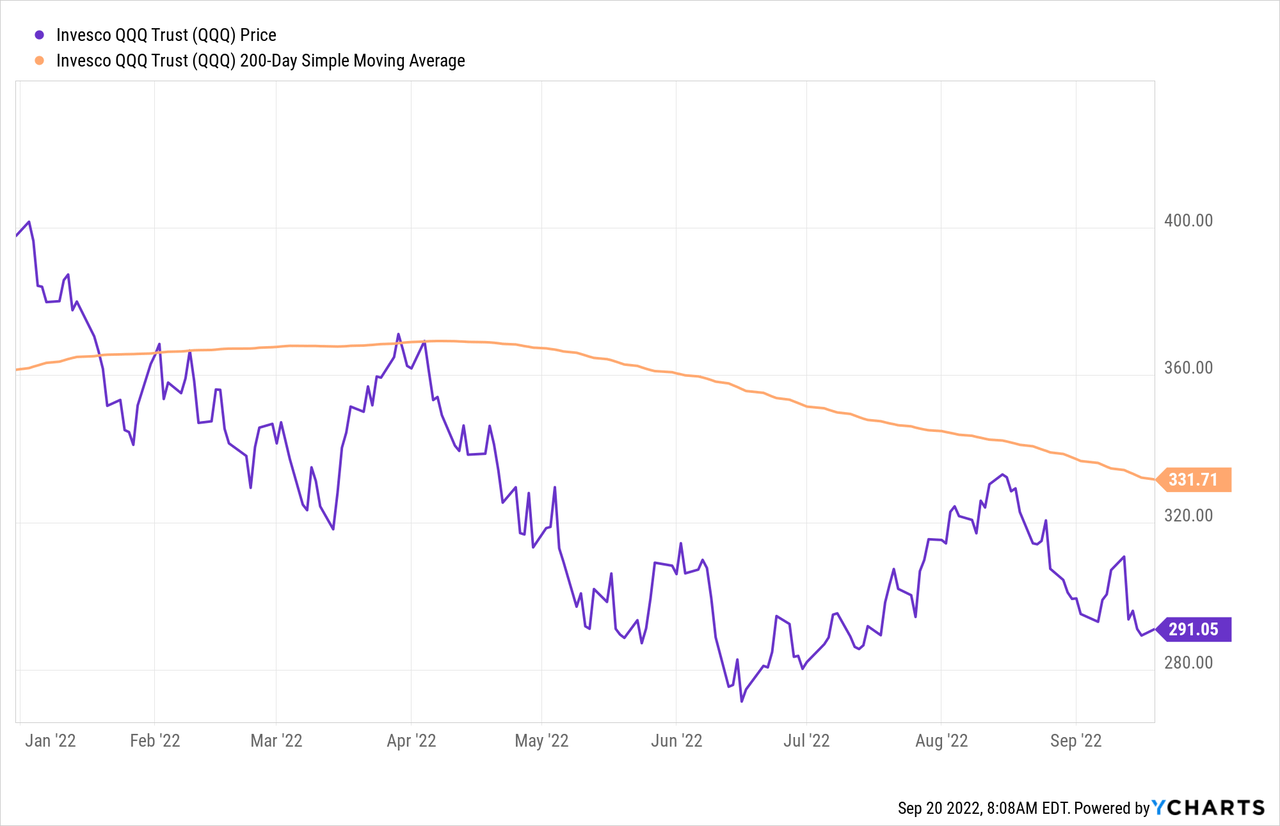
The investors who have been conditioned through the past decade to always buy on dips are starting to think twice, which is what happens when momentum turns negative for a prolonged period. When they stop buying, momentum will turn down even more sharply.
The Deteriorating Relationship Between the U.S. and China Poses a Threat to Many of QQQ’s Holdings
China has made no secret of its intention to take over Taiwan. Investors have pretty much ignored their rhetoric over the years. But China is paying close attention to the example Russia has set of getting away with invading its neighbor, Ukraine. Russia has been able to wreak terrible devastation on that country, while Ukraine’s allies have sat safe at home, sending armaments and money to their ally, but pretty much letting Russia have its way. Russia’s military incompetence may allow the Ukrainians to survive as a nation, but it will be a nation with a devastated infrastructure.
Will this embolden the Chinese government to move on Taiwan? Unlike Russia, China has a very competent industrial base that is quite capable of producing its own weaponry. China appears to be far more competent at getting things done than is Russia, too. Finally, we must not forget that it is a common strategy of governments to engage in wars that ramp up patriotism in order to distract citizens from the country’s other problems. All this is increasing the likelihood that China may become more aggressive.
If the U.S. were to respond to Chinese aggression in Taiwan with the kind of sanctions it and its allies have imposed on Russia, U.S. companies would suffer far more than they have from those Russian sanctions. That’s because of how much of the manufacturing and assembling of products sold by U.S. companies is done in China. In 2018, before COVID-19 struck, U.S. companies imported $539.5 Billion dollars of product that year.
China plays a huge role in the assembly of the tech hardware whose sales are such a big part of QQQ’s Tech Stock’s businesses. It also is deeply involved in the semiconductor business. So is Taiwan, whose manufacturing capabilities would be devastated if a hot war broke out or which could be taken over by a sanctioned China.
You can read a sobering analysis of the effects of “decoupling” U.S. semiconductor manufacturing from China in this article. And remember, the decoupling discussed here is not the sudden shut off of Chinese goods that would result from strict sanctions, but something more gradual. A sudden ceasing of doing business with China would devastate many of the companies in QQQ.
Though it is a U.S. goal to return some tech manufacturing to this country, especially semiconductor manufacturing, we have relied on third world cheap labor for so many decades, and shut down so many of our own manufacturers, that the U.S. simply may not have a population of workers with the skills needed to design, build, or even more importantly do the day-to-day work needed to rebuild that manufacturing base. The heavy prevalence of foreign nationals in our graduate science programs tells us this. In 2017 the New York Times reported that, in STEM graduate programs, “About 64 percent of doctoral candidates and almost 68 percent in master’s programs last year were international students.” I have a relative who teaches engineering students at a university who tells me that they have junior and senior students who still have trouble with using appropriate units. The school graduates them because if they flunked everyone who was unable to get more than a 60% grade on their tests they would end up flunking out two thirds of the class.
QQQ is A Poor Choice for Long-term Investors Going Forward
All this leads me to think that too much of QQQ’s historical success has been accidental, and that nothing in how its companies are selected guarantees that it will continue to be a growth ETF with a heavy innovative tech concentration. Investors who want to concentrate on tech stocks would do better to invest in ETFs that explicitly invest in Tech stocks. I would particularly recommend the iShares U.S. Technology ETF (IYW) which uses a FTSE Russell Index to define what stocks go in what sector, so that unlike ETFs that track the GICS Information Technology Sector its index includes Alphabet and Meta, which the GICS definition of “Tech” exclude. The GICS definition is used by the Vanguard Information Technology ETF (VGT) and The Technology Select Sector SPDR Fund (XLK).
Investors who aren’t tied to investing in any particular sector, but who want to invest in aggressive growth stocks, would be better served investing in ETFs that use sophisticated algorithms to select stocks whose metrics suggest they are likely to grow earnings at a rate higher than the market rather than in QQQ. Though as I have pointed out in a previous article, investors must look beyond the name of an ETF if they are to invest in an ETF that holds what are truly growth stocks. One of the best known “growth” ETFs, the Vanguard Growth ETF (VUG), holds a surprising number of stocks whose growth, both past and forward-looking, is unimpressive because it uses far too crude a definition of “growth”, one which assumes every stock is either a growth or value stock rather than looking for stocks of companies with growth prospects far above average.
Finally, investors who want a broad market index that will benefit from the strong performance of all the largest companies listed on all U.S. exchanges will do better investing in an S&P 500 ETF like the SPDR S&P 500 ETF Trust (SPY), the Vanguard S&P 500 ETF (VOO), or the iShares Core S&P 500 ETF (IVV). Alternatively they might invest in a Total Stock Market ETF like the Vanguard Total Stock Market ETF (VTI) or the iShares Core S&P Total US Stock Market ETF (ITOT). The larger number of holdings of these market cap weighted index dilutes the impact of the very largest companies like Apple but does not eliminate it. The top-10 stocks in these indexes make up about 30% of their total value as compared to QQQ’s approximately 50%.
Now That There Is An Alternative There is No Rush To Buy Any Of These ETFs
But as you might have guessed, I’m not crazy about investing in any stocks right now. As the implications of renewed inflation work their way through the economy, investors may do better settling for a less than ideal investment that is still more likely to preserve their capital than will QQQ or any of the other broad based ETFs mentioned above: short term bonds. Take a look at this listing of Treasury rates.
Bond Rates as of Market Close September 19, 2022
Vanguard
While Inflation is indeed eroding the value of the money you sock away in a 4% treasury bill or note, it is simultaneously eroding the value of NAV of your ETFs — NAVs that have in the past declined dramatically and stayed under peak. QQQ stayed below its 1999 peak for 14 years. And there is no rule that says your ETFs will recover in 14 years, either. I’d rather get my inflation-hammered money back with a 4% gain rather than see my money put into an ETF where those inflation-depleted dollars decline another 15-30%.
We are in a new era of investing and are likely to be in it for another two years or longer. Don’t let Fear of Missing Out cause you to really miss out.
Be the first to comment