


Eoneren/E+ via Getty Images
Seeking Alpha member Varan wrote something very interesting in a comment posted on an article about the 14 stocks just added to the Schwab U.S. Dividend Equity ETF (SCHD). He pointed out that those 14 new stocks together had outperformed SCHD dramatically since the day my article was published, returning an 8.4% gain while SCHD had suffered a loss of 1.5%.
I was pretty sure that the reason for this was that SCHD is market cap weighted and most of the newly added stocks had low market caps. This made me wonder if now that the market’s momentum was trending downward it might be time to move away from market cap weighting which amplifies the momentum of an ETF’s largest stocks.
Market Cap Weighting Did Keep Smaller Companies From Helping Out SCHD’s Performance
A closer look at SCHD’s 14 new additions confirmed that, with the exception of EOG Resources (EOG), they had relatively small market capitalizations.
Added SCHD Stocks with Market Cap and Yield – March 22, 2022
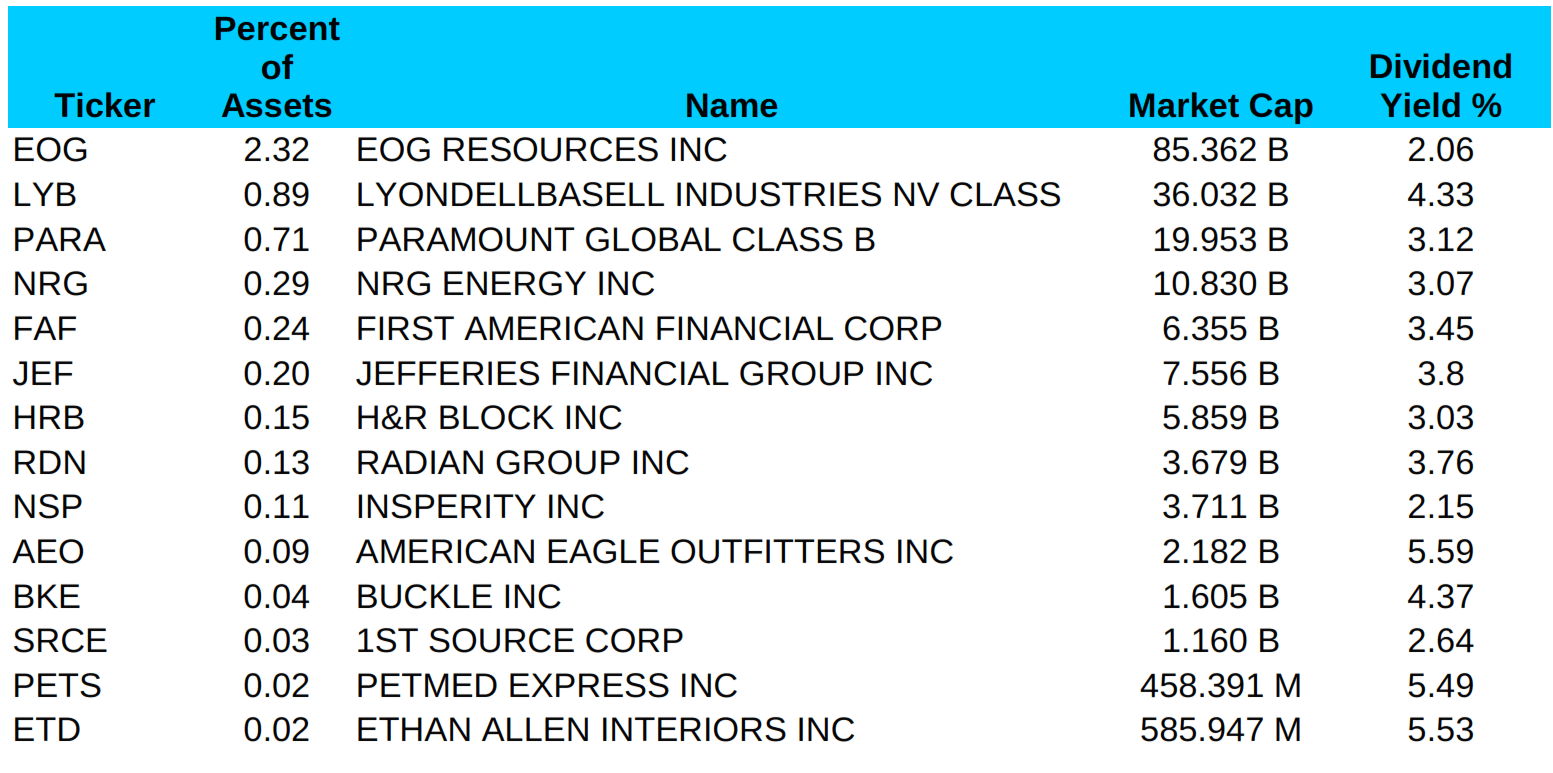
Schwab Asset Management, Factset Data from Fastgraphs, Table by the Author
As you can see from the table above that shows their weights within SCHD when newly added to the ETF, the combined weight of 13 of these 14 stocks only made up 2.92% of the total weight of the ETF. In contrast, the stock that had the largest market cap of all the stocks in SCHD back then, Pfizer (PFE), made up a full 4.30% of the value of the entire ETF. That single stock thus had almost one and a half times as much effect on SCHD’s price action than the other 13 stocks combined.
As a result of this huge weighting disparity, neither the price changes nor the dividends of the smaller newly added stocks had any ability to improve the price performance or yield of SCHD. This matters because since January of 2022 SCHD has performed much worse than several other competing dividend ETFs I follow.
So reflecting on Varan’s comment made me wonder, not for the first time, whether the market cap weighting that had made SCHD perform so well in a bull market for Dividend stocks might hamper it as those stocks lost their appeal to investors in a high inflation, high interest rate world.
Did Other Market Cap Weighted ETFs Excel During the Bull Market?
From 2016 to the end of 2021, which was the period when dividend investing was most popular, SCHD has been by far the best performing of the market cap weighted dividend-focused ETFs. But that was also a period with very low interest rates and a market that with a few short exceptions had a strong upward momentum which I suspected favored market cap weighted ETFS. So I wondered if other dividend ETFs that used market cap weighting also outperformed during this period.
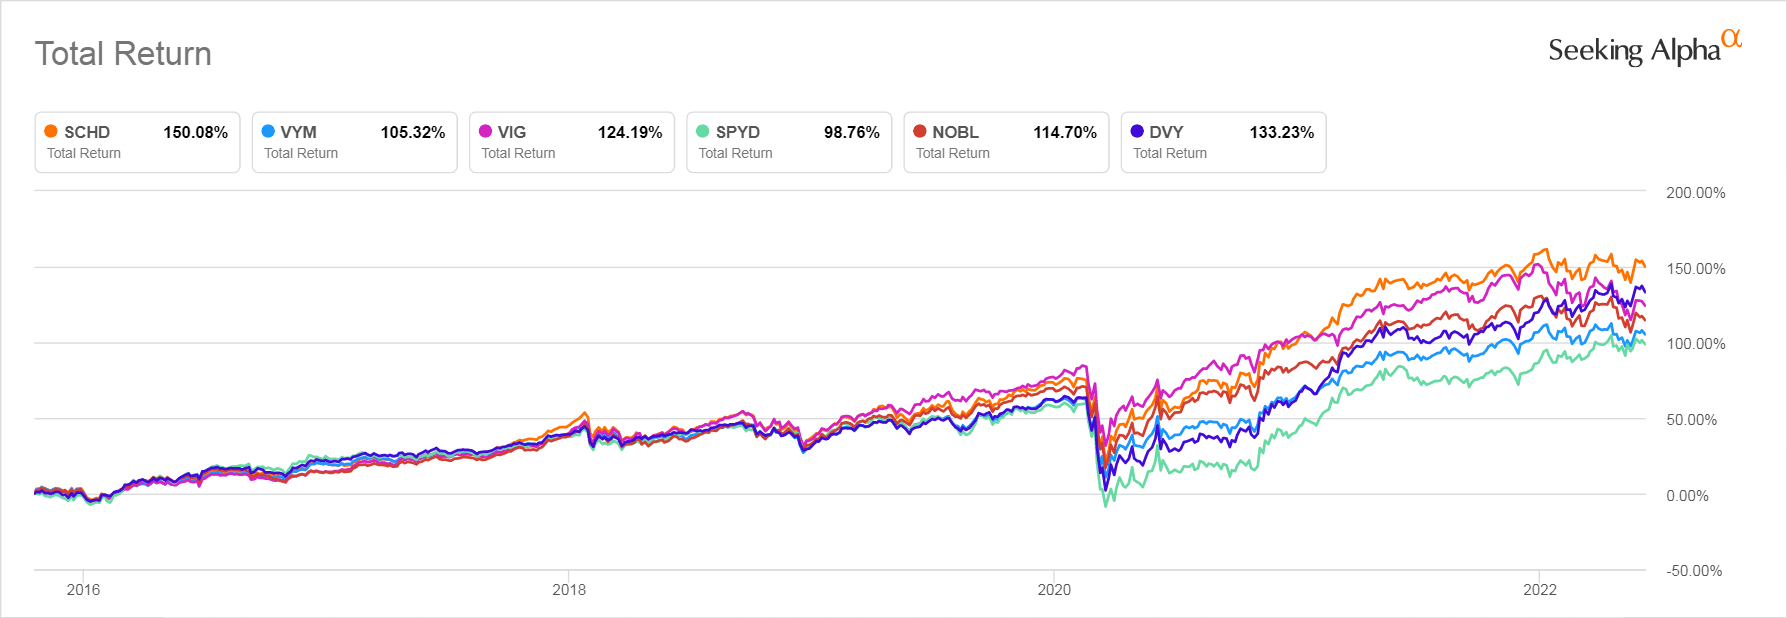
Below you can see how SCHD’s performance compared with that of two other heavily traded market cap weighted ETFs, the Vanguard High Dividend ETF (VYM) and the Vanguard Dividend Appreciation ETF (VIG). For comparison purposes, I also compared these three market cap weighted ETFs with that of three dividend-focused ETFs that are not market cap weighted. Two of these were equal weight ETFs: The SPDR Portfolio S&P 500 Dividend ETF (NYSEARCA:SPYD) and the ProShares S&P 500 Dividend Aristocrat ETF (NOBL). The other ETF, the iShares Select Dividend ETF (NASDAQ:DVY) is dividend weighted, weights its holdings by the size of their forecasted annual dividend yield,
Total Return of Major Dividend ETFs Since October 2015
Seeking Alpha
Market Cap Weighting Did Not Explain Outperformance
The first thing we see on the graph above is that the other two market cap weighted indexes charted did not outperform anywhere near as strongly as SCHD. Both those ETFs hold a lot more stocks than does SCHD, which dilutes the concentration of the most heavily weighted stocks in the index. So, paradoxically, their weaker performance may suggest that the higher concentration in the largest cap stocks SCHD was indeed beneficial during a bull market where the largest cap stocks may be the most popular stocks that investors are enthusiastically bidding up.
With that in mind, I wondered if SCHD’s outperformance vs other market cap weighted dividend ETFs might be explained by it holding only 100 stocks, since VYM holds 443 and VIG 289. DVY also holds 100 stocks, weighted by their dividend yields and was the second strongest performer in the group. In contrast, both of the equally weighted ETFs, SPYD and NOBL, did not perform all that strongly during this period, though they hold fewer stocks than SCHD, 80 for SPYD and 64 stocks for NOBL. So this suggests that the overweighting of stocks by any factor, not just market cap, might lead to better performance in a bull market.
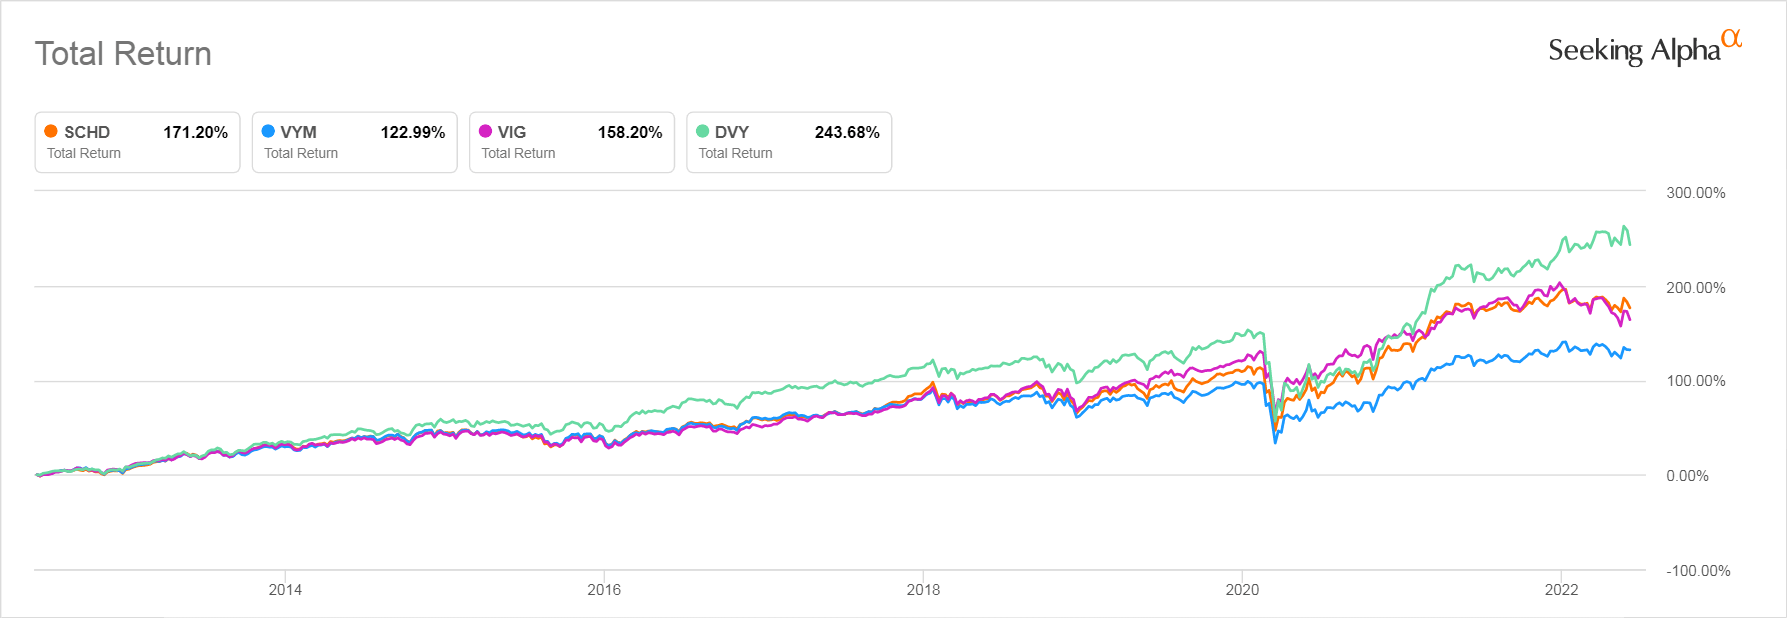
When I extended the time frame to of my charts 10 years — a period that excludes SPYD and NOBL, which started trading more recently, I noticed that DVY actually outperformed the other dividend ETFs trading for the longer period. It is only when we shortened up the time frame we looked at that DVY’s outperformance disappeared. We will share some thoughts about why that happened later in this article.
10 Year Total Return of SCHD, VYM, VIG and DVY Compared
Seeking Alpha
Market Cap Weighting Indexes Are the Most Common Kinds of ETFs Because They Are Cheap to Maintain
Most of the best known ETFs are market cap weighted. That’s because market cap weighting makes an ETF easy to maintain. Once a stock has been added to an index in an amount that corresponds to its market cap at the time of entry there is no need to buy or sell shares again as long as the stock remains in the index. Its weight in the index will rise if its market cap rises and sink when it sinks because the size of its market cap is so heavily dependent on its stock price.
Any other kind of way of weighting an index requires that at some preset time the index must be rebalanced by buying and selling shares of the index’s holdings to bring their weights back into conformity with whatever alternative weighing scheme has been chosen.
There Are Alternative Ways of Weighting Dividend ETF Indexes
Equal Weighting
One alternative approach is equal weighting where each stock’s weight is rebalanced periodically so each stock has almost the same effect on the performance of the ETF as every other. Readers of my articles often ask me if I think that the equal weighted version of the S&P 500, the Invesco S&P 500 Equal Weight ETF (RSP) might be a better investment right now than the market cap weighted ETFs the SPDR S&P 500 ETF Trust (SPY) or the Vanguard S&P 500 ETF (VOO).
It sounds logical that an equal weighted ETF might give you better diversification which might be a benefit when the momentum of largest, previously most popular stocks in an index shifts downwards.
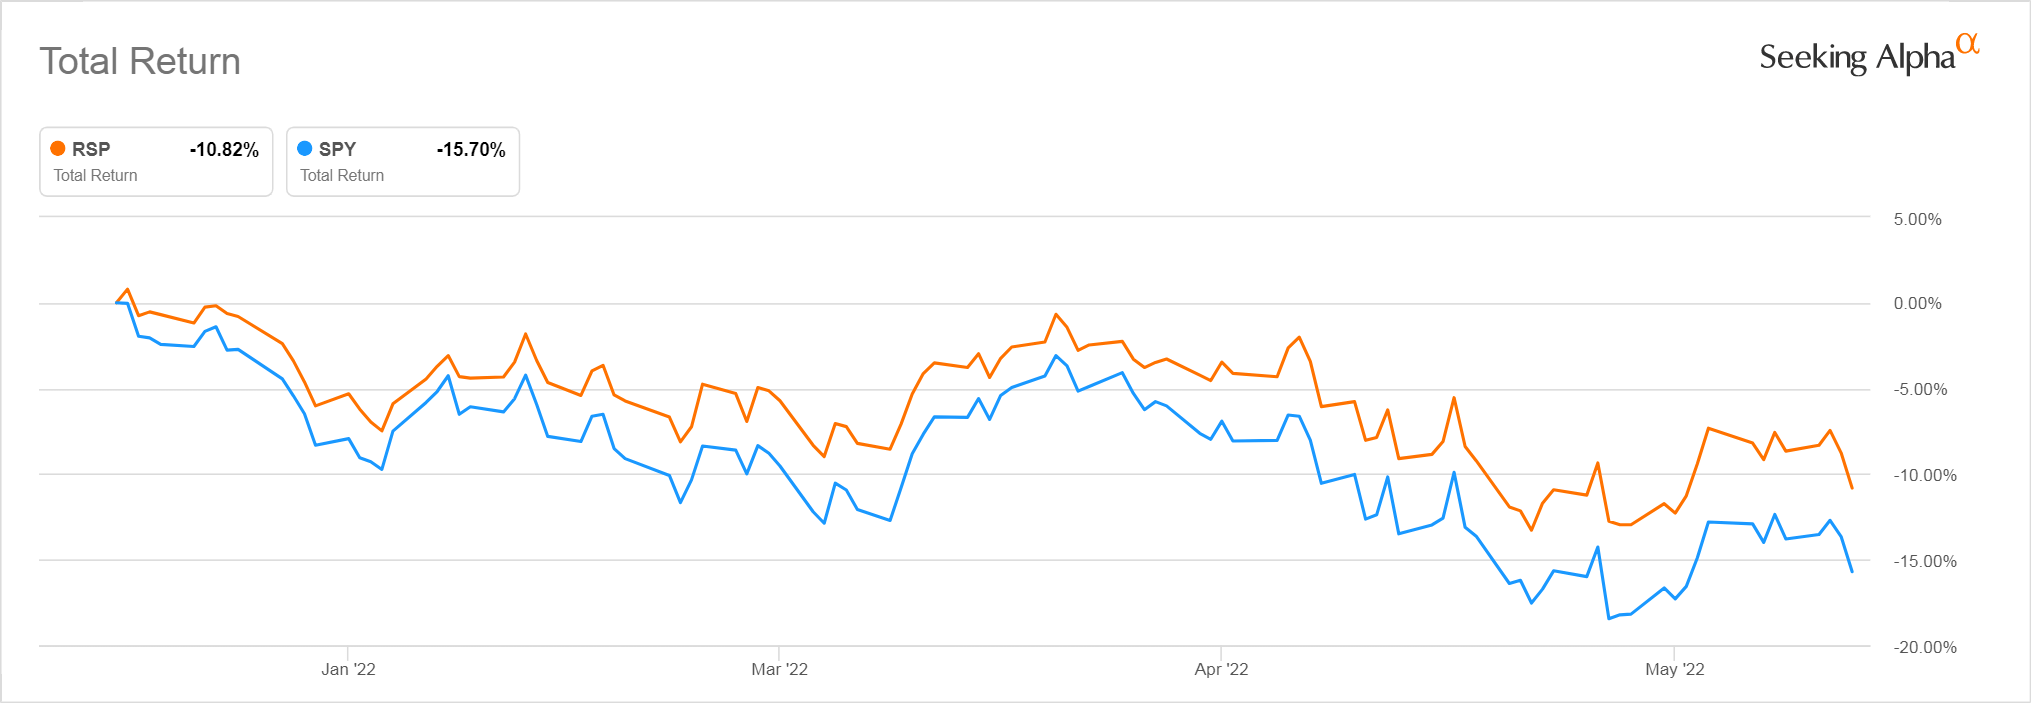
As you can see in the chart below, though the equal weighted RSP has suffered during the near-bear market since January of 2022, it has not dropped as deeply as has SPY.
Equal Weight RSP Performance vs. Market Cap Weighted SPY – YTD
Seeking Alpha
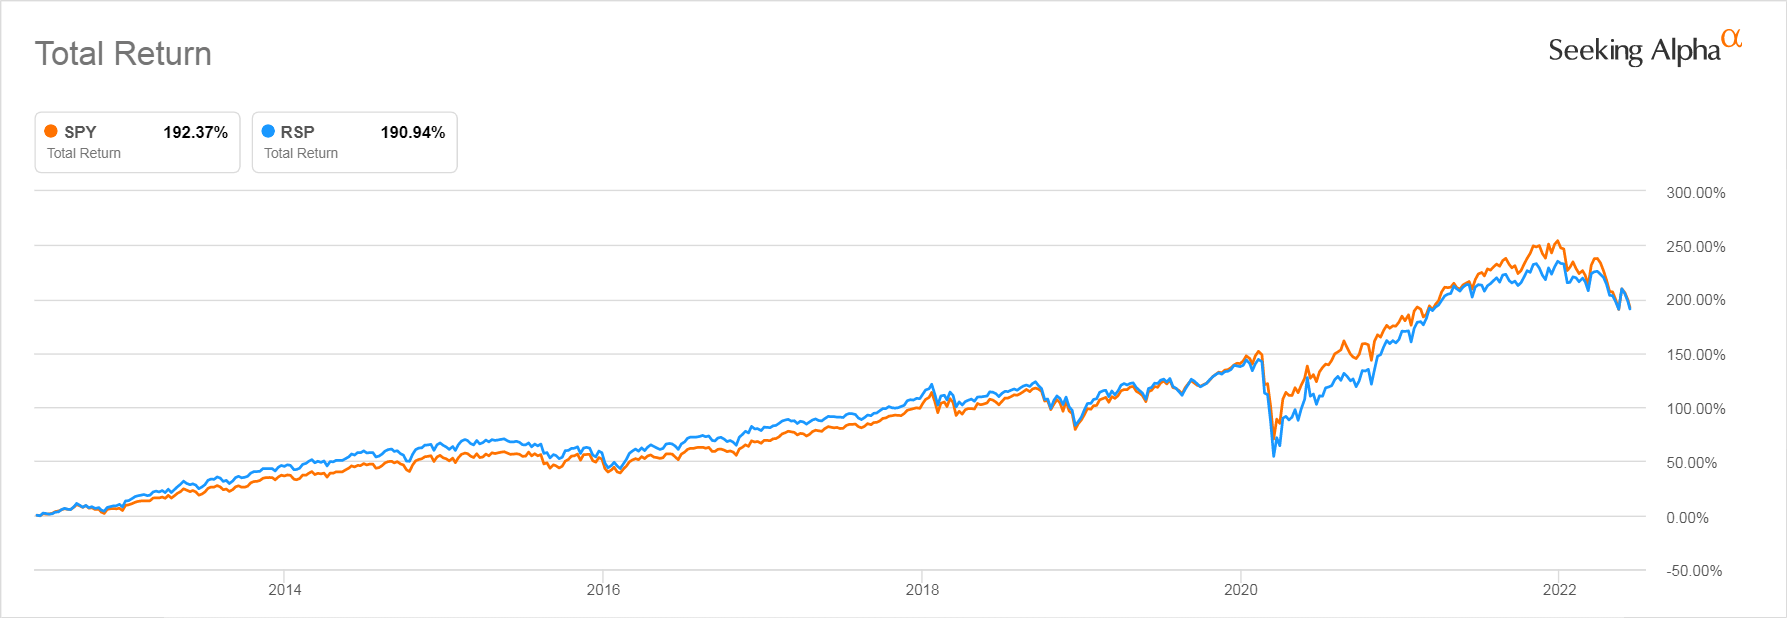
Surprisingly, as the graph below shows, even though SPY seriously outperformed RSP during the most bullish moments of the recent bull market, the 10 year performance of these two S&P 500 ETFs up to the present is almost identical. This is true despite their different weightings and the fact that the equal weighted ETF, RSP, has a .20% expense ratio that is twice SPY’s expense ratio of .0945%.
SPY and RSP 10 Year Total Return June 2012 – June 2022
Seeking Alpha
The Benefits of Equal Weighting Don’t Automatically Extend to Dividend ETFs
When we focus on dividend-oriented ETFs, the picture is not so clear. This is partly because, unlike the case of SPY and RSP where each ETF holds the identical stocks and differs only in how those stocks are weighted, each dividend ETF tracks a specially commissioned index that is different from that of almost all other dividend ETFs. So while you can find quite a few market cap weighted high dividend ETFs, there is no equal weighted ETF available to investors that holds the exactly same list of stocks as SCHD, or VYM, or VIG.
I could only find two equally weighted dividend ETFs that have enough yield, assets, and trading volume to be of interest to the buy and hold investor looking for income. They are the SPDR Portfolio S&P 500 Dividend ETF, SPYD, and the ProShares S&P 500 Dividend Aristocrat ETF, NOBL.
Both these equal weighted ETFs hold a small number of stocks that were selected from the S&P 500 but the criteria for each to select its stocks are very different. As you can see from the graph you saw earlier in this article comparing their long term performance since October 2015, their performance over the longer term has been underwhelming compared to that of the popular market cap weighted dividend ETFs we have looked at even after the latest correction.
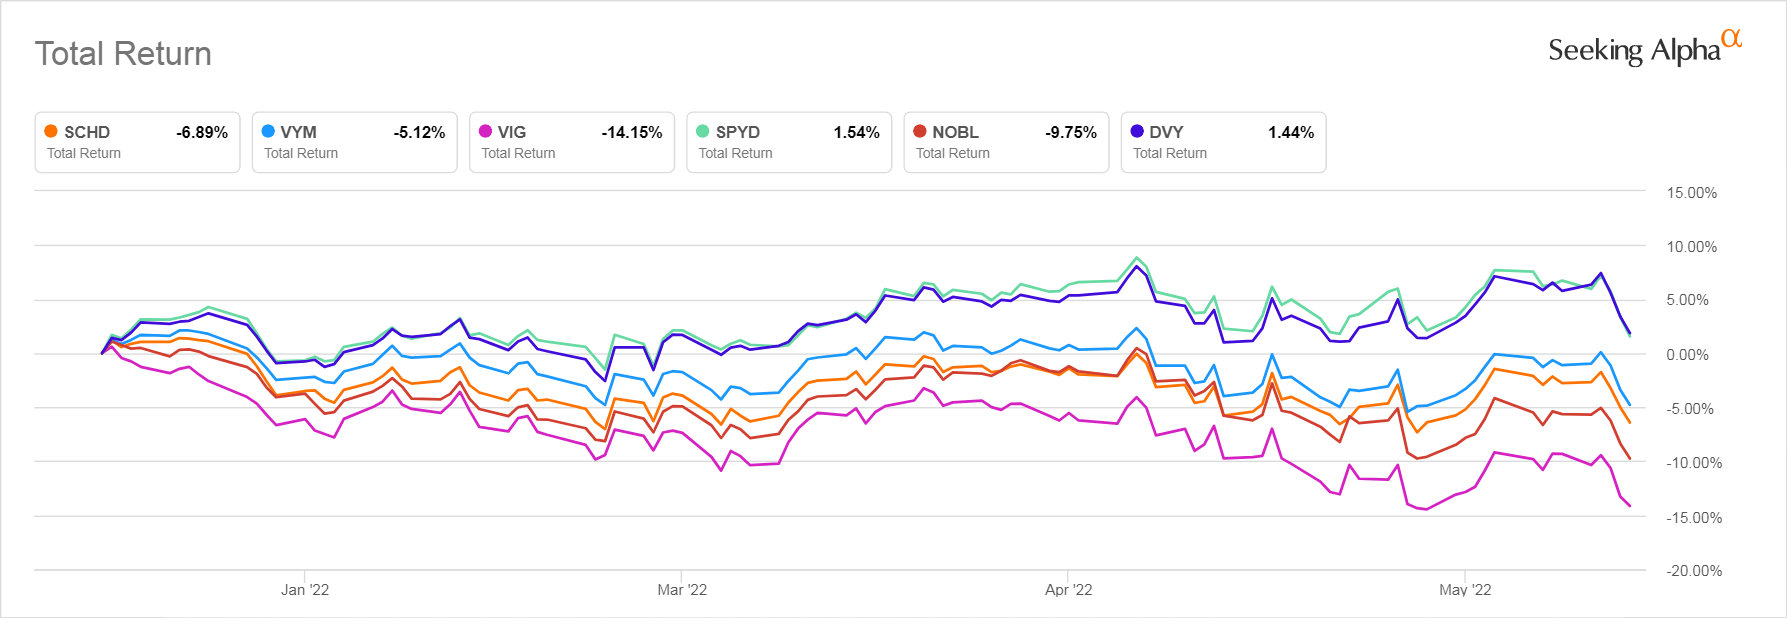
When we compare their performance since the market downturn began we see a strong divergence between SPYD and NOBL. Equally weighted SPYD, which was the worst performing dividend ETF through the longer period is the best performing one over the period of market decline. Equally weighted NOBL, in contrast, was the second worst performer.
Dividend ETFs’ YTD Performance Through May 9, 2022
Seeking Alpha
Clearly, the way that stocks are picked by these ETFs’ indexes has far more to do with their performance than how they are weighted.
SPYD Owes Its Current Outperformance to the Market’s Response to the Energy Surprise
SPYD, which has held up so much better than the others over the past three months tracks the S&P® 500 High Dividend Index, whose methodology for selecting stocks is unusually simple and easy to understand. It selects the 80 stocks in the S&P 500 that are expected to have the highest annual dividend yields. Unlike many other dividend-oriented ETFs that exclude REITs from their holdings, SPYD’s index does hold REITs.
A look at its current holdings explains why after years of performing very poorly its performance has been so good since the beginning of 2022: Eight of its top 10 holdings are Oil industry stocks!
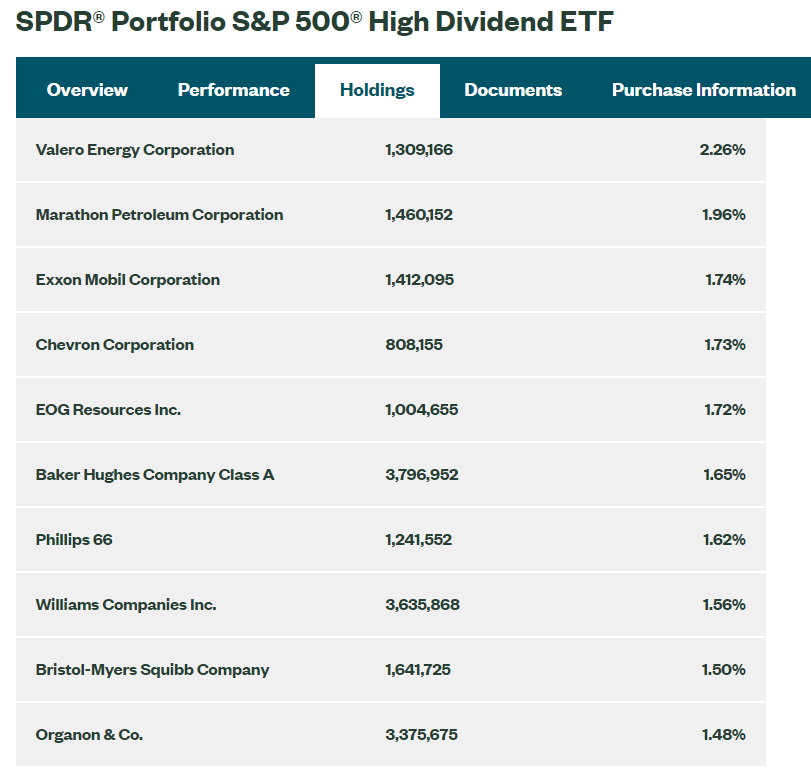
ssga.com
This may explain SPYD’s recent performance advantage, but we must remember that as the prices of these oil stocks surge, their yields will drop, which will eliminate them from the short list of 80 stocks held by SPYD. Its profit from the oil surprise will likely only last for a single year. Then it may revert to its previous mediocre performance.
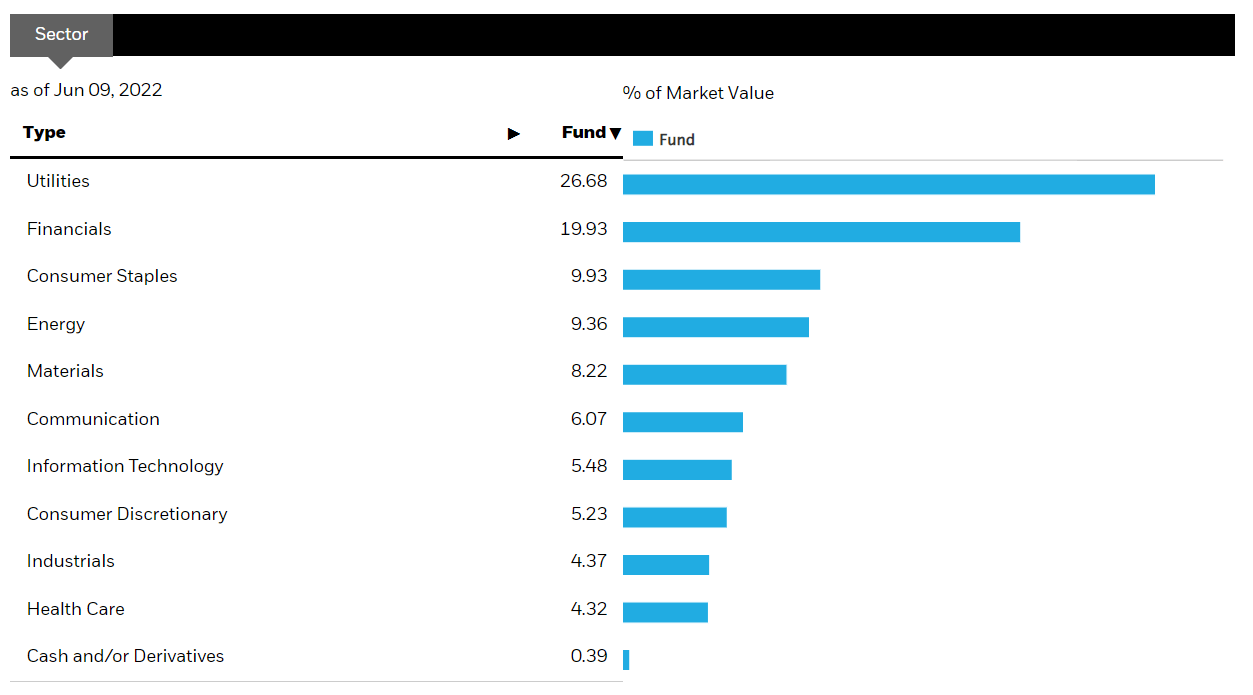
A Heavy Allocation to Previously Out-Of-Favor Sectors Helped Recent Performance
A look at the sector distribution of the 80 stocks it holds shows the following distribution. Note that the sectors that investors ignored during the previous boom — Utilities and Energy, make up over a third of the total value of the ETF’s holdings. The Utility sector hasn’t performed as dramatically as the Energy sector, but they have done far better than the market as a whole. ETFs that track it like the Vanguard Utility ETF (VPU) and the Utilities Select Sector SPDR Fund (XLU) have not suffered losses YTD.
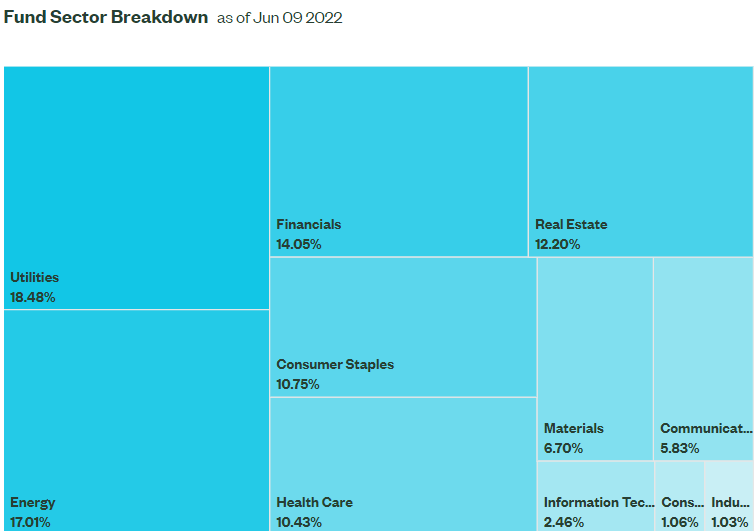
ssga.com
REITs have also helped SPYD outperform. Market cap weighted real estate ETFs have done poorly, with the Vanguard REIT ETF (VNQ) total return down 19.53% YTD, more than the S&P500’s total return loss of 18.12%, but those market cap weighted ETFs have been dominated by the data center and cellphone REITs like American Tower (AMT) whose prices were bid up so high that their dividend yield dropped below 2%, making them ineligible to join SPYD. The 11 REITs that SPYD holds are the ones with dividends over 4% like Iron Mountain (IRM), Ventas (VTR), Welltower (WELL), and Realty Income (O), whose prices have declined far less than the market as a whole.
SPYD holds nine Consumer Staples stocks, mostly food stocks and cigarette stocks but only a single Consumer Discretionary sector stock, Newell Brands (NWL) whose products seem to me to be more like staples–cleaning products, Rubbermaid, and First Alert smoke and CO2 alarms.
SPYD holds very few Tech sector stocks. Most of Tech and Communications sector stocks that drove the market gains of the broader market indexes do not pay any dividends and those that do like Microsoft (MSFT) and Apple (AAPL) pay dividends too low to be included in SPYD’s holdings. The exclusion of those stocks, of course, explains SPYD’s very mediocre performance over the longer period compared to other dividend ETFs.
A Lack of Quality Screening Is an Ongoing Problem for SPYD
But there is another issue with SPYD that investors have to keep in mind. SPYD’s index uses no screen for quality save that a stock be in the S&P 500, which implies that it has had a profit over the past year. Some of the stocks that have the highest yields are those with the most challenged business models. I noted that when I looked up both Welltower and Ventas, Seeking Alpha gave me the warning that based on their Quant ratings these stocks are at risk of performing badly. When I looked up Newell Brands Seeking Alpha warned me that its dividend was in danger of being cut.
SPYD benefited from holding the stocks of a lot of out-of-favor, business-challenged companies whose high dividends were not necessarily a sign of value but possibly a realistic reflection that they had nothing else to offer investors, which suddenly became popular when inflation, tamed for decades, came roaring back.
SPYD’s Historic Dividend Yield Has Been Volatile and Unpredictable
Possibly because its constituents change each year based on how high their dividends might be, investors in SPYD have seen their dividend yield fluctuate up and down. Below you can see Seeking Alpha’s Quant Scores for SPYD’s Dividend.
SPYD’s Dividend Ratings from Seeking Alpha
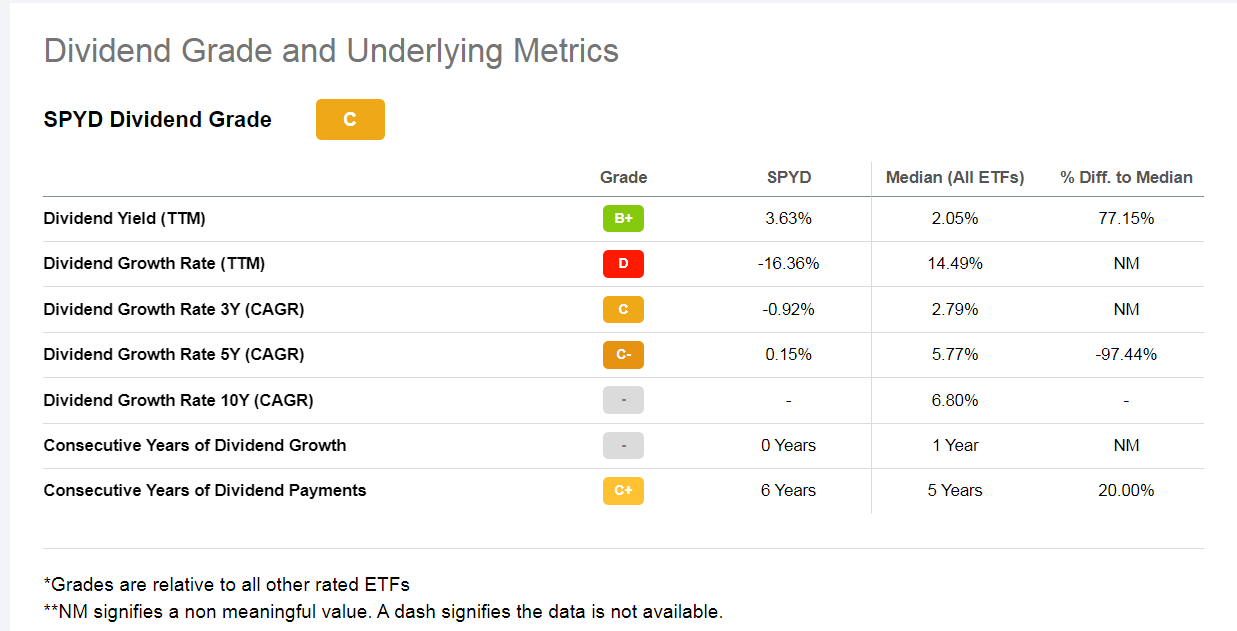
Seeking Alpha
The lack of dividend growth negates the benefit of the relatively high dividend it is paying right now, as it is not at all certain that SPYD will be yielding anything similar over the next few years.
NOBL Is No Longer a High Dividend ETF Because its Stocks Became Overvalued and Drove Down its Yield
The other actively traded equal weighted dividend-focused ETF is the Proshares S&P 500 Dividend Aristocrat ETF (NOBL). It holds the stocks selected out of the S&P 500 index that have increased their dividends for at least 25 consecutive years and NOBL also holds shares of REITs. Once selected, its holdings are equal-weighted, with sector weights capped at 30%.
The P/E ratio of NOBL as of 4/30/2022, the latest date for which ProShares provides information, was 19.17, which is higher than that of the other dividend ETFs we have been looking at. This isn’t surprising given how popular dividend growth investing became over the past decade, which made the Dividend Aristocrats very appealing to investors.
NOBL’s P/E ratio is far higher than the 15.74 P/E ratio Schwab reports for SCHD, whose index applies a mild valuation screen to the stocks it selects (that figure is reported as of 3/31/2022). It is higher still than the 12.84 P/E ratio State Street Global Advisors reports for SPYD, which selects stocks for high dividends, not dividend growth (that data is reported as of 6/8/2022).
The impact of its high valuation on NOBL’s return is felt most strongly in its dividends. Though the methodology of NOBL’s index ensures that each stocks dividend must increase every year, the currently reported distribution yield of the NOBL ETF is only 1.54% (reported as of 4/30/2022). Its SEC yield is still under 2.00% at 1.89% for the trailing 12 months.
NOBL’s underperformance in both the YTD and the longer-term period, which you can see on the charts above, may be partly due to the way that its holdings’ dividend yields sank as their the prices were bid up to very high valuations, making them less attractive to new investors.
Because NOBL requires that the stocks it holds must have been paying dividends for at least 25 years, it holds 49% of its weight in aging Consumer Staples and Consumer Discretionary sector stocks, sectors that have been popular during previous market downturns, but only because in previous market downturns unsexy consumer stocks have been very well-valued, which is not the case today. In contrast to SPYD, Energy Sector stocks only make up 3.68% of its weight and utilities 5.11%.
Clearly, equal weighting alone is not necessarily a winning strategy in selecting high dividend ETFs. The principles on which a dividend ETF’s stocks are selected play a far greater role.
Dividend Based Weighting
Another alternative way to weight an ETF is to use some kind of fundamental weighting scheme. There are ETFs that use factors like momentum or valuation to weight their ETFs. In the dividend ETF realm we find ETFs that weight their holdings by their dividend yields. The most heavily traded dividend ETF that fits this description is the iShares Select Dividend ETF (DVY).
DVY’s index is the Dow Jones U.S. Select Dividend Index. It selects stocks, excluding REITs, from a broad market index that have been screened for having a market cap greater than $3 Billion dollars, a 5-year history of paying dividends, dividends per share higher than the 5-year average, a solid 5-year average dividend coverage ratio, positive earnings over the past year, and a respectable trading volume.
The index constructors then rank the stocks that pass these screens and select the top 100 for the index where they are weighted by there expected annual dividend yield. Once in the index, a stock can remain until it drops below the 200th stock in its yield ranking. No sector can make up more than 30% of the index (which is a lot), and stocks that make up more than 10% of the value of the whole index have their holding reduced at the time of a quarterly rebalancing.
As this is not a market cap weighted index, the weightings of DVY’s holdings have to be manually adjusted periodically so that the dividend weighting is restored. This is done once a year in March.
If you want to know more, the details of the Dow Jones U.S. Select Dividend Index’s methodology are laid out on page 21 of this SP Global Methodology document.
Though its methodology for picking high yielding stocks is much more complex than that of SPYD, in practice DVY and SPYD have performed in a very similar way as the market has declined YTD. What is very different between these two high dividend ETFs is that through the boom times DVY, like every other dividend-focused ETF we have examined, has greatly outperformed SPYD.
Interestingly though their performance has been similar in the recent period, DVY’s top holdings are more diverse than are SPYDs.
DVY’s Top Holdings As Of 6/9/2022
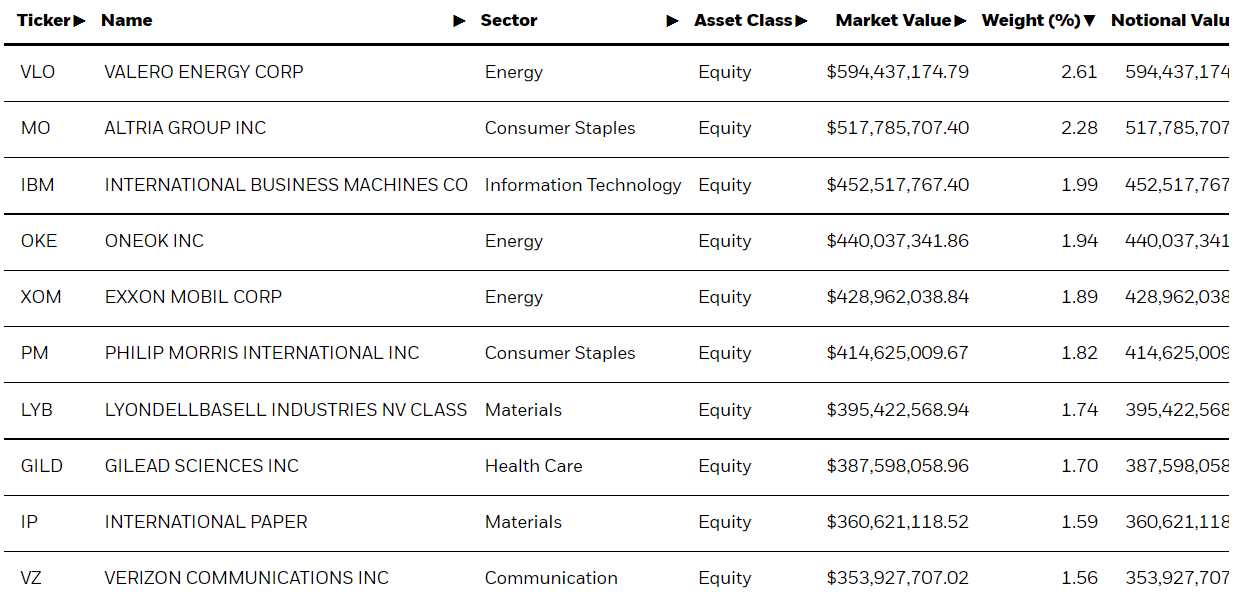
ishares.com
Dividend Weighting in Practice Ends Up With Weights Very Similar to Equal Weighting
Something else stands out in this list of the most highly weighted stocks: their percentages look a lot like what we saw when we looked at the equal weighted holdings of SPYD. The differences between the holding sizes aren’t anywhere near the magnitude of what we saw in market cap weighted SCHD.
That’s because the differences between the size of highest and lowest dividends paid by the stocks that would qualify as having higher than median dividends isn’t all that large. Valero (VLO)’s price has surged since its dividend-based allocation was set in March, but its yield of 5.22% at the end of 2021 wasn’t far different from Verizon’s 4.85% or for that matter from the yield of the stock held in DVY that has the smallest weight in the ETF, which is Avista Corp.(AVA) It’s dividend yield was 4.98% at the end of 2021. Thus, though the stocks are weighted by their yields, the actual allocation percentage weight each of the 100 stocks in DVY is going to be pretty similar.
DVY’s Sector Allocation
Blackrock.com
Interestingly, probably due to the screens it applies, DVY has a smaller allocation to Energy and Health Care stocks than does SPYD. My guess is that these screens, which would eliminate the kinds of stocks that Seeking Alpha’s Quant system rates as potentially disappointing investments, explain why DVY’s longer term performance is so much better than that of SPYD.
DVY’s Dividend History is Better than SPYD’s But Worse than SCHD’s
Below you can see how Seeking Alpha’s Quant feature rates DVY’s dividend.
DVY’s Dividend Ratings from Seeking Alpha
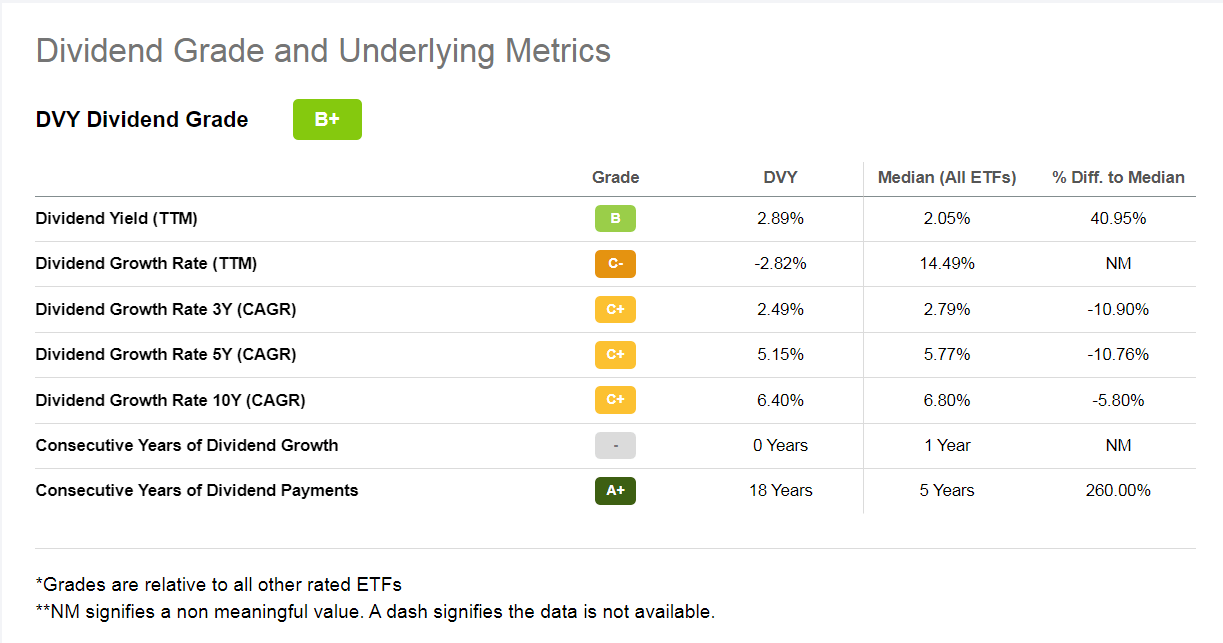
Seeking Alpha
As you can see, it has grown its dividends very slightly over the 3-, 5-, and 10-year periods though not over the past year, unlike SPYD which has only grown its dividends by less than 1% over a 5-year period.
Now that you’ve seen the Seeking Alpha Dividend Ratings for the dividend ETFs that are performing the best YTD, SPYD and DVY, it is worth going back and taking a look at SCHD’s Dividend Rating.
SCHD’s Dividend Ratings from Seeking Alpha
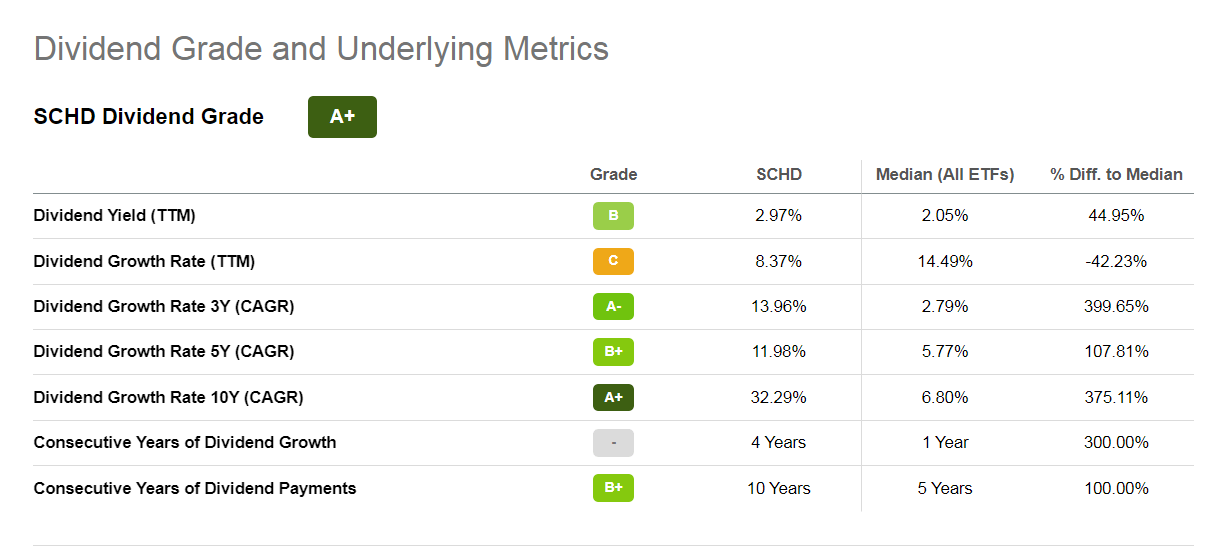
Seeking Alpha
SCHD’s dividend growth is far better than that of the alternatively weighted ETFs that are performing well now, SPYD and DVY.
DVY Comes the Closest to Being a Better Weighted ETF than SCHD for a Bear Market
The conclusion we have to draw here is that equal weighting is only going to be beneficial to buy and hold investors if the methods used to select the stocks that are equally weighted ensure they are of high quality. DVY would appear to be the best of the alternatively weighted dividend-focused ETFs for this reason.
We have seen that DVY’s weighting is in practice very similar to being equally weighted. It may be that its relationship to SCHD, which uses similar screening to pick its stocks, may be more similar to that of RSP and SPY going forward. Its near-equal weighting worked against it in the boom times when many of SCHD’s stocks saw their market caps surge due to overvaluation, but may make DVY as good an investment over a full cycle of bull and bear.
Even though its current performance is very similar to that of equal weighted SPYD, DVY’s screens ensure that its holdings are of better quality than those held in SPYD and that they are more likely to lead to long term success both in terms of their share prices and their dividend yields. DVY’s longer term performance has been much better than SPYD’s and as the bear market knocks down the valuations of overvalued stocks, it may again become the strong performer it was a decade ago.
Now Is Not The Time to Invest in High Dividend ETFs
That said, though DVY is a reasonable alternative to currently underperforming market cap weighted SCHD, I would not put new money into any of these ETFs right now. Its been more than a decade since investors could get safe Fixed Income yields that compete with the yields of these high dividend ETFs. But as I was writing on June 10, I saw a 5-year Treasury yielding 3.30%, a yield higher than all but SPYD currently offers. And unlike SPYD’s yield, that Treasury yield is guaranteed for the life of the note.
With inflation still surging, it is quite possible we will see Fixed Income yields of 5% or higher. This will have a devastating effect on the share prices of stocks whose main appeal to investors has been the income they produce.
The time to invest in dividend ETFs of any kind is when their yields are several percentage points higher than safe Fixed Income yields, especially after a bear market that may send investors who have only invested during the low rate era fleeing away from stocks. That is the time when DVY may be an excellent investment.
Be the first to comment