

phototechno
This ETF review series aims at evaluating products regarding the relative past performance of their strategies and metrics of their current portfolios. As holdings and weights change over time, updated reviews are posted when necessary.
Strategy and portfolio
The iShares S&P Mid-Cap 400 Value ETF (NYSEARCA:IJJ) has been tracking the S&P Mid-Cap 400 Value Index since 7/24/2000. It has 301 holdings, a 12-month trailing yield of 1.97%, a total expense ratio of 0.18%.
As described by S&P Dow Jones Indices, S&P 400 constituents are ranked in Value and Growth styles using three valuation ratios and three growth metrics. The valuation ratios are book value to price, earnings to price and sales to price. By construction, 33% of the parent index constituents exclusively belongs to each style, and 34% belongs to both styles. The Value subset serves as S&P 400 Value Index and is rebalanced annually. It is capital-weighted, with an adjustment for constituents belonging to both styles. For example, a company with a Value rank better than its Growth rank is given a larger weight in the Value Index than in the Growth Index.
Aggregate valuation metrics of IJJ are a bit disappointing: they are not much better than for the parent index S&P Mid-Cap 400, represented in the next table by the iShares Core S&P MidCap ETF (IJH). In fact, IJJ is even a bit more expensive regarding the price-to-cash-flow ratio.
|
IJJ |
IJH |
|
|
Price/Earnings TTM |
12.87 |
13.89 |
|
Price/Book |
1.81 |
2.34 |
|
Price/Sales |
0.98 |
1.26 |
|
Price/Cash Flow |
11.27 |
11.1 |
Source: Fidelity
The top 3 sectors are financials (18.8%), industrials (17.8%) and consumer discretionary (17.4%). Compared to the mid-cap benchmark, IJJ moderately overweights financials, consumer discretionary and real estate. It massively underweights energy.
Sector breakdown (chart: author; data: iShares)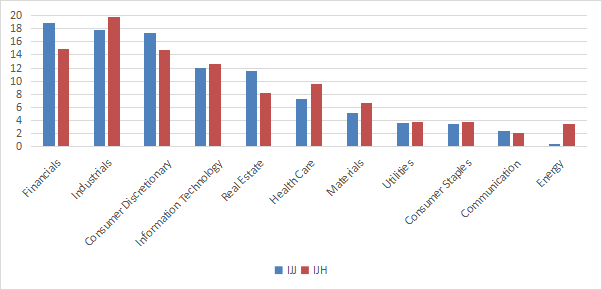
IJJ has about 300 holdings. The top 10 names represent 8.3% of asset value. The next table reports their weights and valuation ratios. The heaviest name weighs about 1%, so risks related to individual stocks are very low.
|
Ticker |
Name |
Weight% |
P/E ttm |
P/E fwd |
P/Sales |
P/Book |
P/FCF |
Yield% |
|
Jabil Inc. |
0.98 |
11.98 |
9.86 |
0.33 |
4.51 |
28.58 |
0.39 |
|
|
Cleveland-Cliffs Inc. |
0.94 |
4.51 |
7.16 |
0.46 |
1.54 |
5.09 |
0 |
|
|
Regal Rexnord Corp. |
0.91 |
21.42 |
14.79 |
1.99 |
1.63 |
39.73 |
0.90 |
|
|
Reinsurance Group of America, Inc. |
0.85 |
15.90 |
9.17 |
0.61 |
2.71 |
8.14 |
2.20 |
|
|
Webster Financial Corp. |
0.84 |
15.51 |
8.07 |
3.53 |
1.27 |
9.25 |
2.90 |
|
|
Alcoa Corp. |
0.81 |
N/A |
21.53 |
0.72 |
1.82 |
34.09 |
0.77 |
|
|
Capri Holdings Ltd. |
0.75 |
11.52 |
9.63 |
1.54 |
4.23 |
51.37 |
0 |
|
|
UGI Corp. |
0.74 |
45.80 |
13.23 |
0.73 |
1.68 |
N/A |
3.59 |
|
|
Jones Lang LaSalle Inc. |
0.73 |
9.90 |
11.33 |
0.40 |
1.49 |
40.10 |
0 |
|
|
Lear Corp. |
0.73 |
25.65 |
13.00 |
0.40 |
1.73 |
N/A |
2.19 |
Ratios: Portfolio123
Competitors
IJJ has two direct competitors tracking the same underlying index: the SPDR S&P 400 Mid Cap Value ETF (MDYV) and the Vanguard S&P Mid-Cap 400 Value ETF (IVOV). The next table compares their assets under management, liquidity, fees and age.
|
S&P Mid-Cap 400 Value ETFs |
IJJ |
MDYV |
IVOV |
|
Assets |
$8.34B |
$2.74B |
$894.13M |
|
Avg Daily Volume |
641.48K |
334.02K |
14.89K |
|
Expense Ratio |
0.18% |
0.15% |
0.15% |
|
Inception |
7/24/2000 |
11/8/2005 |
09/07/2010 |
Since IVOV inception, IJJ and IVOV have nearly the same path, whereas MDYV shows some negative drift (probably due to tracking errors).
IJJ, MDYV and IVOV (Portfolio123)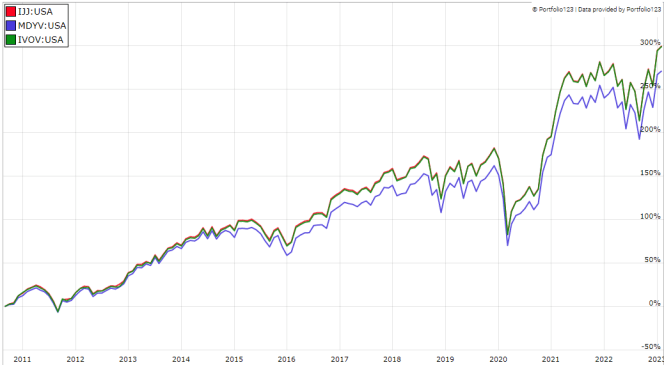
Performance
Since inception (07/24/2000), IJJ has outperformed the parent index by 1.17 percentage point in annualized return (see next table). Risk measured in drawdown and standard deviation of monthly returns (volatility) is similar.
|
since July 2000 |
Total Return |
Annual. Return |
Drawdown |
Sharpe ratio |
Volatility |
|
IJJ |
833.39% |
10.43% |
-58.00% |
0.55 |
18.62% |
|
IJH |
634.34% |
9.26% |
-55.07% |
0.5 |
18.07% |
Data calculated with Portfolio123
In the last 10 years, IJJ is on par with IJH and beats another mid-cap value fund tracking another index: the iShares Russell Mid-Cap Value ETF (IWS).
IJJ, IJH and IWS, last 10 years (Portfolio123)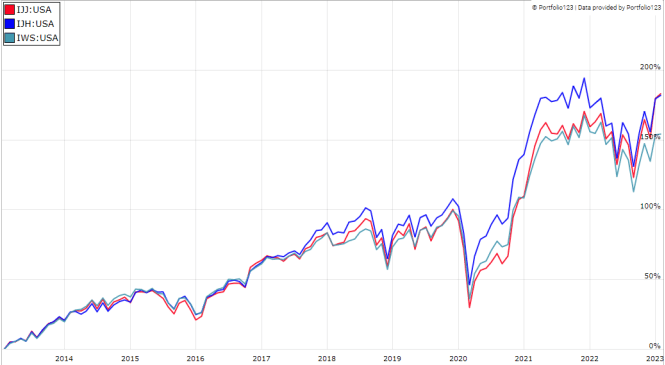
Comparison with my Dashboard List model
The Dashboard List is a list of 60 to 80 stocks in the S&P 1500 index, updated every month based on a simple quantitative methodology. All stocks in the Dashboard List are cheaper than their respective industry median in Price/Earnings, Price/Sales and Price/Free Cash Flow. An exception in utilities: the Price/Free Cash Flow is not taken into account to avoid some inconsistencies. Then, the 10 eligible companies with the highest Return on Equity in every sector are kept in the list. Some sectors are grouped together: energy with materials, communication with technology. Real estate is excluded because these valuation metrics don’t work well in this sector. I have been updating the Dashboard List every month on Seeking Alpha since December 2015, first in free-access articles, then in Quantitative Risk & Value.
The next table compares IJJ since inception with the Dashboard List model, with a tweak: here, the list is reconstituted once a year to make it comparable with a passive index.
|
since July 2000 |
Total Return |
Annual. Return |
Drawdown |
Sharpe ratio |
Volatility |
|
IJJ |
833.39% |
10.43% |
-58.00% |
0.55 |
18.62% |
|
Dashboard List (annual) |
1280.15% |
12.36% |
-57.52% |
0.68 |
17.26% |
Past performance is not a guarantee of future returns. Data Source: Portfolio123
The Dashboard List outperforms IJJ by about 2 percentage points in annualized return. A note of caution: IJJ price history is real, whereas the model simulation is hypothetical.
Price to Book: a risky concept of value
I like the idea of mixing various ratios to rank value stocks. However, I think most value indexes doing so have two weaknesses, and IJJ no exception. The first one is to classify all stocks on the same criteria. It means the valuation ratios are considered comparable across sectors. Obviously, they are not: you can read my monthly dashboard here for more details about this topic. A consequence is to overweight sectors where valuation ratios are naturally cheaper, especially financials. Some other sectors are disadvantaged: those with large intangible assets like technology. These elements are not correctly reflected by valuation ratios.
The second weakness comes from the price/book ratio (P/B), which adds some risk in the strategy. Historical data show that a large group of companies with low P/B has a higher probability to hold value traps than a same-size group with low price/earnings, price/sales or price/free cash flow. Statistically, such a group will also have a higher volatility and deeper drawdowns in price. The next table shows the return and risk metrics of the cheapest quarter of the S&P 500 (i.e., 125 stocks) measured in price/book, price/earnings, price/sales and price/free cash flow. The sets are reconstituted annually between 1/1/2000 and 1/1/2023 with elements in equal weight.
|
Annual. Return |
Drawdown |
Sharpe ratio |
Volatility |
|
|
Cheapest quarter in P/B |
8.54% |
-81.55% |
0.35 |
37.06% |
|
Cheapest quarter in P/E |
10.71% |
-73.62% |
0.48 |
25.01% |
|
Cheapest quarter in P/S |
12.82% |
-76.16% |
0.47 |
34.83% |
|
Cheapest quarter in P/FCF |
15.32% |
-74.77% |
0.61 |
27.03% |
Data calculated with Portfolio123
This explains why I use P/FCF and not P/B in the Dashboard List model.
Takeaway
IJJ tracks the S&P Mid-Cap 400 Value Index, whose constituents are chosen and weighted based on various value and growth metrics. IJJ has 3 close competitors: MDYV and IVOV have the same underlying index, whereas IWS tracks another mid-cap value index. IJJ and IVOV are equivalents for long-term investors, but MDYV shows some drift, likely due to tracking errors. IJJ is better than IVOV for tactical asset allocation and trading, because it has much higher trading volumes. For example, IJJ may be part of a strategy switching between value and growth, and/or between large and mid-cap, depending on market conditions. IJJ has outperformed its parent index, the S&P Mid-Cap 400, by about 1 percentage point in annualized return since inception, which is quite a thin excess return. IJJ looks the best all-purpose mid-cap value ETF, but the underlying index has two methodological weaknesses in my opinion: ranking stocks regardless of their industries, and relying too much on the price/book ratio.
Be the first to comment