

Spencer Platt/Getty Images News
Did Bank of America Beat Earnings?
Bank of America Corporation (NYSE:BAC) released Q2 2022 results on Monday (July 18). BAC stock finished the day roughly flat (up 0.2%), having already rebounded by 7.0% on Friday.
BAC missed consensus estimates slightly. EPS missed by about 3%, while revenues missed by less than 1%:
|
BAC Q2 2022 Earning Misses 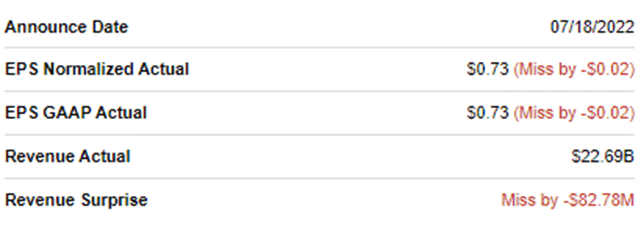 Seeking Alpha. |
Q2 results support our investment case, with Return on Tangible Common Equity (“ROTCE”) at 14.1% after a minimal reserve release. Net Interest Income (“NII”) grew strongly with good loan growth and higher rates. Non-Interest Revenues (“NIR”) were slightly disappointing, with a temporary contraction in Investment Banking Fees, but BAC retained its #3 global market share. Expenses were flattish. BAC raised its dividend in July and expects to continue buybacks despite new, higher regulatory capital requirements.
We reduced our forecasts slightly, but still expect a total return of 87% (20.7% annualized) by 2025 year-end. The Dividend Yield is 2.7%. Buy.
Is Bank of America A Good Long-Term Investment?
We believe Bank of America stock is a good long-term investment. BAC has been a core holding in our portfolio for more than a decade, and we initiated our coverage of BAC on Seeking Alpha with a Buy rating in October 2019. Since then shares have returned 23% (with dividends), despite having lost 27% year-to-date in a market-wide correction:
|
Librarian Capital Rating History on BAC vs. Share Price (Last 1 Year) 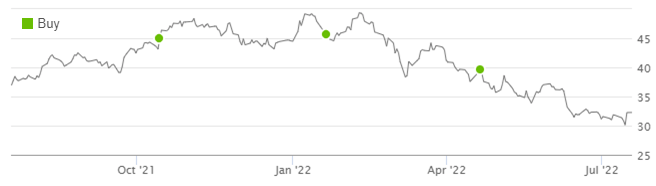 Seeking Alpha (18-Jul-22). |
We believe large U.S. banks can grow their earnings at “GDP +”, thanks to their scale, diversified franchises and leading market positions:
- Large banks achieve NII on favorable Net Interest Yields, thanks to their cheap deposit funding; yields had shrunk in recent years due to Quantitative Easing (“QE”), but are now rising again.
- They have large Non-Interest Revenues such as Investment Banking Fees, which tend to become elevated during periods of QE as cheap money stimulates corporate and market activity, offsetting NII weakness.
- Their cost ratios tend to be stable or improving, as economies of scale and use of technology help them become more efficient.
- They are now far less vulnerable to economic downturns than in the past, thanks to central banks’ willingness to deploy QE and much larger capital buffers after the 2008 crisis.
Compared to its peer JPMorgan Chase (JPM) (where we reviewed their Q2 results last week), BAC is more weighted towards U.S. retail banking, its low-cost deposit franchise means it will benefit more from rising interest rates, and it faces less stringent regulatory capital requirements as it continues to grow in size.
The core of our investment case is that BAC will maintain a mid-teens long-term ROTCE on a growing capital base:
|
BAC Group ROTCE (2013-21) 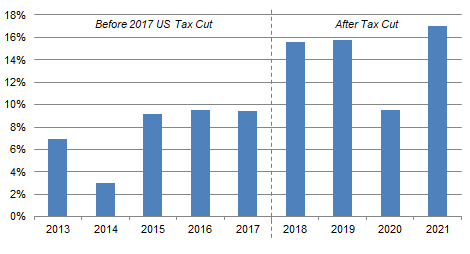 BAC results supplements. NB. Excludes $2.07bn First Data JV impairment in 2019. |
BAC’s Q2 2022 results were in line with this view.
BAC Q2 2022 Results Headlines
BAC achieved a Return on Tangible Common Equity of 14.1% during Q2 2022, slightly below our long-term expectations. (There was a minimal reserve release of $48m for the quarter.)
|
BAC Results Headlines (Reported Basis) (Q1 2022 vs. Prior Periods) 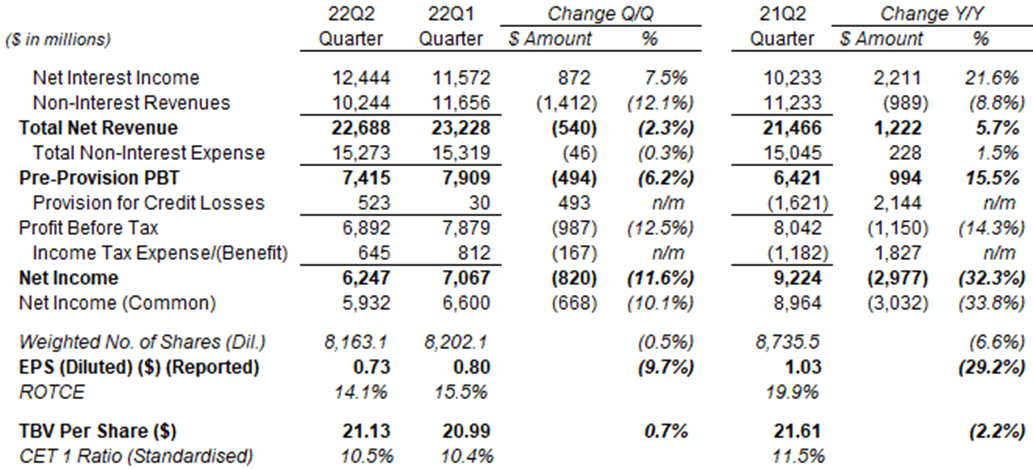 BAC results supplement (Q2 2022). |
Earnings Per Share was $0.73, 9.7% lower sequentially and 29.2% lower year-on-year. However, prior-year EPS benefited from two one-off items, a $2.2bn reserve release and a $2bn tax benefit (from a change in U.K. tax law); excluding these, EPS was in the “low $0.60s” last year and has grown substantially year-on-year.
Pre-Prevision Pre-Tax Profit (“PBT”), which excludes reserve releases/builds and tax items, grew 15.5% year-on-year but was down 6.2% sequentially. It has been trending up since its Q3 2020 trough, but with an uneven trajectory:
|
BAC Earnings, Provisions & Pre-Tax Profit by Quarter (Since Q4 2019) 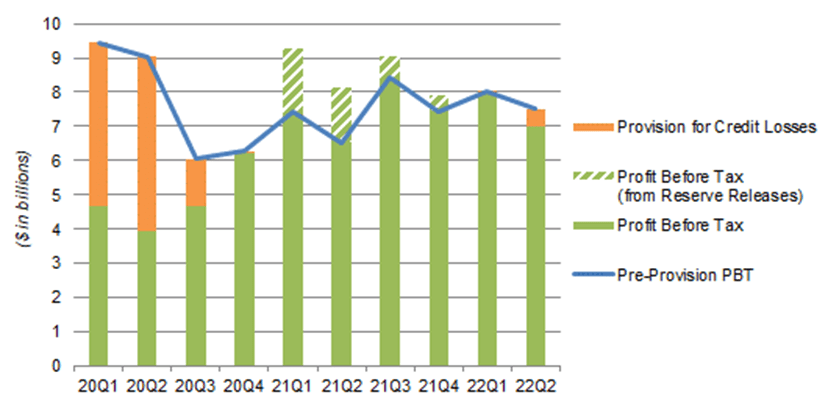 BAC results supplements. NB. Figures on managed basis. |
The upward trend in BAC’s earnings is driven by a combination of NII growing strongly, NIR normalizing down from their record level during the pandemic, flattish expenses and limited credit losses. (These are reviewed in more detail below).
The Common Equity Tier-1 Capital (“CET1”) Ratio was 10.5%, 10 bps higher sequentially. Risk Weighted Assets were flat sequentially, the first time it has not increased significantly quarter-on-quarter since Q3 2020, an outcome achieved through loan sales and replacing higher risk-weighted debt securities with lower risk-weighted ones.
The number of shares fell 6.6% year-on-year, thanks to buybacks, which helped mitigate the decline in Net Income.
Net Interest Income Growth Accelerating
BAC’s NII (on a Fully Tax Equivalent, or “FTE”, basis) grew 21.3% higher year-on-year and 7.4% higher sequentially in Q2 2022, exceeding pre-COVID levels for the first time:
|
BAC Net Interest Income (Since Q4 2019) 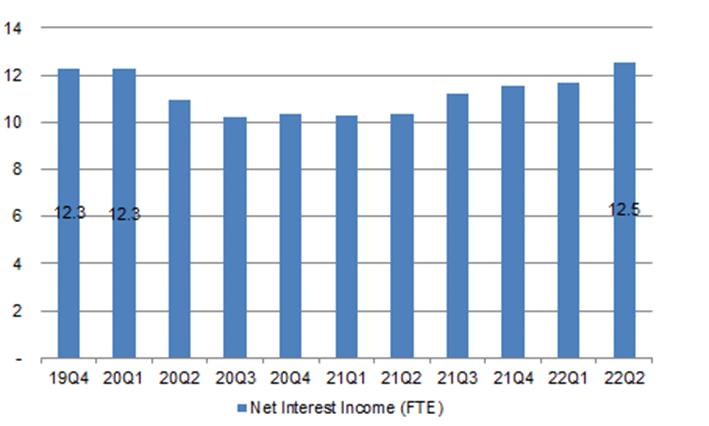 BAC results supplements. |
NII growth was driven by both growth loan and higher Net Interest Yields, each accelerating from Q1.
Total Loans & Leases were up 12% year-on-year (was 8% in Q1 2022), or 14% excluding COVID-related Paycheck Protection Program (“PPP”) loans in the prior year (were 10%), and were also up 3.8% sequentially:
|
BAC Average Total Loans & Leases (Last 5 Quarters) 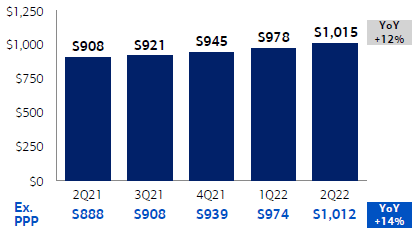 BAC results presentation (Q2 2022). |
Net Interest Yield, excluding Global Markets, was 2.20%, which represented a sequential growth of 21 bps, also accelerating from the 7 bps growth in the prior quarter:
|
BAC Net Interest Yields (FTE Basis) 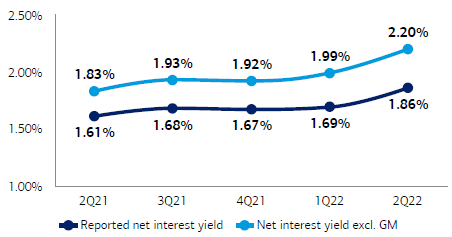 BAC results presentation (Q2 2022). |
Management expects sequential NII growth to accelerate again in Q3 and Q4, with an increase of “at least $900m, possibly $1bn” in Q3 (compared to $870m in Q2), and then “to grow again at a faster pace on a sequential basis” in Q4. We believe these imply a full-year 2022 NII of close to $52bn, compared to $42.9bn in 2021 and $48.9bn in 2019.
Non-Interest Revenues Were Mixed
BAC’s NIR was down 12.1% sequentially and down 8.8% year-on-year, largely due to Investment Banking (“IB”) Fees normalizing down from record levels during the pandemic and valuation losses in “Other Income”:
|
BAC Non-Interest Revenues (FTE Basis) 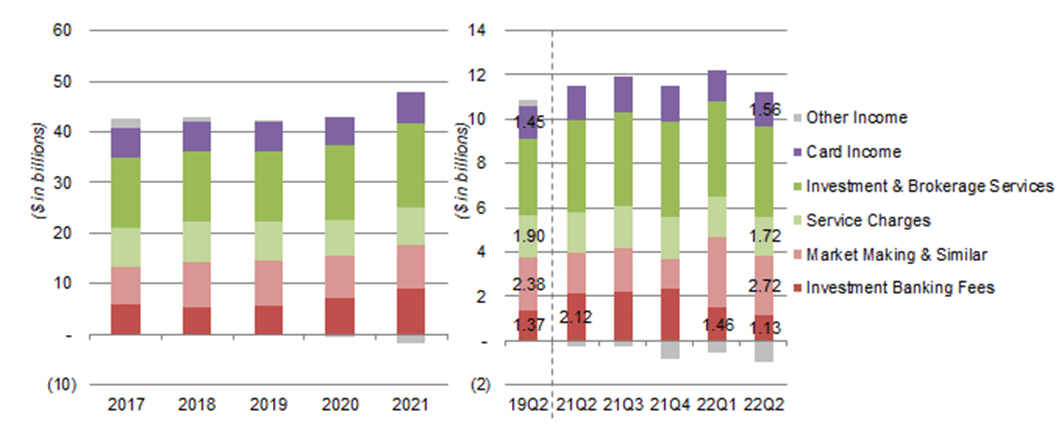 BAC results supplements. |
Investment Banking Fees of $1.13bn in Q2 2022 was a disappointment, being lower than the $1.3-1.5bn range before COVID-19. Management views this to be temporary and the result of the industry fee pool shrinking by 50%; they “believe it can rise back to more normal in the next few quarters when economic uncertainty becomes more muted”. Importantly, BAC has retained its #3 global market share in IB Fees.
Market Making & Similar Activities, primarily Sales & Trading revenues in Global Markets, remained strong in Q2 and helped offset the IB Fees decline. Market volatility benefited areas such as Macro and Equity Derivatives, while Credit and Cash Equities were weaker. BAC has allocated more capital to Global Markets since Q2 2021 (but with no plans to increase it more), so revenues are likely to remain on a permanently higher base compared to pre-COVID 2019.
Service Charges were slightly lower than in 2019, partly due to the reduction in overdraft and “insufficient funds” charges announced in January 2022. These reductions were in full effect by June.
Card Income was only 7.6% higher compared to Q2 2019, despite total Payment Spend on credit and debit cards being higher by approximately 40% year-to-date, as higher volumes were partly offset by higher reward costs.
Other Income was a negative $964m this quarter and included fair value declines in BAC’s available-for-sale debt securities portfolio (due to higher rates), a $300m mark-to-market valuation loss in its Leveraged Finance book, as well as a realized loss from the sale of a $3.3bn legacy portfolio of mortgages.
We continue to believe that BAC’s Non-Interest Revenues can stabilize at levels that are only modestly lower than the exceptional levels in 2020-21, as long-term structural growth offsets the fading of short-term COVID boosts.
Expenses Staying Firmly Under Control
BAC’s non-interest expenses were $15.3bn in Q2 2022, flat sequentially and up only 2% year-on-year. Management expects expenses to remain stable and the “vast majority” of NII growth in coming quarters to benefit earnings:
We are bouncing around $15bn to $15.5bn of quarterly operating costs. And you can look backwards and see that that has been fairly constant. And so you would expect that to continue. And so the vast, vast majority (of the NII increase) falls to the bottom line”
Brian Moynihan, BAC CEO (Q2 2022 earnings call)
CFO Alastair Borthwick similarly reiterated the expectation of core expenses (excluding regulatory matters) to be at “$60bn flattish year-over-year” for 2022.
BAC’s Efficiency Ratio was 67% for Q2 2022, improving from 70% year-on-year. Management has a long-term aspiration to return this to 60% (compared to a pre-COVID trough of 57% in Q3 2019). We expect good expense control and operational leverage to continue to benefit BAC earnings.
Credit Losses Staying Limited
Credit losses remain at historically low levels and are expected to be limited.
BAC’s Provision for Credit Losses of $523m was higher sequentially and year-on-year, but still represented a historically low figure (it averaged $889m per quarter in 2019). The $523m figure consists of $48m of reserve build and $571m of Net Charge-Offs, with the latter including $85m from the sale of $3.3bn of legacy non-core mortgages. Excluding this, Net Charge-Offs were only slightly higher sequentially in Consumer and were slightly lower in Commercial:
Banking Fees normalizing down from record levels during the pandemic and valuation losses in “Other Income”:
|
BAC Net Charge-Offs (Last 5 Quarters) 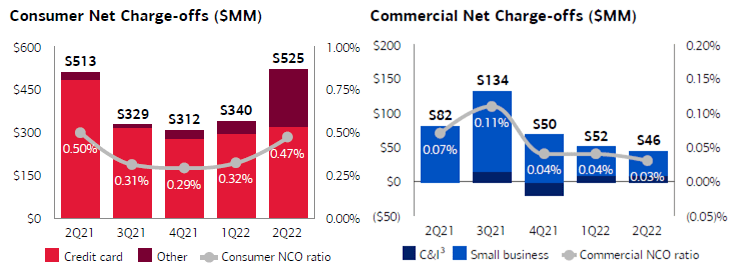 Source: BAC results presentation (Q2 2022). |
BAC credit reserves represented 1.48% of its loan balances in Consumer and 0.22% in Commercial at the end of Q2.
CEO Brian Moynihan stated that BAC continued to see healthy spending and cash balances among consumers:
Consumers continue to spend at a healthy pace even as quite some time has passed since the receipt of any stimulus. Second, the overall average deposit balances for most cohorts are higher than they were both last quarter and even rose in June versus May. They remain at multiples above the pre-pandemic levels. And importantly, we’re seeing no deterioration in our customers’ asset quality, and they have the capability to borrow.
We expect any credit losses at BAC from an economic downturn to be limited, as demonstrated by its record during the pandemic, where BAC remained profitable every quarter and reported a full-year ROTCE of 9.5% in 2020.
Higher Capital Requirements Manageable
Like other banks, BAC faces higher regulatory capital requirements but will continue buybacks.
As a result of the higher Stress Capital Buffer imposed by the Federal Reserve across the sector, BAC will face a higher CET1 Ratio requirement of 10.4% from October, compared to 9.5% before. As a Globally Systemically Important Bank (“GSIB”), BAC’s growing size also means it will face an additional 50 bps requirement starting in 2024, taking its minimum CET1 requirement to 10.9% by the start of 2024.
BAC’s CET1 ratio was already 10.5% at the end of Q2 2022, exceeding the level needed in October. Management target a 50bps buffer above the minimum, but expect to be able to build the capital needed while continuing dividends and buybacks. BAC has already raised its dividend by 5% after the Fed’s stress tests in July and confirmed on the call that buybacks will continue while it builds capital for the new GSIB requirement in 2024.
BAC Stock Key Metrics
At $32.26, BAC stock is trading at 1.5x Price/Tangible Book Value (“P/TBV”).
Relative to an assumed long-term ROTCE of 15%, this implies a P/E of 10.2x. Relative to pre-COVID 2019 earnings (adjusted for buybacks and excluding the First Data JV impairment), when ROTCE was 16%, the P/E is even lower at 9.0x. (2020 and 2021 earnings are distorted by one-off COVID-related reserve builds and releases, respectively.)
BAC stock pays a dividend of $0.22 per quarter, or $0.88 annualized, representing a Dividend Yield of 2.7%. Management targets a Payout Ratio of around 30%, and the dividend was raised by 5% (from $0.21) in July.
What To Expect After Earnings
We lower our long-term ROTCE forecast by 1 ppt from 16.0% to 15.0%, reflecting BAC’s higher capital requirements and a higher degree of economic uncertainty, and also reduce our P/E by 0.5x. Our assumptions now include:
- 2022 dividend of $0.86 (was $1.07)
- ROTCE to be 15.0% for all years (was 16.0%)
- From 2023, Net Income to be 15% retained for growth, 30% paid out as dividends and 55% on buybacks (unchanged)
- Buybacks to be carried out at a P/TBV of 1.7x (was 2.0x)
- 2025 year-end P/E of 13.5x (was 14.0x)
Our new 2025 EPS forecast of $4.17 is 5% lower than before ($4.37):
|
Illustrative BAC Return Forecasts 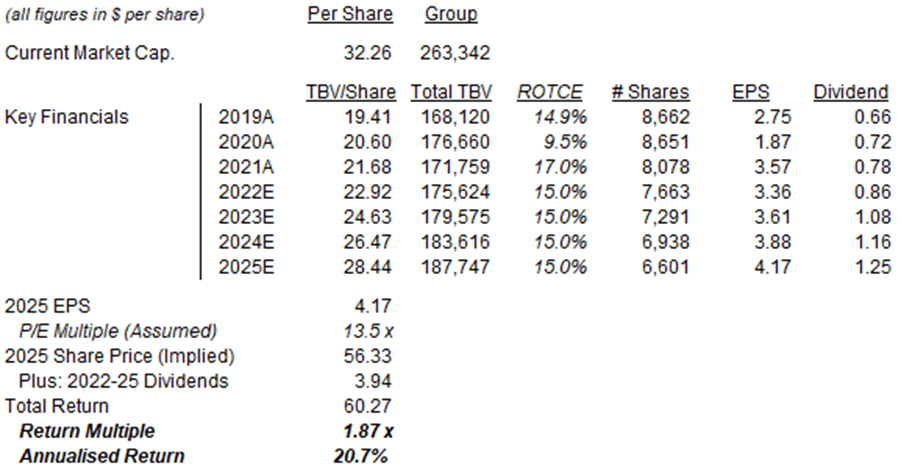 Librarian Capital estimates. |
With shares at $32.26, we expect an exit price of $56 and a total return of 87% (20.7% annualized) by the end of 2025. Most of the upside is expected to come from the upward re-rating in BAC’s P/E multiple, but the Dividend Yield (currently 2.7% and growing) and the forecasted 4% EPS CAGR during 2021-25 on their own should give a high-single-digit annualized return.
Is BAC Stock A Buy, Sell, Or Hold?
We reiterate our Buy rating on Bank of America Corporation stock.
Be the first to comment