


george tsartsianidis/iStock via Getty Images
Investment Thesis
The Invesco Dynamic Food & Beverage ETF (NYSEARCA:PBJ) is a little-known Consumer Staples ETF that’s finally beginning to shine. A relatively poor performance history and a high 0.63% expense ratio might dissuade you, but market conditions change, and PBJ has the best fundamentals of any ETF in its category, including the:
- Consumer Staples Select Sector SPDR ETF (XLP)
- Vanguard Consumer Staples ETF (VDC)
- Fidelity MSCI Consumer Staples Index ETF (FSTA)
- iShares U.S. Consumer Goods ETF (IYK)
- Invesco S&P 500 Equal Weight Consumer Staples ETF (RHS)
- First Trust Consumer Staples AlphaDEX ETF (FXG)
- Invesco DWA Consumer Staples Momentum ETF (PSL)
- Invesco S&P SmallCap Consumer Staples ETF (PSCC)
- John Hancock Multifactor Consumer Staples ETF (JHMS)
- iShares Evolved U.S. Consumer Staples ETF (IECS)
- First Trust Nasdaq Food & Beverage ETF (FTXG)
I’ve considered all these competitors, and in this article, I’ll explain how PBJ is set up to perform best in today’s risk-off environment. With that said, let’s take a look at the strategy.
PBJ ETF Overview
Strategy & Fund Basics
PBJ tracks the Dynamic Food & Beverage Intellidex Index. Intellidex Indexes are selected based on over 150 factors grouped into five categories:
- Price Momentum
- Earnings Momentum
- Quality
- Management Action
- Value
Specific factors include a stock’s price relative to its 52-week high price, analyst estimate changes, return on assets and equity, dividends and buybacks, and the sales to enterprise value ratio. PBJ tracks the Consumer Staples cut, but I want to emphasize the “Dynamic” part of the Index. PBJ’s portfolio turnover rates from 2017 to 2021 were 145%, 147%, 122%, 136%, and 116%, respectively. This turnover is huge and nothing like what you’d get with simple cap-weighted exposure like with cap-weighted ETFs like XLP or VDC. In my view, this is often a negative feature, but could be a positive one depending on the portfolio at any given time. Before we get into that, here are some key statistics you can use for easy reference:
- Current Price: $46.47
- Assets Under Management: $184 million
- Shares Outstanding: 3.92 million
- Expense Ratio: 0.63%
- Launch Date: June 23, 2005
- Trailing Dividend Yield: 0.82%
- Five-Year Dividend CAGR: -4.91%
- Ten-Year Dividend CAGR: 7.70%
- Five-Year Beta: 0.68
- Number of Securities: 30
- Assets in Top Ten: 45.96%
- 30-Day Median Bid-Ask Spread: 0.09%
- Bid/Ask Premium/Discount: 0.04%
PBJ has seen its AUM grow from $130 million to $184 million since my January article, and I think it’s due to its lower valuation compared to its peers (discussed later). The expense ratio of 0.63% remains a problem, so I don’t see it as a good long-term play. To illustrate, if held for ten years, assuming a 10% annual return continuously compounded, an investor would lose 9.08% of their total gains to fees compared to 1.47% with VDC or XLP. On a $10,000 investment, the ending balance would be $1,213 less ($24,490 vs. $25,703), so I think that’s too much of a gap to fill. Instead, it’s best to view PBJ as an efficient, short-term tool to gain exposure to Consumer Staples stocks.
Industry Exposures and Top Holdings
PBJ’s industry exposures are as follows:
- Packaged Foods & Meats (43.89%)
- Soft Drinks (16.42%)
- Food Retail (15.22%)
- Agricultural Products (8.51%)
- Food Distributors (6.07%)
- Distillers & Vintners (5.07%)
- Restaurants (2.92%)
- Personal Products (1.91%)
The Packaged Foods & Meats industry continues to be the most significant exposure area, similar to when I last reviewed the ETF. However, exposure to soft drink stocks like Coca-Cola (KO) and PepsiCo (PEP) dropped by about 5% to 16.42%. Food Retail slightly picked up from 12.87% to 15.22%, and PBJ now holds Arcos Dorados Holdings (ARCO), a McDonald’s franchise operator in Latin America and the Caribbean. According to Global Industry Classification Standards, ARCO is a Consumer Discretionary stock, so it’s a bit of a departure in that regard.
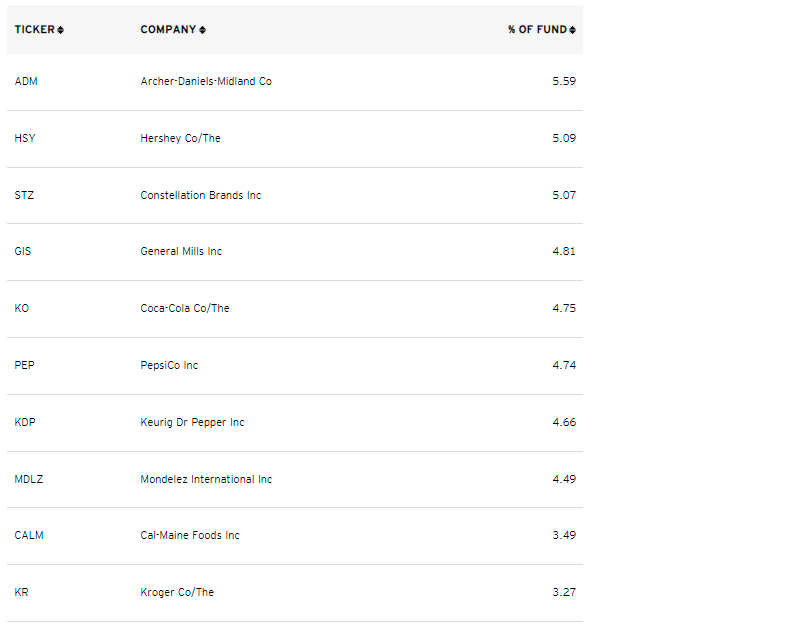
I’ve listed the fund’s top ten holdings below, totaling 45.96%. I’ll be covering the fundamentals for the top 20 holdings soon, which total 75.53%, and they include names like Archer-Daniels-Midland (ADM), Hershey (HSY), and Constellation Brands (STZ).
Invesco
- Procter & Gamble (PG)
- Costco Wholesale (COST)
- Philip Morris (PM)
- Walmart (WMT)
- Altria Group (MO)
- Colgate-Palmolive (CL)
- Estee Lauder (EL)
- Kimberly-Clark (KMB)
- Sysco (SYY)
- Walgreens Boot Alliance (WBA)
- Monster Beverage (MNST)
- Kraft Heinz (KHC)
Performance History
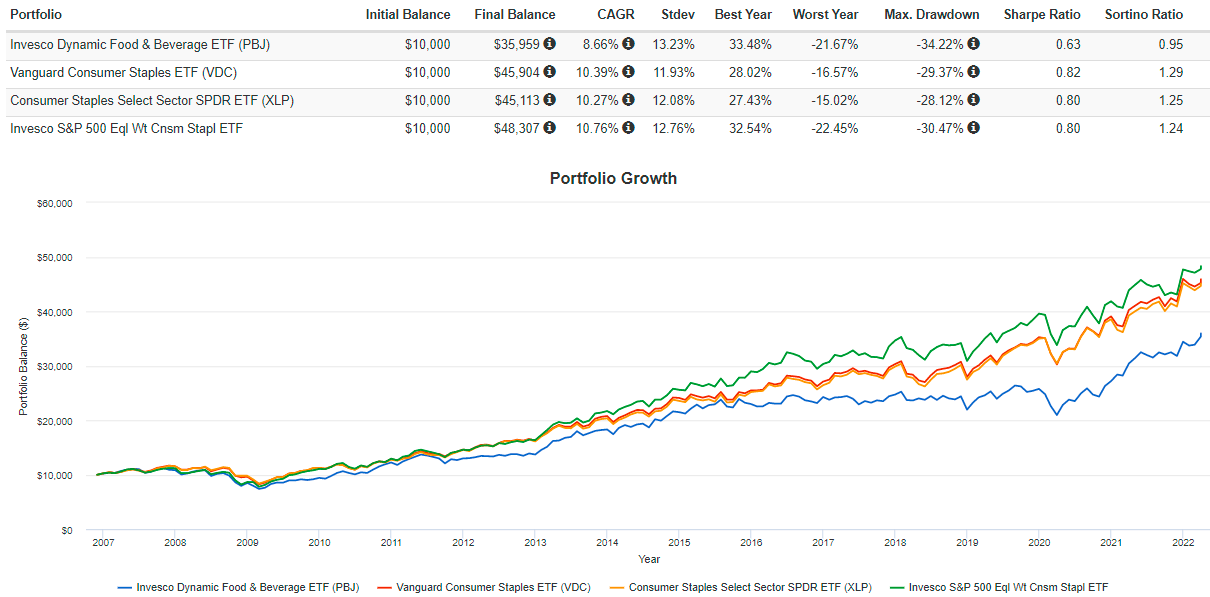
These exclusions haven’t been wise choices in the past, if PBJ’s past performance is any indication. Since its inception, PBJ has trailed VDC, XLP, and RHS by about 1.50% to 2.00% per year, with slightly higher volatility.
Portfolio Visualizer
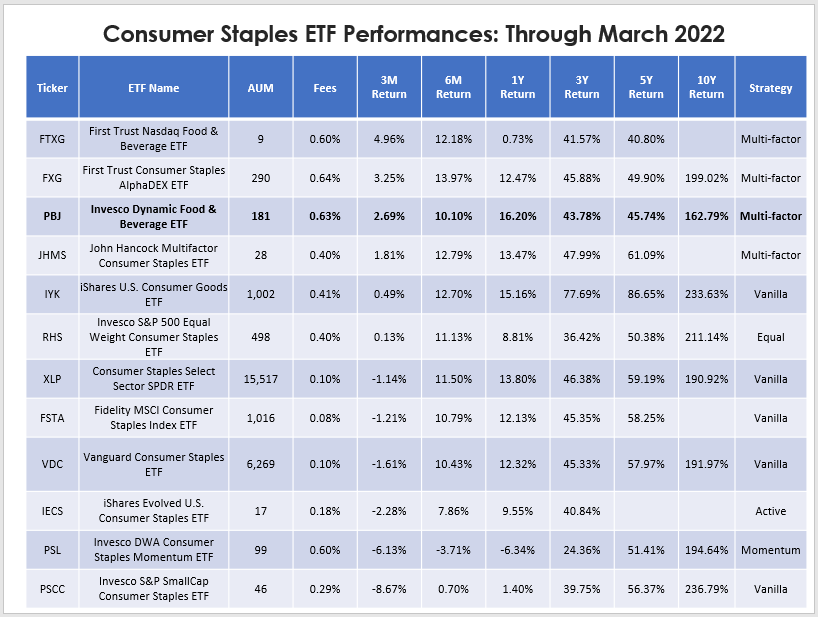
A solid portion of this underperformance is the additional fees, as described above. However, the underlying Index also underperformed, so it’s doubtful that long-term investors will succeed with PBJ. I view this purely as a short-term play because it’s done quite well since January 2021, outperforming XLP and VDC by an annualized 11%. In my view, one key reason is a return to investors placing heavier importance on fundamentals. Factor-based ETFs like PBJ, FTXG, FXG, and JHMS have succeeded in the last three months, while plain vanilla ETFs like XLP, VDC, and FSTA, declined.
Author
PBJ Fundamental Analysis
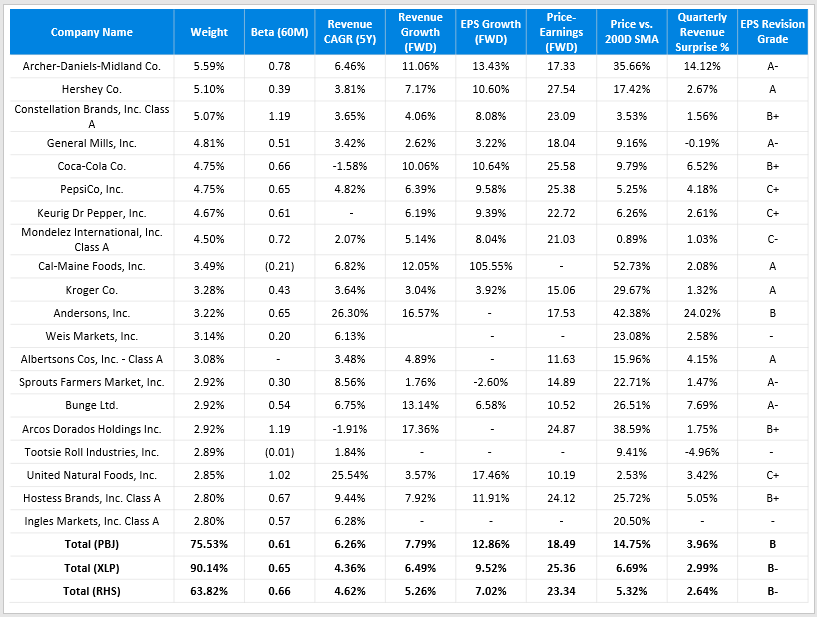
For my fundamental analysis, I’ll be comparing PBJ with XLP and RHS to see how it compares with the large-cap S&P 500 stocks. The table below highlights selected metrics for PBJ’s top 20 holdings.
Author
PBJ scores better in the volatility, growth, valuation, and momentum categories. Particularly:
1. A lower five-year beta of 0.61, including a position in Cal-Maine Foods (CALM), which has a -0.21 beta. CALM is up 53% in the last year as egg prices soared, representing a way to benefit from rapid food price inflation.
2. A higher revenue growth rate, both historically and on a forward basis. The Consumer Staples sector isn’t known for its growth, and that’s a weakness. Traditionally, the sector performs well in market downturns, but PBJ avoids low-growth mega-cap stocks like Procter & Gamble. While that probably isn’t a smart long-term strategy, I believe it represents an excellent short-term opportunity. The largest stock by market capitalization has dragged the sector down this year, underperforming by 5%.
3. The same is true for EPS growth, but PBJ gives higher weighting to double-digit growers like Archer-Daniels-Midland and Hershey. Analysts expect 12.86% growth over the next twelve months for PBJ’s constituents, compared to 9.52% and 7.02% for XLP and RHS.
4. On a forward basis, PBJ trades at 18.49x earnings compared with 25.36x and 23.34x for XLP and RHS. This is a substantial discount investors shouldn’t overlook. To illustrate, I scanned over 800 U.S. Equity ETFs in my database with double-digit EPS growth, a five-year beta under 0.75, and a forward P/E under 20x, and only two ETFs qualified: PBJ and FXG. Recall from the performance table earlier how FXG was also a top-performing multi-factor Consumer Staples ETF in the last three months. Combined with my analysis of ETFs in other sectors, I can confidently say it’s clear these are the factors the market currently favors.
5. PBJ’s constituents have better revenue surprise figures from last quarter and a stronger Seeking Alpha EPS Revision Grade (B vs. B-). It gives the ETF added momentum heading into the Q1 earnings season. While analyst projections may turn out wrong, I still pay attention to them because they influence markets. A solid earnings report can propel a company’s share price forward for an entire quarter.
Investment Recommendation For PBJ ETF
Historically, PBJ has been a poor ETF to own, and long-term investors probably are better off with plain-vanilla ETFs like XLP, VDC, or FSTA. The reason is that mega-cap stocks like Procter & Gamble and Costco have tremendous pricing power, are incredibly profitable, and deserve their higher valuations. I hope value investors have learned some lessons over the last decade and realized that investing isn’t as simple as choosing the cheapest stock.
Poor historical performance aside, PBJ is priced very well at 18.49x forward earnings. That’s a seven-point discount vs. XLP, and you’re not giving up any revenue or earnings per share growth to get it. Constituents performed better last quarter, analysts are upgrading their estimates for the next quarter faster, and it’s even less volatile. Therefore, I’m maintaining my January buy rating for PBJ and hope you’ll consider adding it to your watchlist. Thank you for reading, and I’m happy to answer any questions in the comments section.
Be the first to comment