

ZargonDesign/E+ via Getty Images
In the following piece, we try to counter the wide-spread obsession with rate inversions as a signal of imminent recession.
As our subscribers know, monetary policy (rate adjustment) is secondary to fiscal policy; as long as the government is net-transferring money to private bank accounts, and/or bank credit is growing, the stock market and the economy will be supported. In other words, as long as money is flowing into the economy, recessions and bear markets won’t happen. That is why, although the investment Twitterverse is alive and writhing with monetarist rants about “inversions”, we point out that ‘inversions’ are not a sign from the gods that the world is ending.
The chart below shows various rate differentials, the Fed funds rate, and the SPX over the last 40-years. The 10y-2y differential has the fewest number of false signals; the other differentials invert often and, therefore, cannot be relied on as recession signals. Even the 10y-2y inversion has to be taken with a grain of proverbial salt since recessions can take 6-18 months to develop following an inversion.
Multiple differentials (stockcharts.com and ANG Traders)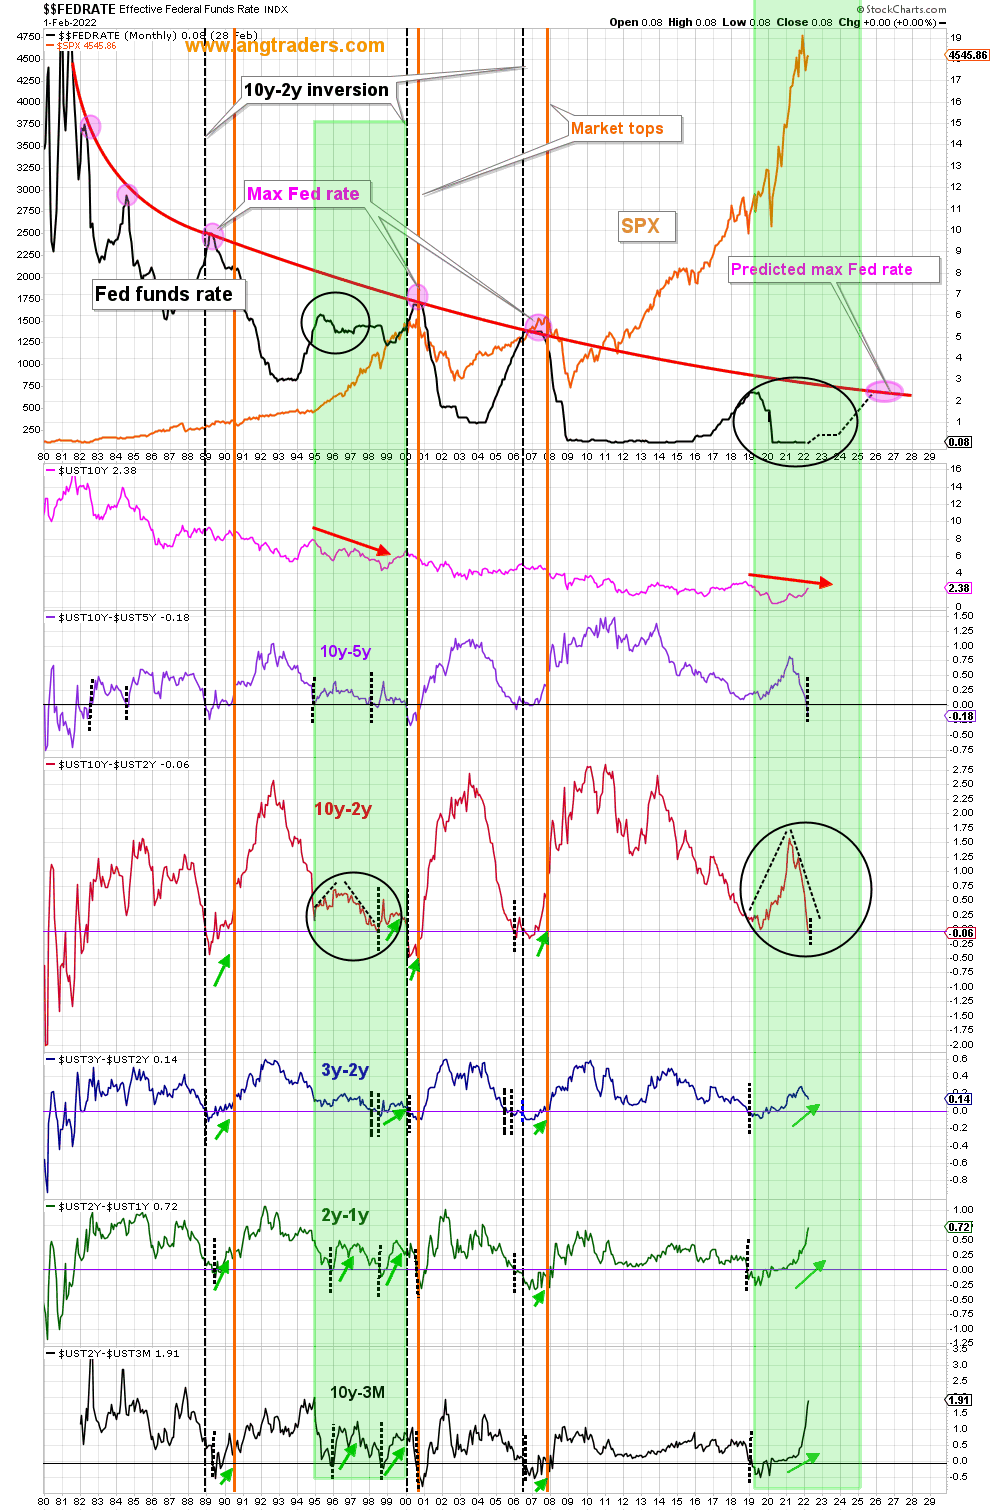
Although no two markets are exactly alike, there is a strong similarity between the mid-1990s and today (green highlights). The two following charts show a closer look at those two periods. Notice that in the mid-90s, the 10y-2y inverted in the Spring of 1998 and then again at the start of 2000, but the bear market (orange vertical line) did not start until 8-months later. The other differentials inverted several times, giving false signals.
Differentials 1990s (stockcharts.com and ANG Traders)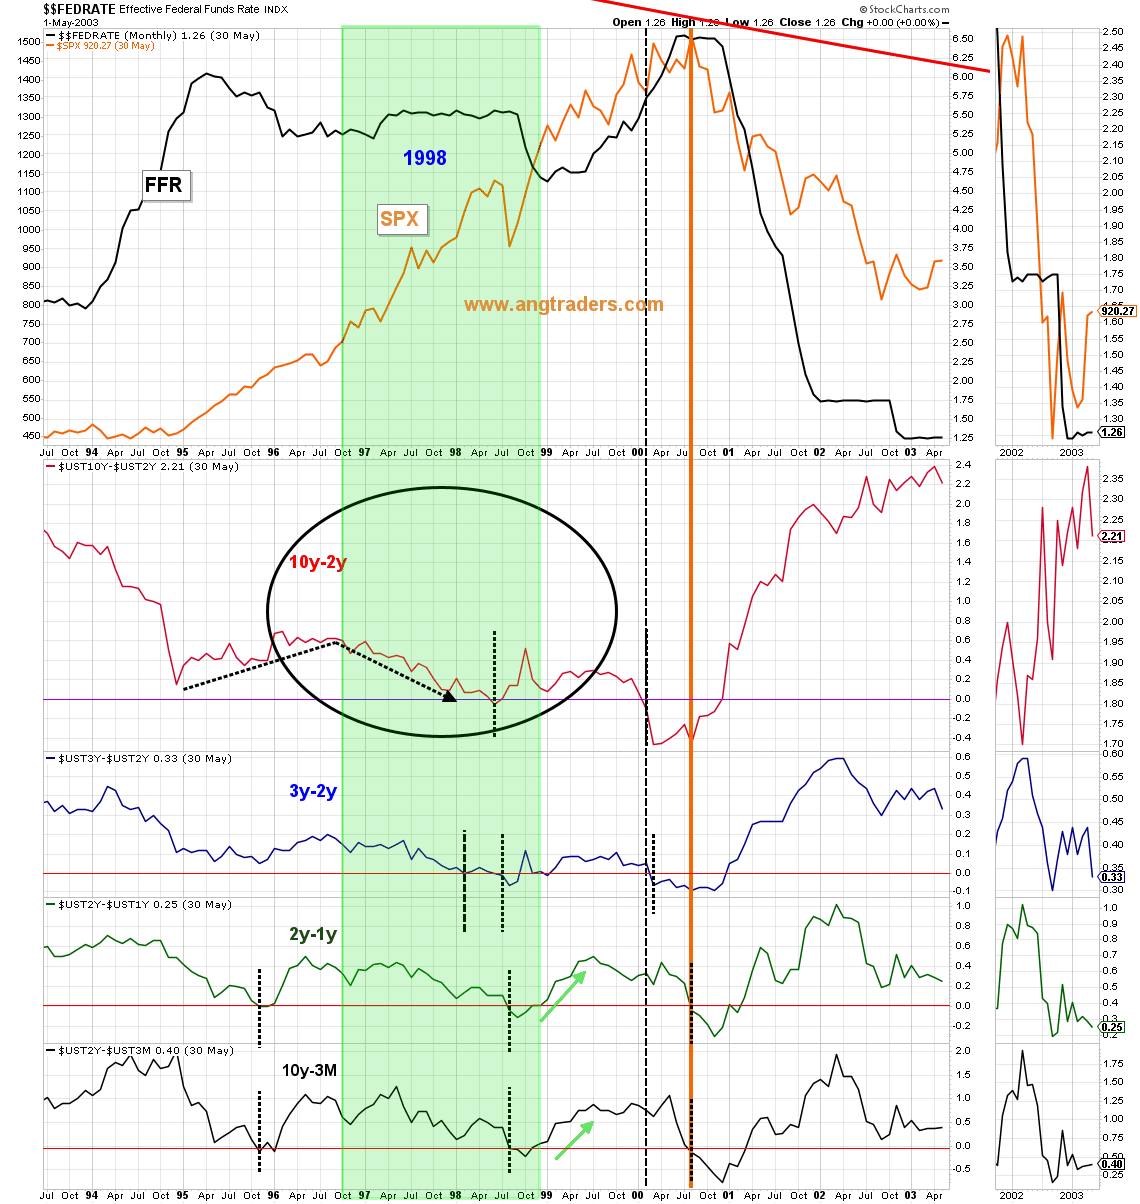
At present, the 10y-2y has just inverted for the first time (it came close in 2019, but did not invert). Statistically, a recession is unlikely to occur earlier than 6-months from now.
Differentials- recent (stockcharts.com and ANG Traders)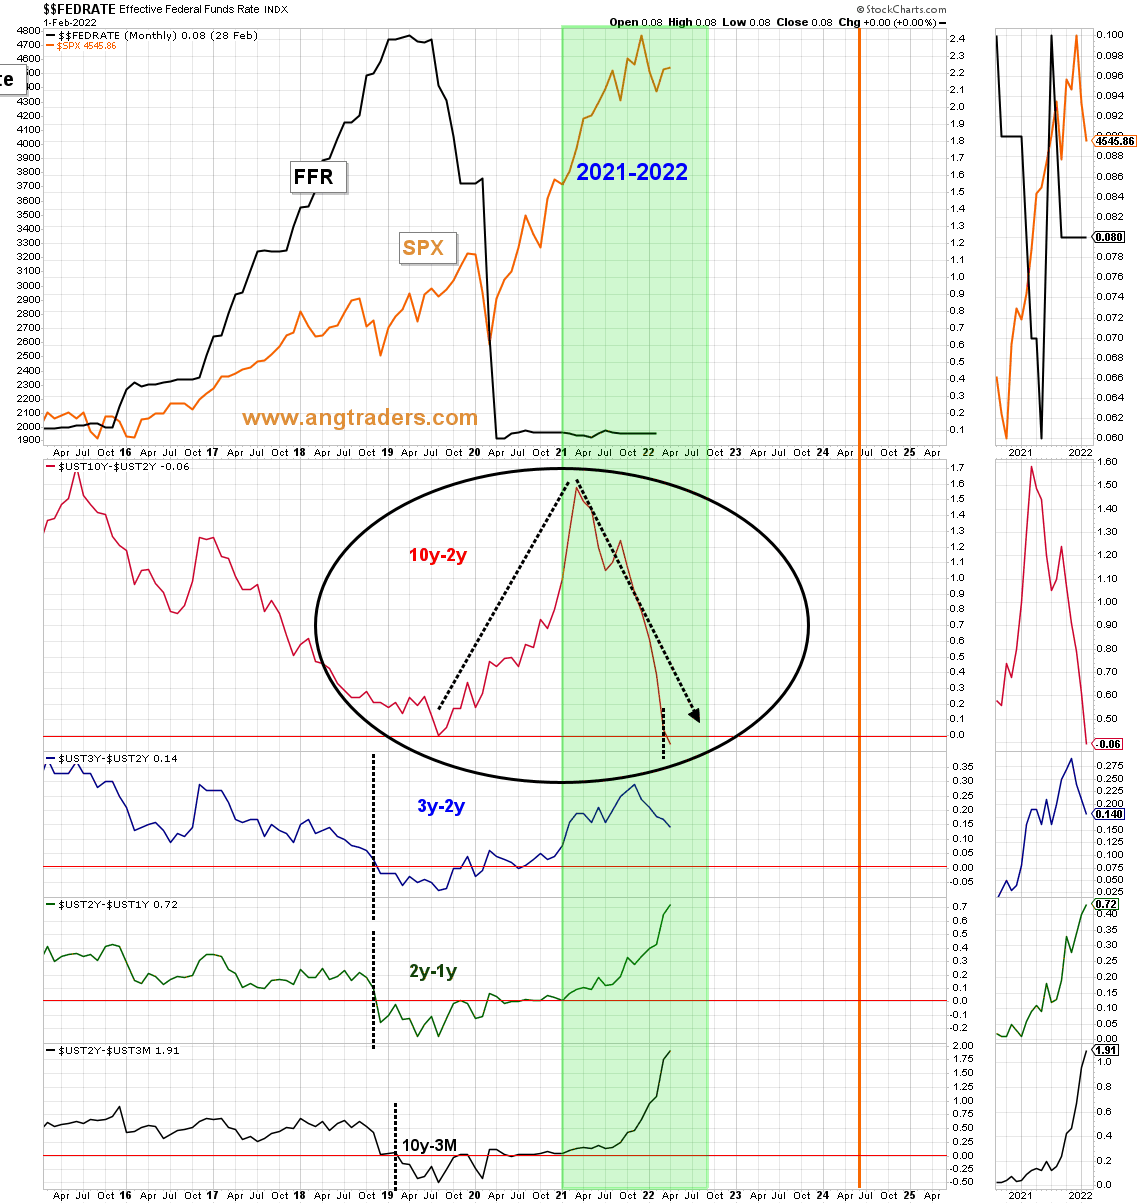
…and when we add unemployment to the picture, we see that, historically, unemployment starts rising before a bear market develops (green arrows below); unemployment continues to move lower which means a recession is not near (chart below).
Differential and unemployment (stockcharts.com and ANG Traders)
It is too early to be fretting about recession, especially when we consider the fund flows that are being injected into the economy.
The net-transfer, from the Treasury to the private-sector, for the month of March was +$197B, and for Q1 (calendar) the net-transfer was +$421B, which is very good, but 55% less than the +$944B that was transferred during Q1 2021. As a result, we can’t expect the same kind of growth as last year at this time-new highs in the stock market will not be as frequent as last year-but a recession is not something we should be worried about, regardless of any rate-inversions.
Take advantage of our 14-day free trial and stay on the right side of the market and Away From the Herd.

“ I am SO VERY thankful for the discovery of this site, and the wisdom and knowledge I have gained ...”
” I have not seen this type of analysis anywhere else. “
“It is probably the only report of its type on the planet when you think about it.”
Take advantage of our 14-day free trial and stay on the right side of the market and Away From the Herd.
Be the first to comment