

Hiraman
Interactive Brokers Group, Inc. (NASDAQ:IBKR) is an independent brokerage platform. The company has a lower number of customers (1.68 mln) and revenue growth as compared to its competitors. As previously analyzed, one of the reasons is attributable to the company’s business model catering more to institutional investors instead of retail investors. We examined the company further to determine the financial advantages that its unique business model brings.
Highest Revenue Per Client with Large Share of Institutional Customers
|
Number of Customers (‘mln’) |
2021 |
|
Fidelity |
33.20 |
|
Charles Schwab (SCHW) |
14.10 |
|
Robinhood (HOOD) |
13.00 |
|
TD Ameritrade |
12.00 |
|
E-Trade |
6.00 |
|
IBKR |
1.68 |
Source: Statista, Company Data, Khaveen Investments
In the table above, we compared the number of customers that IBKR and its peers have. In 2021, Fidelity had the largest number of customers (33.20 mln) followed by Charles Schwab with 14.10 mln accounts. Whereas IBKR had the smallest number of customers at only 1.68 mln. We believe that this is due to IBKR having a high % of institutional accounts as supported by the following statement from the company’s annual report below.
62% of our customers’ equity is in institutional accounts such as hedge funds, financial advisors, proprietary trading desks and introducing brokers – IBKR Annual Report
|
Revenue/Client ($) |
2021 |
|
Fidelity |
506.25 |
|
Charles Schwab |
566.79 |
|
Robinhood |
100.84 |
|
TD Ameritrade* |
759.98 |
|
E-Trade* |
1,134.70 |
|
IBKR |
1,615.48 |
Source: Company Data, Khaveen Investments
Although IBKR had the lowest number of accounts, it had the highest revenue per client of $1,615.48. Moreover, E-Trade, with the second lowest number of accounts, (6 mln) had the second highest revenue per client of $1,134.70. In contrast, Fidelity, which had the highest number of accounts had the lowest revenue per client. We believe that this could be due to IBKR’s high % of institutional accounts which generated higher commissions based on a larger trading volume.
Lower Revenue Growth due to Low Margin Loan Rate and Declining Commissions Rate
Seeking Alpha, Khaveen Investments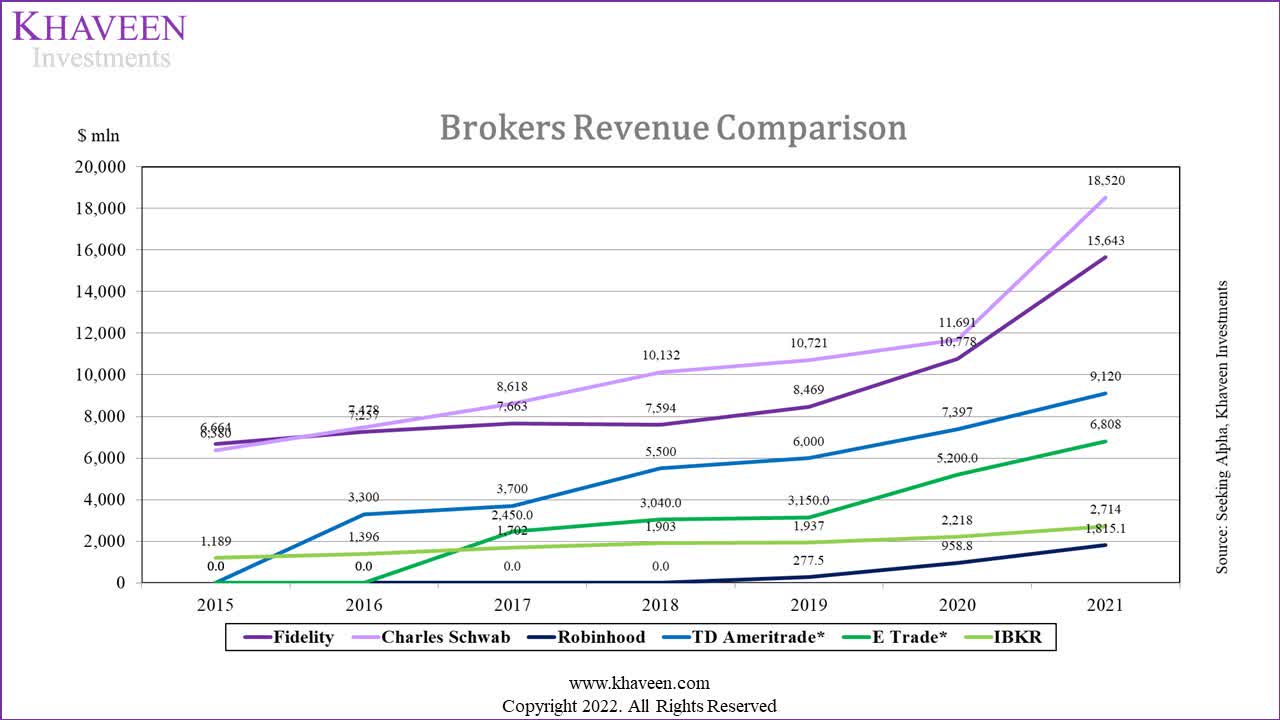
Based on the chart above, in 2021, Charles Schwab had the largest revenue at $18,520 while Robinhood had the smallest revenue ($1,815.1 mln). Charles Schwab’s revenue remains the largest since 2016. Additionally, in 2021, Charles Schwab’s had the highest revenue growth at 58.41%. Also, in 2021, there was a surge in growth (45.14%) in Fidelity’s revenue which we believe was driven by the high growth (35.81%) of its premiums and annuity segment revenues. Excluding Robinhood, E-Trade had the highest 3-year average growth at 33.21% whereas IBKR had the lowest 3-year average growth of 12.89%.
|
5-year Average Growth % |
IBKR |
Charles Schwab |
Fidelity |
|
Net Interest Income |
18.87% |
20.39% |
79.79% |
|
Capital Markets Revenue |
13.51% |
19.58% |
– |
Source: Seeking Alpha, Khaveen Investments
Moreover, we compared IBKR segment revenues with Charles Schwab and Fidelity. IBKR’s past 5-year revenue CAGR for Capital Markets (13.51%) is lower compared to Charles Schwab (19.58%). Besides that, in terms of net interest income, IBKR had the lowest 5-year average growth (18.87%) whereas Fidelity had the highest 5-year average growth (79.79%). We believe the company’s low Capital Markets revenue growth was due to the decline in the commission rates charged to its cleared customers as seen in the following table below.
|
Cleared Customers |
2019 |
2020 |
2021 |
|
Commission per Cleared Commissionable Order ($) |
3.63 |
2.46 |
2.37 |
|
Growth % |
-32.23% |
-3.66% |
|
|
Clear Avg. DART per Account ($) |
266 |
459 |
339 |
|
Growth % |
72.56% |
-26.14% |
Source: IBKR, Khaveen Investments
As shown above, the commission per cleared commissionable order had been continuously declining which we believe may be due to a decrease in commission rates or the decrease in clients’ order volume which further caused the revenue per client to decline (-21.83% in 2021).
|
US Margin Loan Rates Comparison |
$25k |
$300k |
$1.5 mln |
$3.5 mln |
|
Fidelity |
8.57% |
7.32% |
4.75% |
4.75% |
|
Charles Schwab |
8.57% |
7.23% |
– |
– |
|
Robinhood |
4.25% |
4.25% |
4.25% |
4.25% |
|
TD Ameritrade |
9.75% |
8.25% |
– |
– |
|
E-Trade |
9.20% |
7.70% |
– |
– |
|
IBKR |
2.33% |
1.99% |
1.78% |
1.66% |
Source: IBKR, Khaveen Investments
Furthermore, we believe that IBKR’s net interest income revenue growth is low (5-year average growth of 18.87%) due to its low margin loan rates as compared to its competitors. We believe that this is because most of its clients are institutional clients. These clients have a lower risk of defaults which is why the low loan rates are charged. In contrast, we believe that retail clients have a higher chance of defaulting hence they are charged a premium.
Revenue Growth Supported by Net Interest Income Growth
IBKR, Khaveen Investments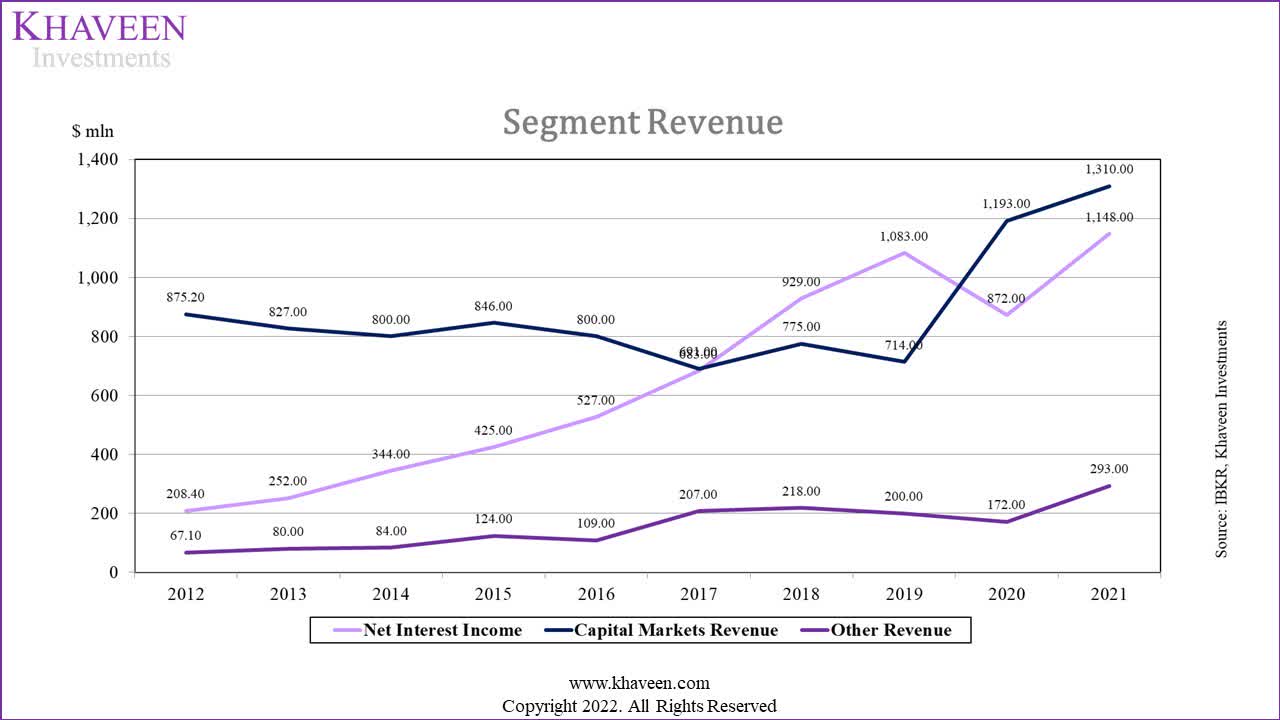
Since 2012, the company’s Capital Markets segment had always been the largest segment of IBKR except from 2017 to 2019. However, its Other revenue had the highest growth with a past 9-year average of 22.56%. The company’s net interest income was in an upwards trend but decreased in 2020 which we believe is due to the decrease in the interest rates by the US Federal Reserve which negatively impacts its net interest income. This is because the yields on interest-earnings assets are projected to increase slower than the cost of funding sources. As for the capital market segments, its revenue was in a decreasing trend until 2019 but reversed and increased from 2020 onwards.
|
Revenue ($ mln) |
2022F |
2023F |
2024F |
2025F |
2026F |
|
Net Interest Income |
1,402.27 |
1,712.86 |
2,092.24 |
2,555.64 |
3,121.69 |
|
Growth % |
22.15% |
22.15% |
22.15% |
22.15% |
22.15% |
|
Capital Markets Revenue |
1,486.99 |
1,687.90 |
1,915.95 |
2,174.81 |
2,468.64 |
|
Growth % |
13.51% |
13.51% |
13.51% |
13.51% |
13.51% |
|
Other Revenue |
359.11 |
440.13 |
539.44 |
661.14 |
810.31 |
|
Growth % |
22.56% |
22.56% |
22.56% |
22.56% |
22.56% |
|
Total |
3,248.37 |
3,840.89 |
4,547.62 |
5,391.60 |
6,400.65 |
|
Growth % |
18.08% |
18.24% |
18.40% |
18.56% |
18.72% |
Source: IBKR, Khaveen Investments
We projected the company’s forward 5-year revenue based on its historical growth for each segment. For the Capital Market segment, due to the change in its growth trend, we projected its revenue growth based on its 5-year average segment revenue growth (13.51%). As for the net interest income, we projected it based on the company’s historical 9-year average growth but excluded 2020 as we believe it is a one-off event (22.15%). Lastly, we projected the revenue of its other revenue segment based on its historical 9-year average segment growth of 22.56%. Overall, we arrived at a total projected revenue of $3,248 mln in 2022 and a 5-year forward average of 18.4%.
Risk: Declining Revenue per Client
|
Revenue/ Client ($) |
2015 |
2016 |
2017 |
2018 |
2019 |
2020 |
2021 |
|
IBKR |
3,591 |
3,625 |
3,525 |
3,181 |
2,808 |
2,067 |
1,615 |
|
Growth % |
0.95% |
-2.77% |
-9.74% |
-11.74% |
-26.39% |
-21.83% |
Source: IBKR, Khaveen Investments
As seen above, IBKR’s revenue per client was in a decreasing trend with a past 6-year average growth of -11.92% which we believe was due to the decrease in commissions and a lower loan rate as compared to its competitors. We believe the reason behind this may be due to IBKR wanting to provide higher value to its institutional clients and to present itself as the best broker for institutional clients which affected its revenues as evidenced by its lower growth. We believe this would pose a risk to the company as it would decrease the company’s revenue growth.
Verdict
To conclude, we believe that IBKR’s lower revenue growth was affected by its lower loan margin and commission rates which resulted in lower revenue per client. We then projected IBKR revenue based on each segment at a 5-year forward of 18.4%.
Based on Corporate Finance Institute, minority interest is defined as “the portion of the subsidiary owned by minority interests”. Although IBKR’s minority interest % of net income and as % of equity was in a decreasing trend, it remained elevated in 2021. Hence, we used the P/E and P/B to value IBKR as minority interest can be excluded in the calculation of these two metrics. In contrast, P/S and P/CF are not used as minority interest is included in the metrics.
|
Minority interest |
2012 |
2013 |
2014 |
2015 |
2016 |
2017 |
2018 |
2019 |
2020 |
2021 |
|
% Minority interest/ net income |
92% |
91% |
90% |
88% |
88% |
90% |
85% |
85% |
83% |
81% |
|
% Minority interest/ equity |
88% |
86% |
85% |
84% |
83% |
83% |
82% |
82% |
78% |
77% |
Source: Seeking Alpha, Khaveen Investments
We evaluated the company based on adjusted P/E and P/B to account for the minority interest. The adjusted P/B (10.67x) and adjusted P/E (83.00x) ratios are higher as compared to the P/B (2.39x) and P/E (23.75x) ratios which include minority interest. We then obtained IBKR equity value based on the average P/E and P/B of IBKR and its competitors.
|
Company |
P/B |
P/E |
|
Fidelity |
1.28x |
4.89x |
|
Charles Schwab |
3.10x |
20.72x |
|
Robinhood |
1.05x |
83.00x* |
|
Interactive Brokers |
10.67x |
83.00x |
|
IG Group Holdings |
1.75x |
7.21x |
|
Average |
3.57x |
39.77x |
Source: Seeking Alpha, Khaveen Investments
*For Robinhood, we assume its P/E based on the highest P/E (83.00x) as Robinhood has negative earnings.
|
Valuation |
Company |
Industry |
Price ($) |
Equity Value ($) |
Upside |
|
P/B |
10.67x |
3.57x |
60.95 |
20.4 |
-66.5% |
|
P/E |
83.00x |
39.77x |
60.95 |
29.2 |
-52.1% |
|
Total Valuation |
60.95 |
24.8 |
-59.3% |
Source: Seeking Alpha, Khaveen Investments
With that, we achieved the price target with an average downside of -59.3%. This is in stark contrast to the analyst consensus price target of $92 which represents an upside of 50.9%. We believe the difference lies in the fact that the consensus has failed to account for the minority interest of IBKR. Hence, we believe a middle ground price target of our derived price target and the analyst consensus of $58.40 is an appropriate and conservative estimate. Overall, with a 4.2% downside based on our price target, we rate IBKR as a Hold.
Be the first to comment