

Lorado
Investment Thesis
Intel Corporation (NASDAQ:INTC) continues to lose critical market share to Advanced Micro Devices (AMD), most notably in the overall x86 segment by 8.9 percentage points YoY, from 77.5% in Q2’21 to 68.6% in Q2’22. The erosion rate has also been accelerating thus far, compared to the 4.2 percentage point fall YoY in Q2’21. Even Arm is not holding back, with a 2.5 percentage point gain YoY to 9.5% market share in the x86 consumer market by Q2’22.
Despite the robust growth and demand in the cloud market, INTC’s performance remains disappointing thus far. In Q1’22, the global cloud-service spending reached a record high of $53B, with Amazon (AMZN), Microsoft (MSFT), and Alphabet (GOOG) (GOOGL) accounting for the lion’s market share of 65% in revenues then. In return, these three tech giants spent a total of $30.07B in capital expenditures, partly attributed to their ever-expanding cloud networks globally. In contrast, INTC reported a decline of 10.2 percentage points YoY to 69.5% in Q2’22 for the x86 server segment. This time losing relevance to AMD’s growing data center market share of 22.7% in Q2’22. Thereby, further impacting INTC’s long-term dominance in the x86 market.
In addition, INTC reported notable net losses in FQ2’22 for the first time since FY2017, due to the drastic decline in consumer demand in the PC market. The situation was further worsened with the negative Free Cash Flow (FCF) generation of -$6.44B in the same quarter, due to its high capital expenditure for its foundry ambitions. As DavidHHolmes has said in one of my other analyses, “Man, that is one ugly balance sheet that only a mother could love.” Very apt, since it is also highly applicable to INTC’s recent results in FQ2’22.
In the short term, we doubt that there will be much improvement in INTC’s stock performance, since the PC segment is unlikely to recover anytime soon despite the rumored Raptor Lake launch by the end of 2022. However, bulls who remain invested in its foundry ambition may consider nibbling at these new bottoms, given the potential returns by 2025. We shall see.
INTC’s Foundry Ambitions Will Be Its Downfall During A Time Of PC Weakness
S&P Capital IQ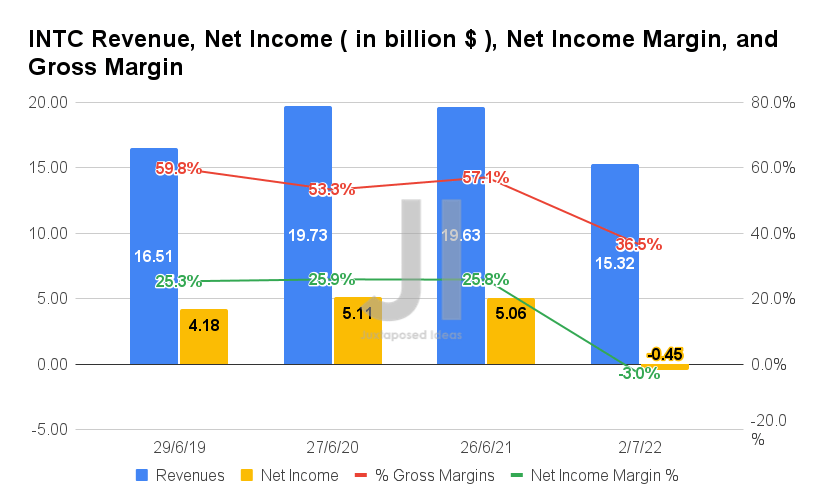
In FQ2’22, INTC reported revenues of $15.32B and gross margins of 35.5%, representing a significant decrease of -21.9% and -20.6 percentage points YoY, respectively. Most of this is attributed to the massive destruction of demand in the PC segment, due to the pull-forward growth experienced in the two years of the pandemic. This has directly impacted its profitability, with net incomes of -$0.45B and net income margins of -3% for the latest quarter, representing a significant decline of -91.8% and 28.8 percentage points YoY, respectively.
S&P Capital IQ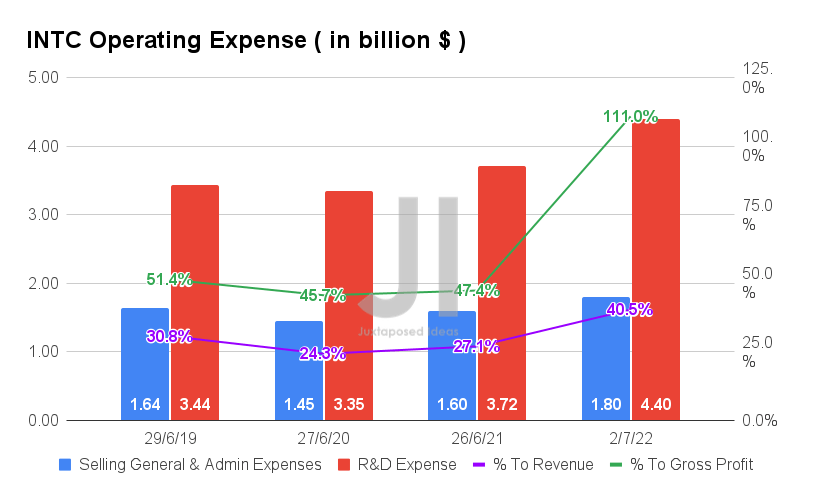
Part of INTC’s lack of profitability is also attributed to its rising operating expenses in FQ2’22 at $6.2B, representing a notable increase of 1.4% QoQ and 16.5% YoY. Thereby, directly impacting the ratio of its declining sales at 40.5% of its revenues and 111% of its gross profits in the latest quarter, indicating a substantial jump compared to 27.1% and 47.4% in FQ2’21, respectively. It is no wonder that INTC reported losses for the latest quarter.
The ratio of its elevated R&D expenses also remains questionable, at 23.7% of its revenues and 47.1% of its gross profits in FQ1’22, given the minimal returns on investments thus far. Though these rising expenses could be partly attributed to its foundry ambitions, it is also immediately evident that these headwinds will be very damaging to INTC’s stock valuations before it succeeds.
S&P Capital IQ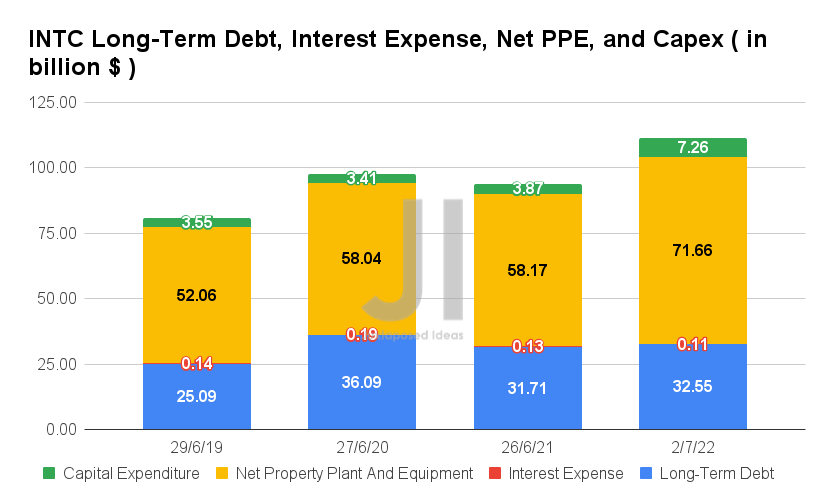
In addition, INTC also poured $7.26B in capital expenditure to an ever-expanding net PPE assets of $71.66B in FQ2’22, due to its foundry ambitions by 2024. The expansion in Capex indicated a tremendous increase of 51.3% QoQ and 87.5% YoY. This is not the end, since the company is only at the very early stages of its foundry ambitions.
S&P Capital IQ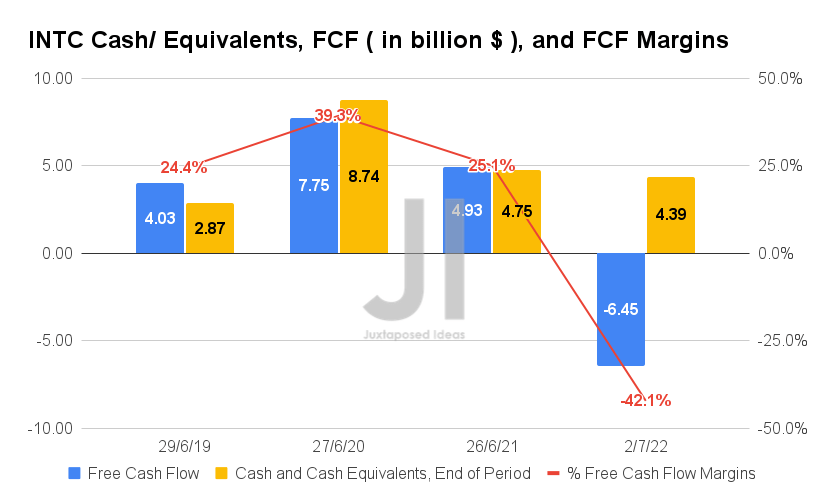
Therefore, it is no wonder that INTC reported negative FCF generation in FQ2’22. The company reported an FCF of -$6.45B and an FCF of -42.1% for the latest quarter, representing a massive decline of -56.6% and -67.2 percentage points YoY, respectively. We expect more headwinds in the short-term, assuming sustained consumer demand weakness in the PC market moving forward. Thereby, potentially impacting INTC’s cash and equivalents ahead, due to its higher Capex in the US and the EU.
The Disappointed Mr. Market Has Significantly Downgraded Intel’s Growth
S&P Capital IQ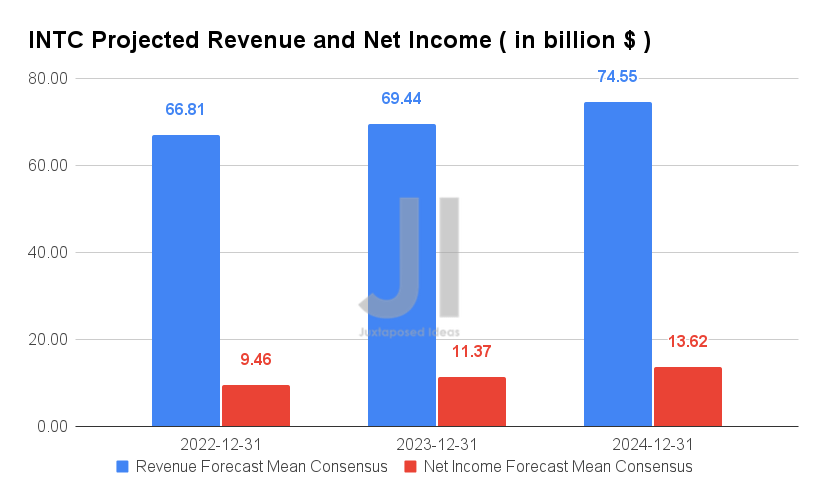
Over the next three years, INTC is expected to report an apparent deceleration of revenues and net income growth at a CAGR of -1.91% and -11.81%, respectively. Otherwise, an adj. growth at a CAGR of 0.71% and -8.33% since FY2019. It is devastating indeed, given the 2Y revenue CAGR of 4.79% during the pandemic.
These numbers also represent a substantial downgrade of -11.5% in INTC’s revenue growth and -35% in net income growth from estimates in May 2022. Consensus estimates are also rather pessimistic about its profitability ahead, given the reduced net income margins from 29.2% in FY2019, 25.1% in FY2021, and finally to 18.2% in FY2024.
For FY2022, INTC is expected to report revenues of $66.81B and net incomes of $9.46B, representing a significant fall of -15.4% and -52.3% YoY, respectively. It is no wonder the stock had also plunged by 13% post FQ2’22 earnings call.
In the meantime, we encourage you to read our previous article on INTC, which would help you better understand its position and market opportunities.
- Intel: Still The King Of The Jungle – But Is It A Value Trap?
So, Is INTC Stock A Buy, Sell, or Hold?
INTC 5Y EV/Revenue and P/E Valuations
S&P Capital IQ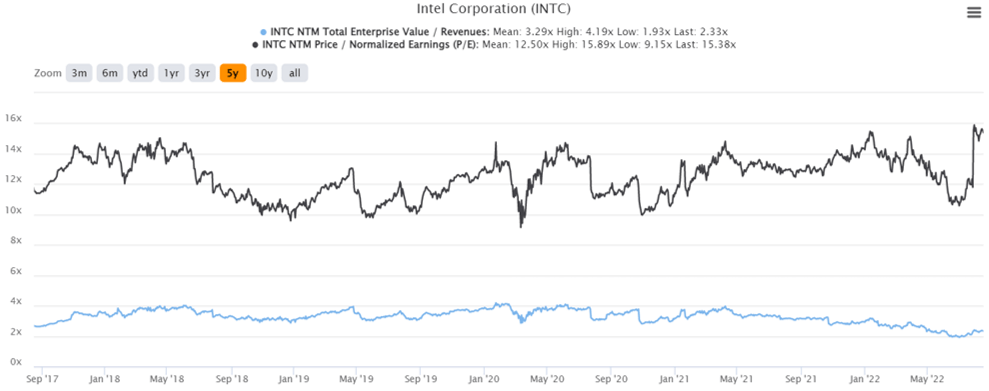
INTC is currently trading at an EV/NTM Revenue of 2.33x and NTM P/E of 15.38x, lower than its 5Y EV/Revenue mean of 3.29x though elevated from its 5Y P/E mean of 12.50x. The stock is also trading at $35.78, down 36.4% from its 52 weeks high of $56.28, nearing its 52 weeks low of $34.40.
INTC 10Y Stock Price
Seeking Alpha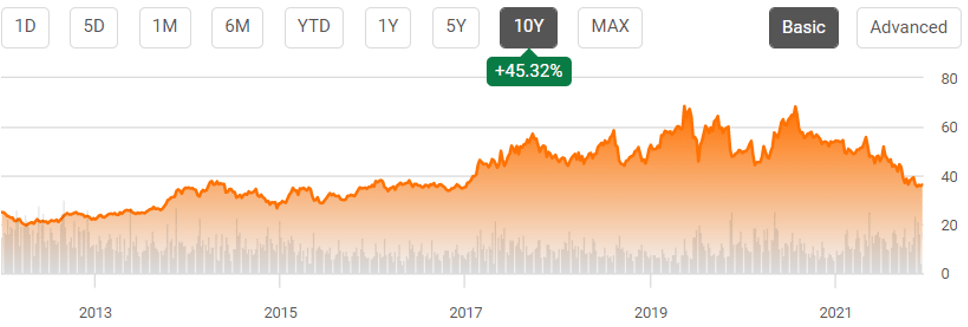
Most consensus estimates have also put a hold rating on INTC, with a price target of $40.04 and a minimal 10.61% upside from current prices. Based on the price chart above, it is also evident that the stock had reached the previous 2017 support level while losing all of its 5Y gains thus far. Thereby, potentially pointing to a new bottom for the stock in the near term, barring another catastrophic quarter in FQ3’22.
We reckon that most of the pessimism is probably already baked in, with mostly sideways price action or upwards price action from these levels. In addition, investors must not remember that INTC will benefit from the recent CHIPS Act to a certain extent. Analysts estimated up to $15B in assistance for its US manufacturing plants and an unspecified amount for its EU plants, thereby speculatively boosting the company’s FCF generation by 2024 or 2025.
Nonetheless, we still prefer to rate INTC stock as a Hold for now, given the reasons stated above.
Be the first to comment