

Chip Somodevilla/Getty Images News
The slow chipping away at Intel’s (NASDAQ:INTC) market valuation may soon end. The process has been excruciating. Worse yet, much of it was self-inflicted. The company was slow to address material issues, while competitors grabbed market share. Intel has now round tripped its entire breakout and subsequent appreciation since 2017.
Intel long term chart (Finviz with red and black marking by Zvi Bar)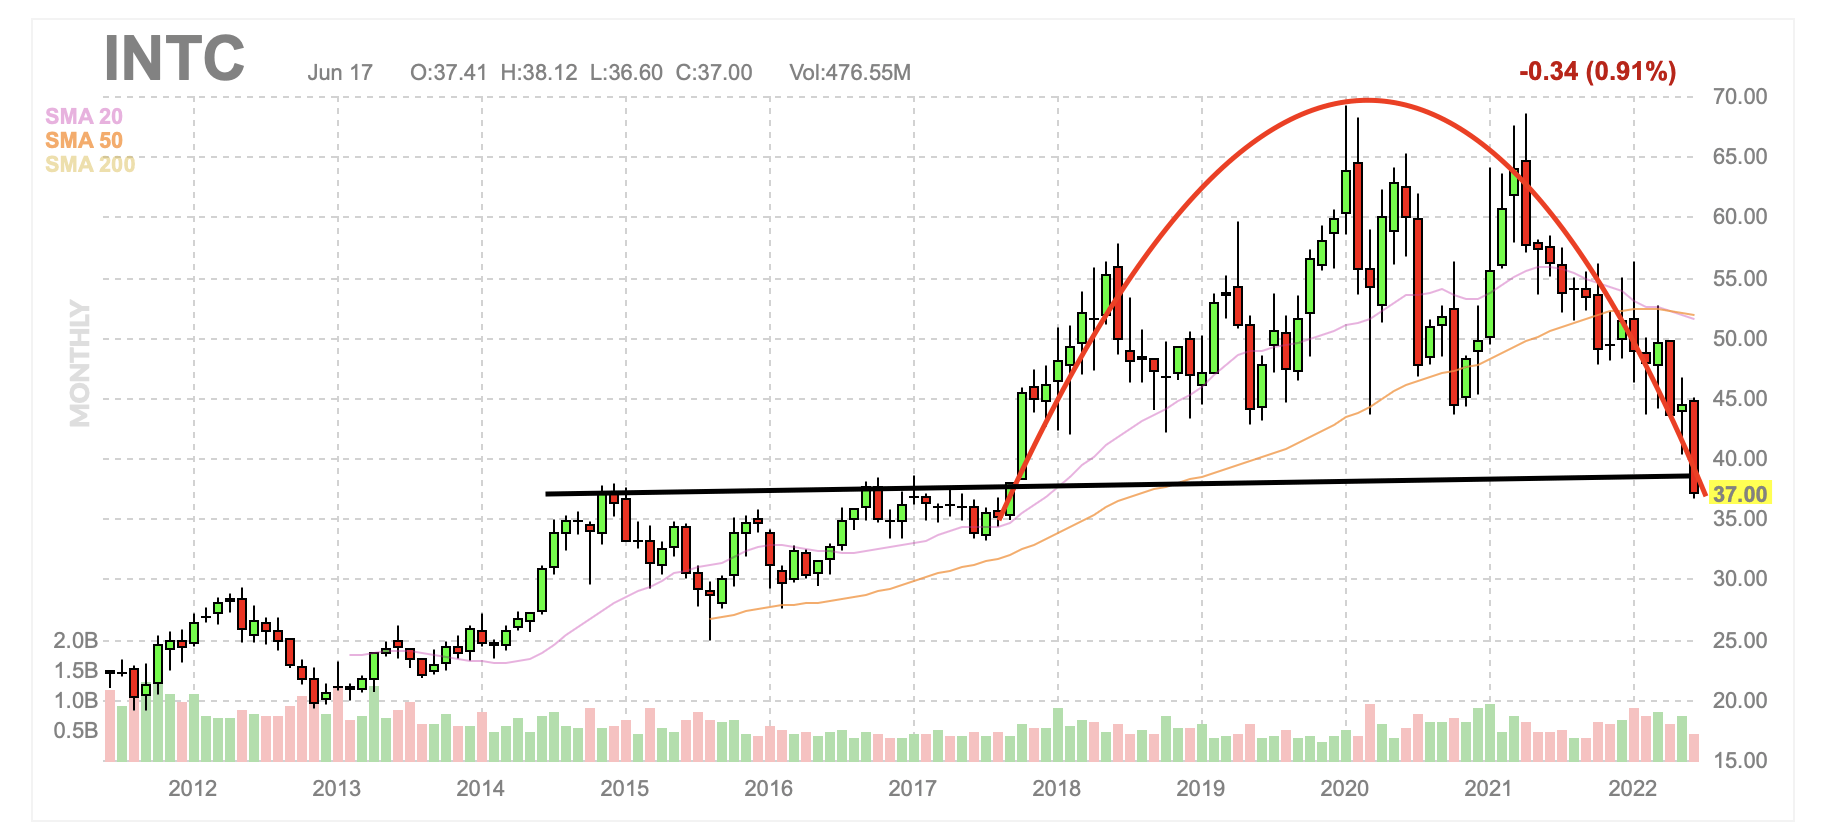
This capitulatory gap down brings Intel back into what was a difficult and tight trading range between 2014 and 2017. Throughout that time, Intel struggled to maintain a share price in the high $30s. When Intel finally did break out, it did so with a gap up that was relatively proportional to this latest gap down. As a result, there is likely to be some significant support here in the mid $30s.
This recent apparent capitulatory move was seemingly brought about by the simultaneous broad market and semiconductor weakness we are seeing right now, as well as Intel’s telegraphing reduced guidance. In particular, last week, Intel management commented to analysts that the company in seeing weaker than anticipated conditions. There is now an expectation that Intel must reduce its guidance, and several analysts already did.
Intel’s former 2022 guidance (Intel)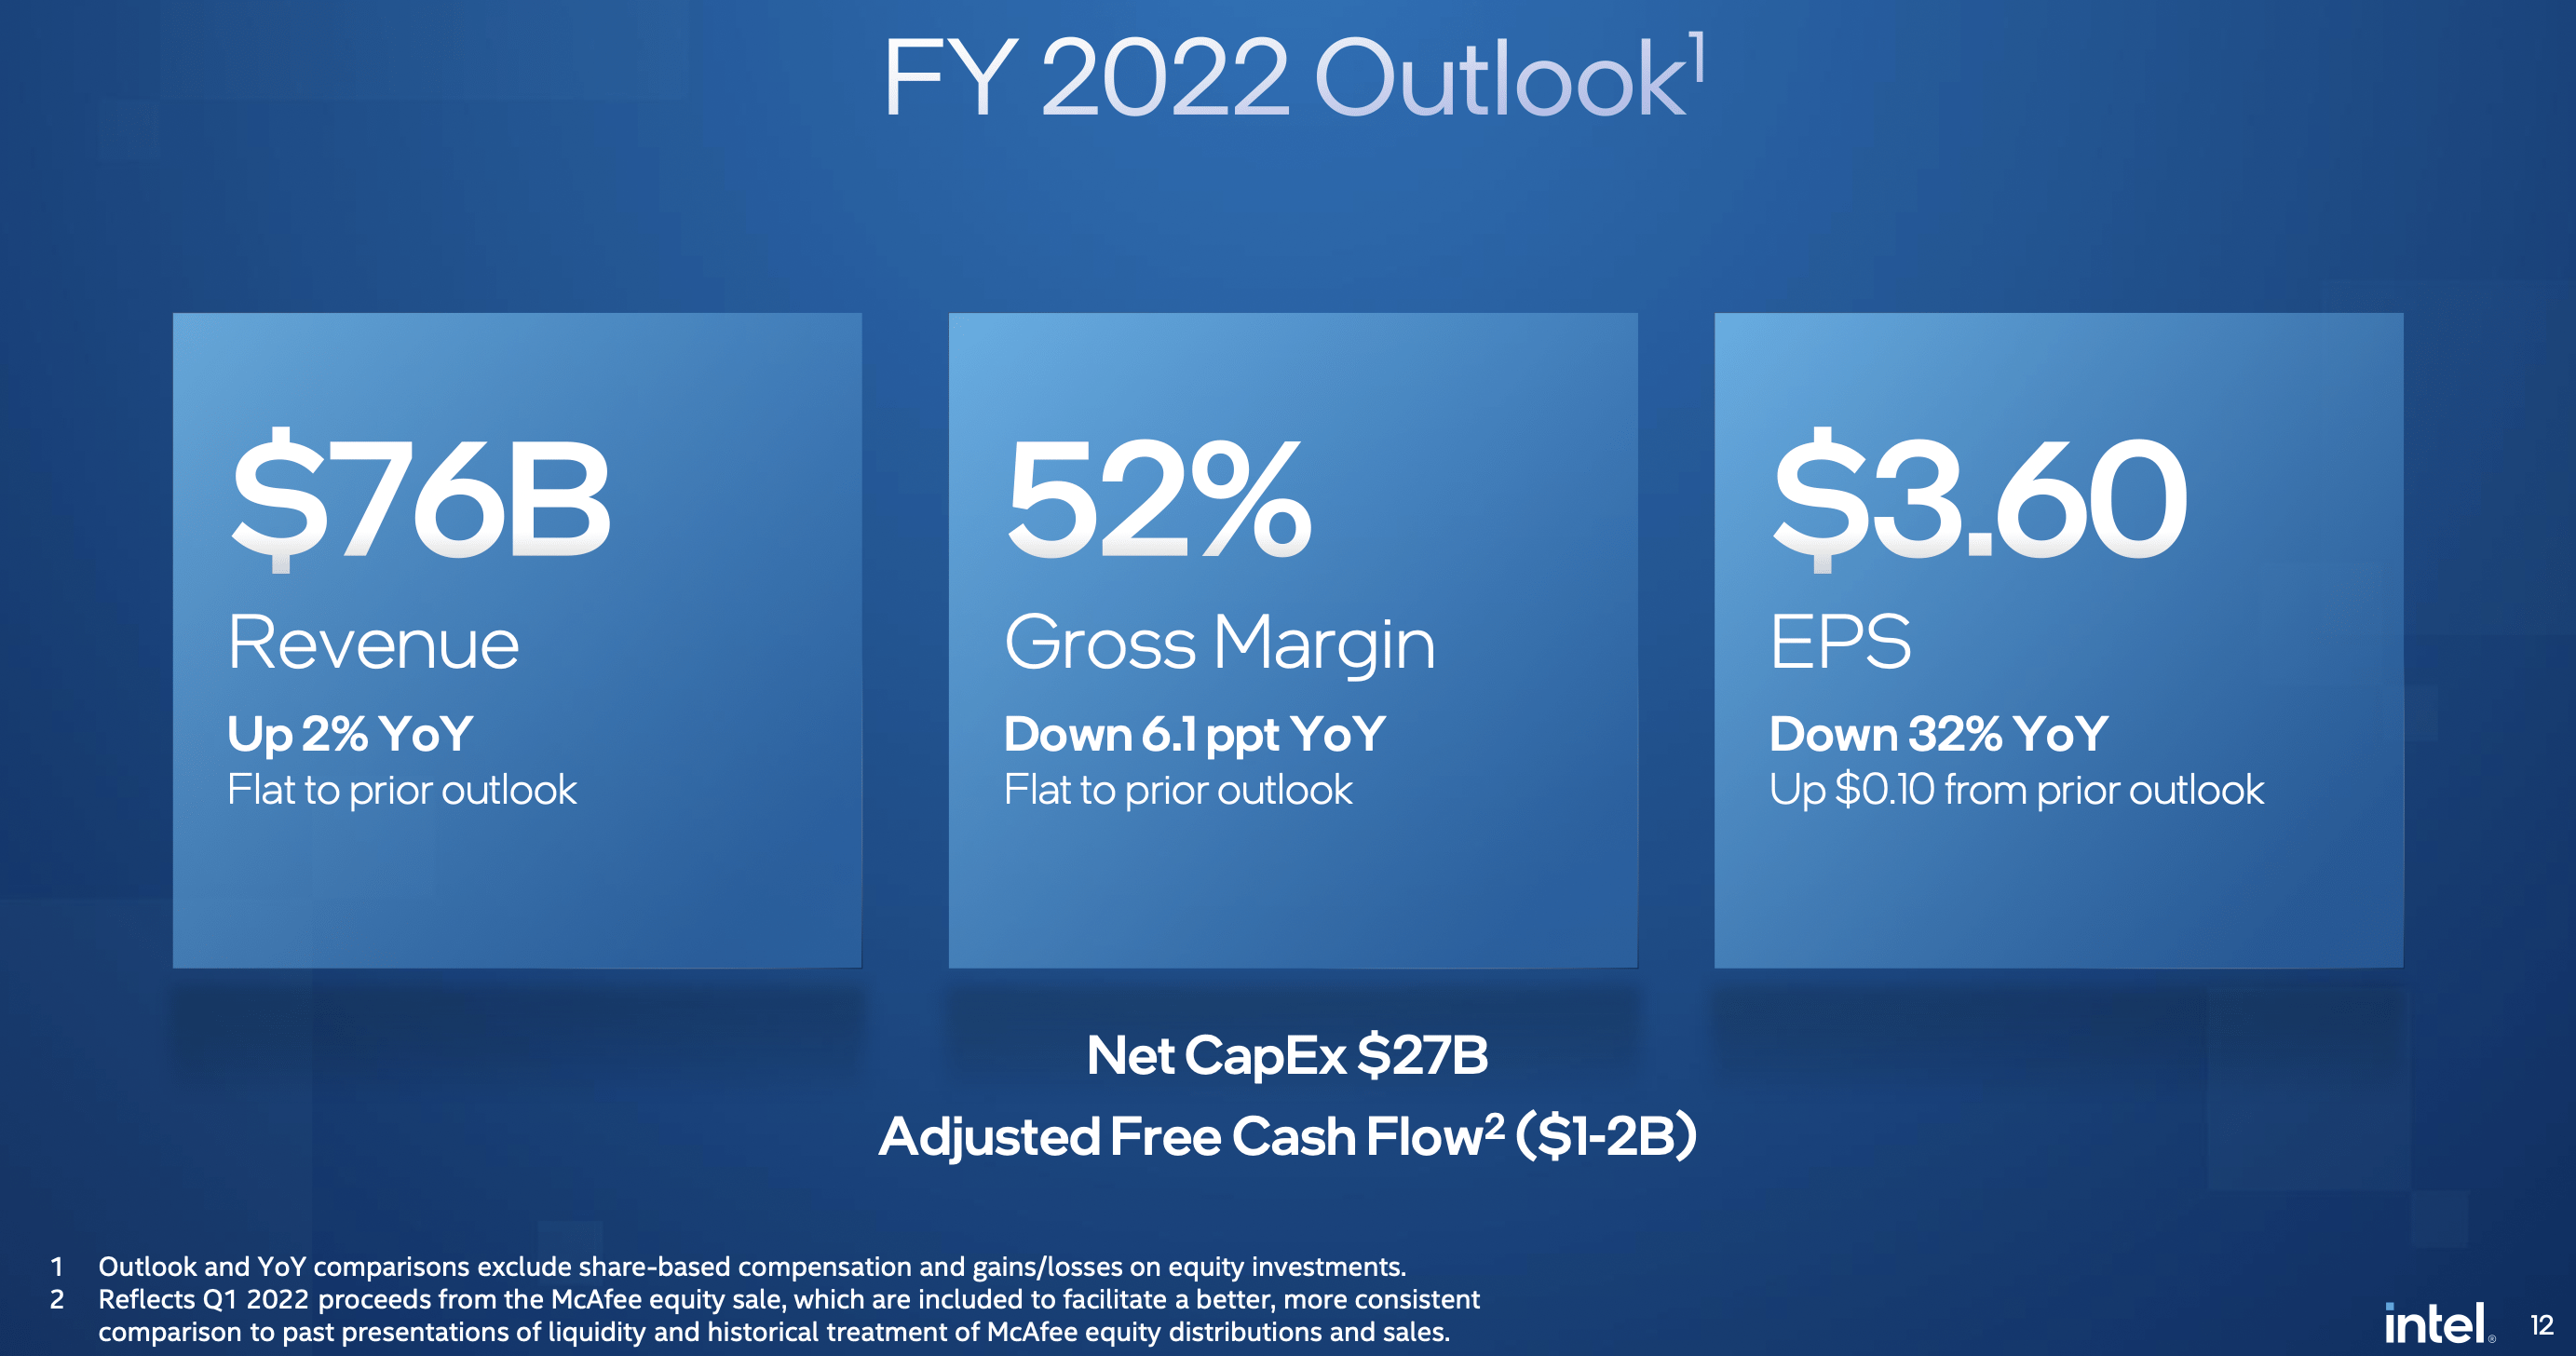
When the news that the above outlook was probably excessive first broke, Intel fell to the low $40s. That level was previously strong support. The extent of the weakness is not yet fully apparent. The current presumption seems to be that annual revenue will be about 5% lower than prior outlook, but much of that depends on how the second half goes.
I get the feeling that the low $40s could now become a level of resistance for a while, as it was for several years in the last decade. But this conundrum also comes with the high likelihood that prior support may exist too.
Intel has actually traded in tight correlation with its peer group. The below one-month chart shows Intel compared to semiconductor peers AMD (AMD) and NVIDIA (NVDA), as well as the VanEck Vectors Semiconductor ETF (SMH). They were all being pulled down together, and in proportion. The short timers probably left the sector or converted into long term holders.
recent peer comparison (Yahoo! Finance)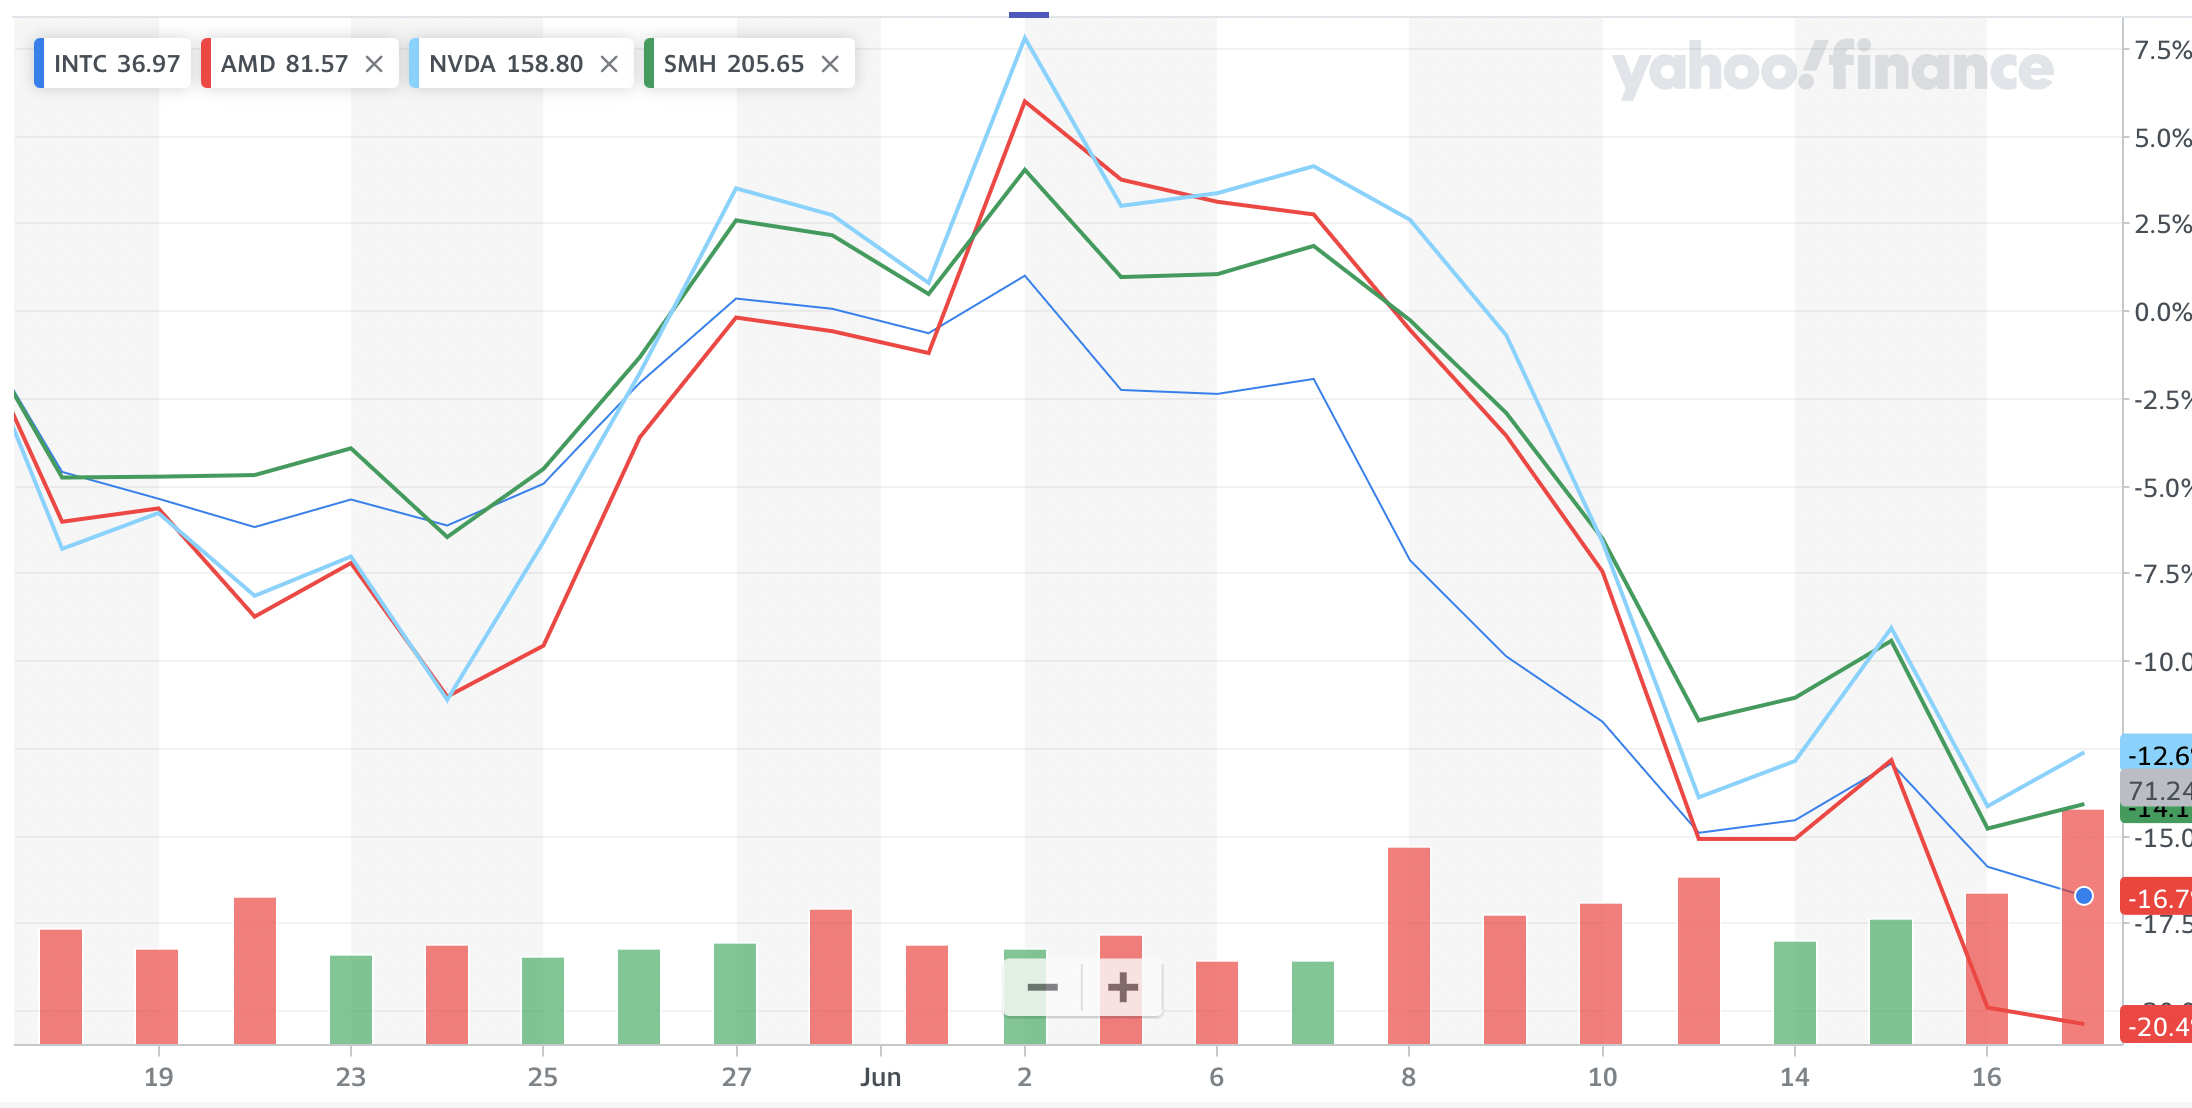
There are other reasons why Intel may find reasonable support here. Intel has a well-covered dividend thanks to its strong cash flow. Last year, Intel generated $30.0 billion of cash from operations and $11.3 billion of free cash flow. Earlier this year, the company announced a five percent addition to the quarterly payout, increasing it to $0.365 per share. A well covered strong dividend is likely to become more meaningful in the coming quarters.
Intel also has plans to undertake some massive capital expenditures as part of their more recent foundry development initiative. Intel’s current plans include an investment of more than $20 billion in order to build two new chip factories in Ohio. These initiatives put a cap Intel’s ability to make significant increases to its dividend, but another single digit percentage increase seems probable this winter.
Intel’s Ohio foundry development will be its first new manufacturing site location in 40 years. The company has increased capacity at many existing facilities over the years, including some in the United States, but nothing else from the ground up like Ohio in decades. There is also some expectation that strong government financial support will someday come, but that may take at least one more election cycle.
While it seems essential to develop domestic fabrication capacity, global fab development could easily reach the point of chip overcapacity later this decade. For example, Taiwan Semiconductor (TSM) is increasing global capacity, including further development within Arizona and Japan. Samsung (OTC:SSNLF) also announced plans to develop a fabrication facility in Taylor, Texas.
Intel has also been a habitual repurchaser of shares. Despite the significant capital expenditures Intel has planned, the company is likely to still have billions available for repurchasing shares. It is almost certainly the case that Intel will be less focused on repurchasing shares than it had been over the last several years.
Still, in the face of continued declines, it would not be surprising to see Intel increase its recently slowed repurchasing. An accelerated repurchase plan is also possible, and Intel appears to have $5-10 billion in free cash flow available to fund such a plan. I doubt such would occur in the next few months unless current support does not hold, and Intel approaches or breaches its next apparent support, at around $33.
Intel chart with support (Finviz)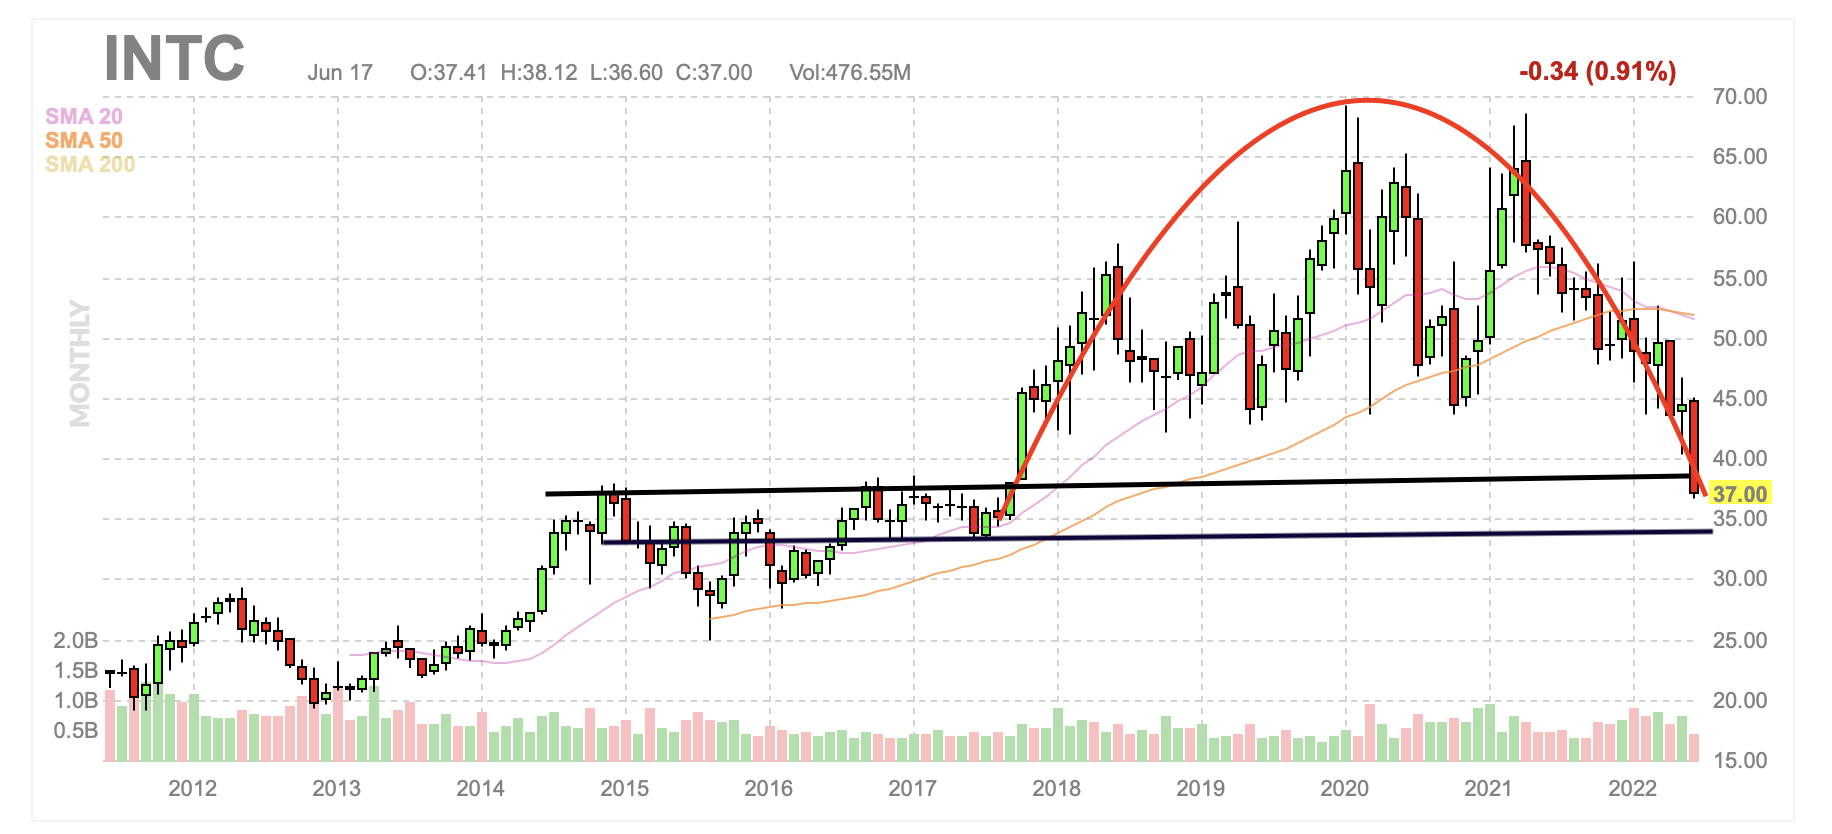
While there is no apparent catalyst to initiate a move up, Intel did appear to reach a near term capitulatory bottom on this most recent drop. It is also rather symmetrical, which could indicate significant technical support. Further, there appears to be another level of reasonably strong support, roughly 10% below current pricing. If Intel cannot hold this reasonably tight range, I would abandon this position.
Be the first to comment